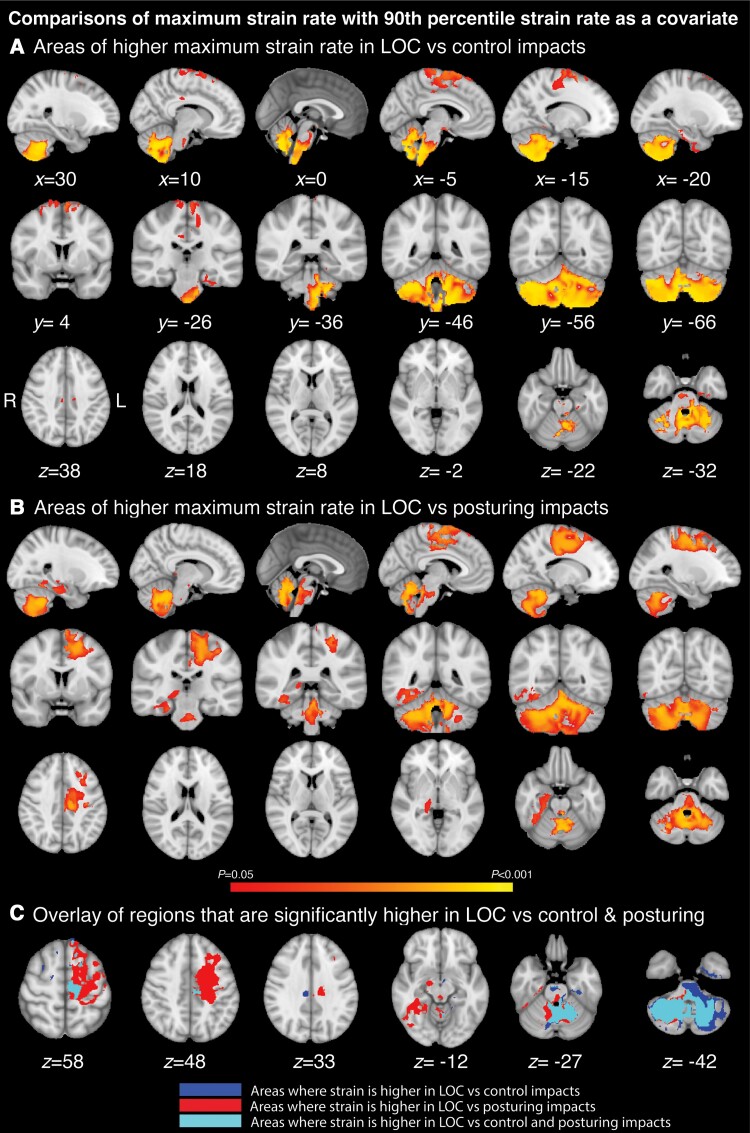
Figure 6.
Strain rates associated with loss of consciousness controlling for overall biomechanical severity. Voxel-wise analysis including 90th percentile as a covariate. (A) Areas of increased strain rate for LOC compared control impacts; (B) Areas of increased strain rate for LOC compared to posturing impacts; (C) Overlay of increased strain rate for LOC versus posturing and control impacts. x, y and z coordinates provided in MNI space. Thresholding as in Fig. 5.

