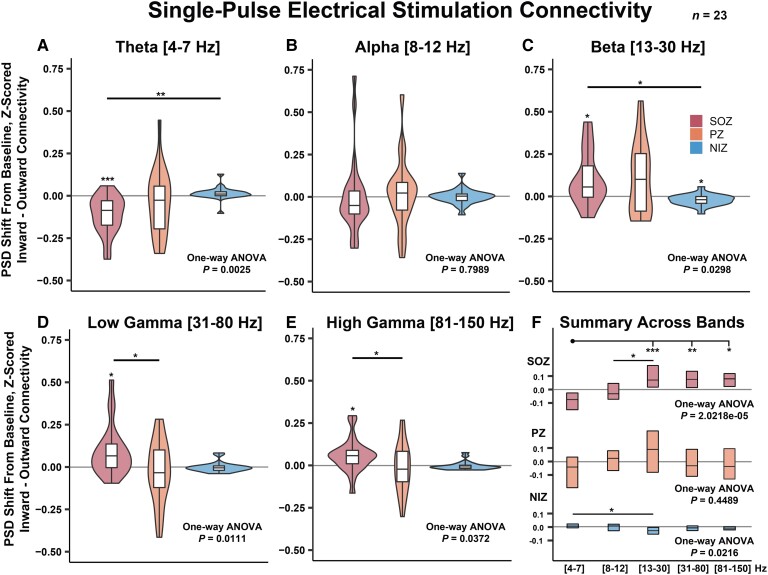
Figure 3.
SPES connectivity. Frequency-band specific low-frequency stimulation-induced change in PSD from prestimulation baseline. (A) SOZ theta power is reduced when non-SOZ SEEG contacts are stimulated. (B) Alpha-band power was not observed to be significantly altered during stimulation. (C–E) Beta, low-gamma and high-gamma band power in SOZs were elevated when non-SOZs were stimulated. (F) The inner quartiles are shown from plots A–E and separate one-way ANOVAs were conducted for each SOZ, PZ and NIZ separately. *P < 5 × 10⁻², **P < 5 × 10⁻³, ***P < 5 × 10⁻⁶. n = 23 subjects.

