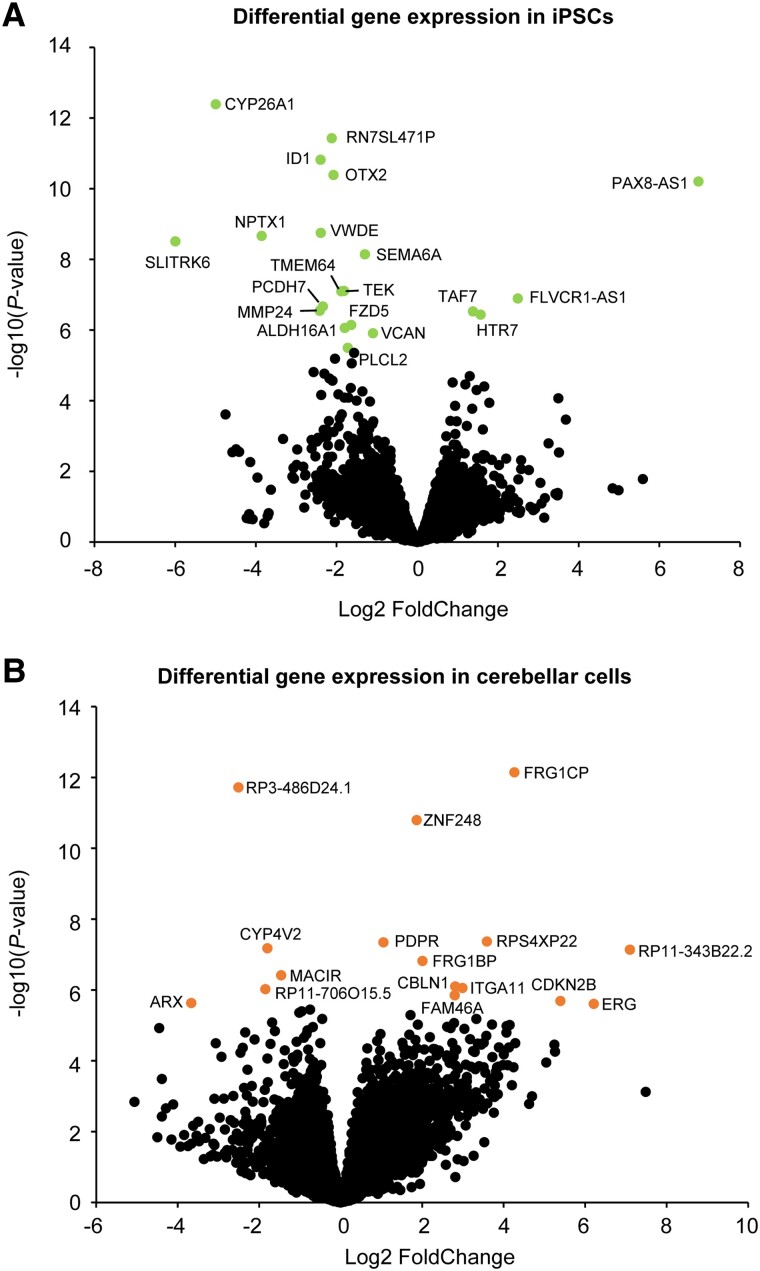
Figure 2.
Differential gene expression reveals genes involved in neurodevelopment. (A) Volcano plot of the RNA sequencing data on patient and control iPSCs. DEGs are visualized by a lighter (green) dot and gene label. (B) Volcano plot showing DEGs in 4H cerebellar cells. The significant DEGs are indicated with a lighter (orange) dot and gene label.

