Abstract
Barrier epithelial organs face the constant challenge of sealing the interior body from the external environment while simultaneously replacing the cells that contact this environment. New replacement cells—the progeny of basal stem cells—are born without barrier-forming structures such as a specialized apical membrane and occluding junctions. Here, we investigate how new progeny acquire barrier structures as they integrate into the intestinal epithelium of adult Drosophila. We find they gestate their future apical membrane in a sublumenal niche created by a transitional occluding junction that envelops the differentiating cell and enables it to form a deep, microvilli-lined apical pit. The transitional junction seals the pit from the intestinal lumen until differentiation-driven, basal-to-apical remodelling of the niche opens the pit and integrates the now-mature cell into the barrier. By coordinating junctional remodelling with terminal differentiation, stem cell progeny integrate into a functional, adult epithelium without jeopardizing barrier integrity.
Barrier epithelial organs protect the body’s interior from the external environment while performing physiological processes that require direct exposure to this environment. For example, the digestive tract epithelium both protects the body from gastric acid and enteric pathogens and, simultaneously, breaks down and absorbs ingested nutrients. The dual roles of barrier epithelia create a conundrum: Optimal physiological function requires that the tissue replace old, spent cells with new stem cell progeny, but barrier function requires that each new cell is assimilated without compromising barrier integrity1–5. How stem cell progeny seamlessly integrate into a functioning barrier is poorly understood.
The epithelial barrier is maintained by two conserved features of the epithelial cells themselves. First, a lumen-facing, apical membrane, tightly folded into microvilli or cilia, forms a mucosal shield that resists corrosives, pathogens and other lumenal insults6–8. The apical membrane is a hallmark of epithelial differentiation and serves as the barrier’s direct interface with the outside world. Second, cell–cell occluding junctions—tight junctions in vertebrates, septate junctions (SJs) in invertebrates—encircle the lateral border of each cell’s apical membrane to create seals that prevent even small molecules from passing between the lumen and body interior9.
Yet in many epithelia, new epithelial cells arise from stem cells that lack apical membrane and occluding junctions. Examples include stem cells in the mammalian trachea10–13, mammary gland14,15, prostate16, cornea17 and olfactory lining18, and the Drosophila adult midgut19–21. These stem cells are smaller than their mature progeny and inhabit the basal region of the epithelium, where they are protected from lumenal contents by the epithelium’s network of apico-lateral occluding junctions (notable exceptions are mammalian intestinal22 and alveolar23 stem cells, which have apical membrane and occluding junctions and are part of the barrier). The progeny of basal stem cells must thus form barrier-forming structures de novo as they terminally differentiate.
During developmental morphogenesis, basal-born cells are often incorporated into an epithelium via radial intercalation24–29: The new cell moves apically and wedges between pre-existing cells until its tip reaches the epithelium’s occluding junction network. The cell’s tip initially forms a pinpoint junction with its neighbours. This junction expands radially to encircle the new cell’s nascent, lumen-facing apical membrane, thus integrating the new cell into the barrier26,30–32. In adult tissues, basal stem cell progeny have been proposed to integrate via radial intercalation30,32–34. The actual mechanism, however, remained unexamined.
In this article, we examined this question using the midgut of adult Drosophila, leveraging recent advances in focused ion beam-scanning electron microscopy (FIB-SEM) and correlative light-electron microscopy (CLEM)35,36. Like many vertebrate barrier epithelia, the fly midgut’s lining is a leakproof, one-cell-thick epithelium that is continually renewed through the divisions of basal stem cells37. Investigating how cells integrate into this adult barrier epithelium, we found—unexpectedly—that integration occurs not by radial intercalation but by a morphogenetic process that has not previously been described.
We discovered that, as a basal stem cell daughter terminally differentiates, it creates a transient, occluding junction niche that supports development of the new cell’s future, lumen-facing apical surface. This pre-assembled apical compartment (PAC) comprises a microvilli-lined, bulbous, plasma membrane pit that protrudes deeply into the differentiating cell. The PAC’s opening is lidded by the basolateral membrane of overlying mature cells and ringed by a transient, expansive occluding junction that forms a sheltering niche for the developing PAC. As the new cell grows and differentiates, a basal-to-apical neighbour exchange between the new cell and its mature neighbours exposes the PAC to the gut lumen and seamlessly integrates the new cell into the barrier.
We suggest that PAC integration coordinates cell differentiation and cell addition in a physiologically active barrier epithelium by enabling differentiating cells to form barrier structures in a space shielded from lumenal insults.
Results
New stem cell progeny contact mature SJs
Mature enterocytes form the bulk of the Drosophila midgut and are responsible for its barrier function. Like vertebrate intestinal enterocytes, Drosophila enterocytes are bonded together by apical occluding junctions. In the fly gut, these take the form of smooth SJs (Figs. 1a)38,39. Also like vertebrate enterocytes, Drosophila enterocytes possess an apical brush border whose long, dense microvilli (Figs. 1a) facilitate nutrient absorption and protect against lumenal pathogens.
Fig. 1 |. The apex of a differentiating enteroblast contacts the SJ of its neighbour enterocytes.
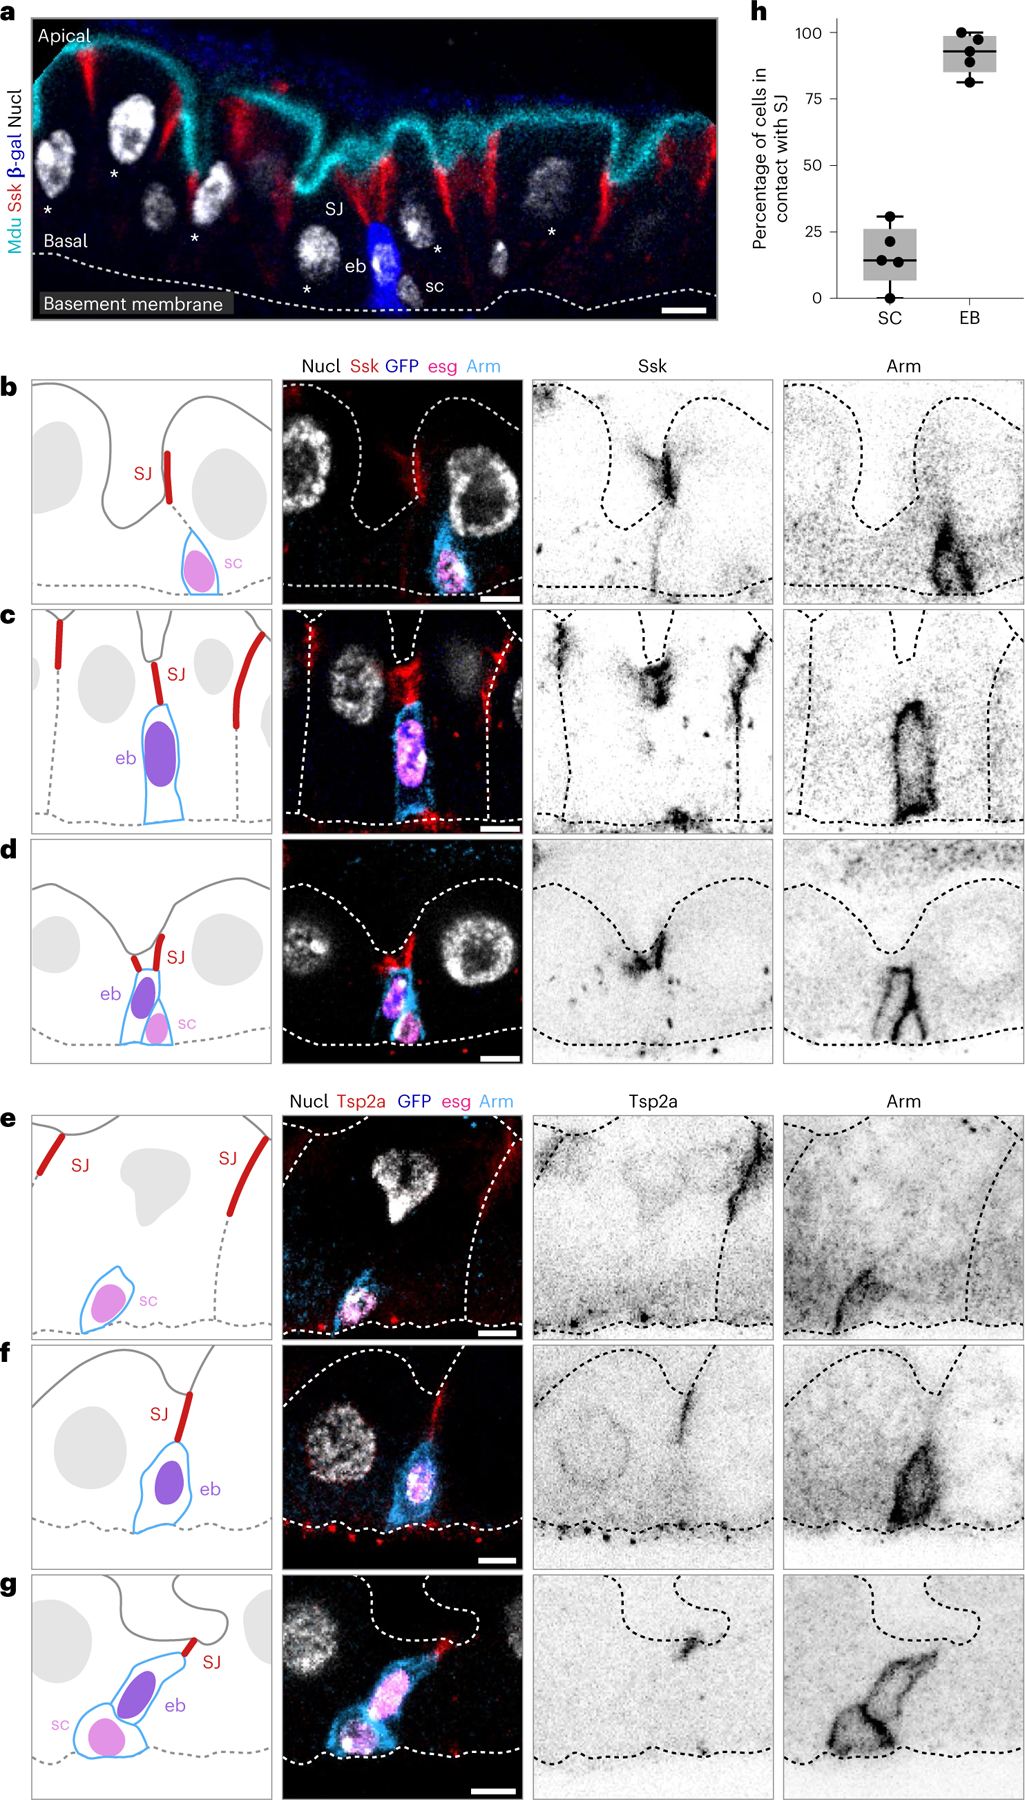
a, Architecture and stem cell lineage of the fly midgut epithelium, shown in cross-sectional view. Apical lumenal brush border (cyan, Mdu::GFP; Extended Data Fig. 4) at top; basal surface (dotted line, basement membrane) at bottom. The gut’s absorptive lineage is shown: (1) stem cells (sc) are basally localized, diploid cells that do not express Su(H)-lacZ. (2) Enteroblasts (eb) are terminally committed progeny transitioning from stem-like cells to enterocytes; eb express Su(H)-lacZ (blue, β-gal). (3) Mature enterocytes (asterisks) are large, polyploid cells that have turned off Su(H)-lacZ expression. SJs (red, Snakeskin) appear at the apico-lateral borders of enterocytes. b–g, Stem cells do not overlap with SJs, while the apex of enteroblasts contacts the basal termini of enterocyte–enterocyte SJs. Cartoons (left column) and immunofluorescent images of esg-GAL4, UAS-his2b::CFP; Su(H)-GFP:nls midguts immunostained for SJ components Ssk (red, b–d) or Tsp2a (red, e–g) and for the stem cell/enteroblast marker Arm (green; cortical). esg-driven His2b::CFP (magenta), Su(H)-driven GFP:nls (blue) and nuclei (DAPI; greyscale). Lumenal epithelial surface and basement membrane are indicated by dotted lines. Stem cells (sc) are His::CFP+, Arm+, GFP:nls− cells in b, d, e and g; enteroblasts (eb) are His::CFP+, Arm+, GFP:nls+ cells in c, d, f and g. d and g show stem cell–enteroblast pairs. b–g are representative images collected from five guts in two independent experiments. Images are projections of short confocal stacks. Scale bars, 5 μm. Full genotypes are in Supplementary Table 1. h, Quantitation of b–g. Most enteroblasts (92.1 ± 7.4%) but few stem cells (16.0 ± 11.3%) contact the SJ network. Each point represents one gut. Box plot displays median as centre line, the bounds of the box represent the first and third quartiles, and the whiskers show the minimum and maximum values (N = 5 guts; n = 119 stem cells, n = 125 enteroblasts).
Enterocytes are terminally differentiated and post-mitotic. When shed through damage or death, they are replaced by the progeny of resident stem cells3,40–42. New progeny that are fated to become enterocytes initially pass through a transitional, post-mitotic enteroblast stage43–45 (Fig. 1a). Enteroblasts are marked by Notch receptor activation, which can be visualized using Su(H)-GFP:nls and Su(H)-lacZ reporters43–46. As enteroblasts differentiate to enterocytes, they turn off Su(H) reporters, endoreplicate from 2N to 32–64N, and grow in volume by ~30-fold47.
Since fly gut stem cells lack SJs19–21, their terminal progeny must form SJs de novo during differentiation. To determine when, where and how new SJs form, we started by asking whether young enteroblasts contact the mature enterocytes’ SJ network. We combined escargot > his2b::CFP (esg) and Su(H)-GFP:nls with Armadillo (Arm) immunostaining to distinguish stem cells (esg+, Arm+) and enteroblasts (esg+, Arm+, Su(H)-GFP+). We also immunostained guts for SJ components Snakeskin (Ssk) or Tetraspanin2A (Tsp2A)48,49.
We observed SJ components at nearly all enteroblast–enterocyte interfaces: 92.1 ± 7.4% of enteroblasts overlapped with enterocyte–enterocyte SJs (Fig. 1c,d,f–h and Extended Data Fig. 1b,c,e,f; N = 5 guts, n = 125 enteroblasts). Many SJ-contacting enteroblasts exhibited small, presumably diploid, nuclei, implying that SJ contact occurs early in differentiation. As expected, stem cells generally did not overlap with SJ components (84.0 ± 11.3% of 119 stem cells from five guts; Fig. 1b,d,e,g,h and Extended Data Fig. 1a,c,d,f). SJs were never observed at stem cell–enteroblast interfaces.
Integration occurs via a PAC
Next, we determined the steps between initial SJ contact and full incorporation into the gut epithelial barrier. These steps require de novo formation of not only SJs, but also a lumenal–apical surface. We used volumetric, high-resolution images to examine where SJ and apical markers localized in Su(H)-lacZ+ cells (Fig. 2, Extended Data Fig. 2 and Supplementary Video 1). Since β-galactosidase (β-gal) is highly perdurant (>20 h half-life50), it labels cells even after Su(H) transcriptional activity has turned off (Extended Data Fig. 2). This feature enabled us to identify not only early-stage differentiating cells (enteroblasts, 2–8N), but also later-stage differentiating cells (pre-enterocytes, 8–32N), whose size and ploidy can otherwise overlap with mature enterocytes.
Fig. 2 |. SJ and apical membrane morphology define six stages of barrier integration.
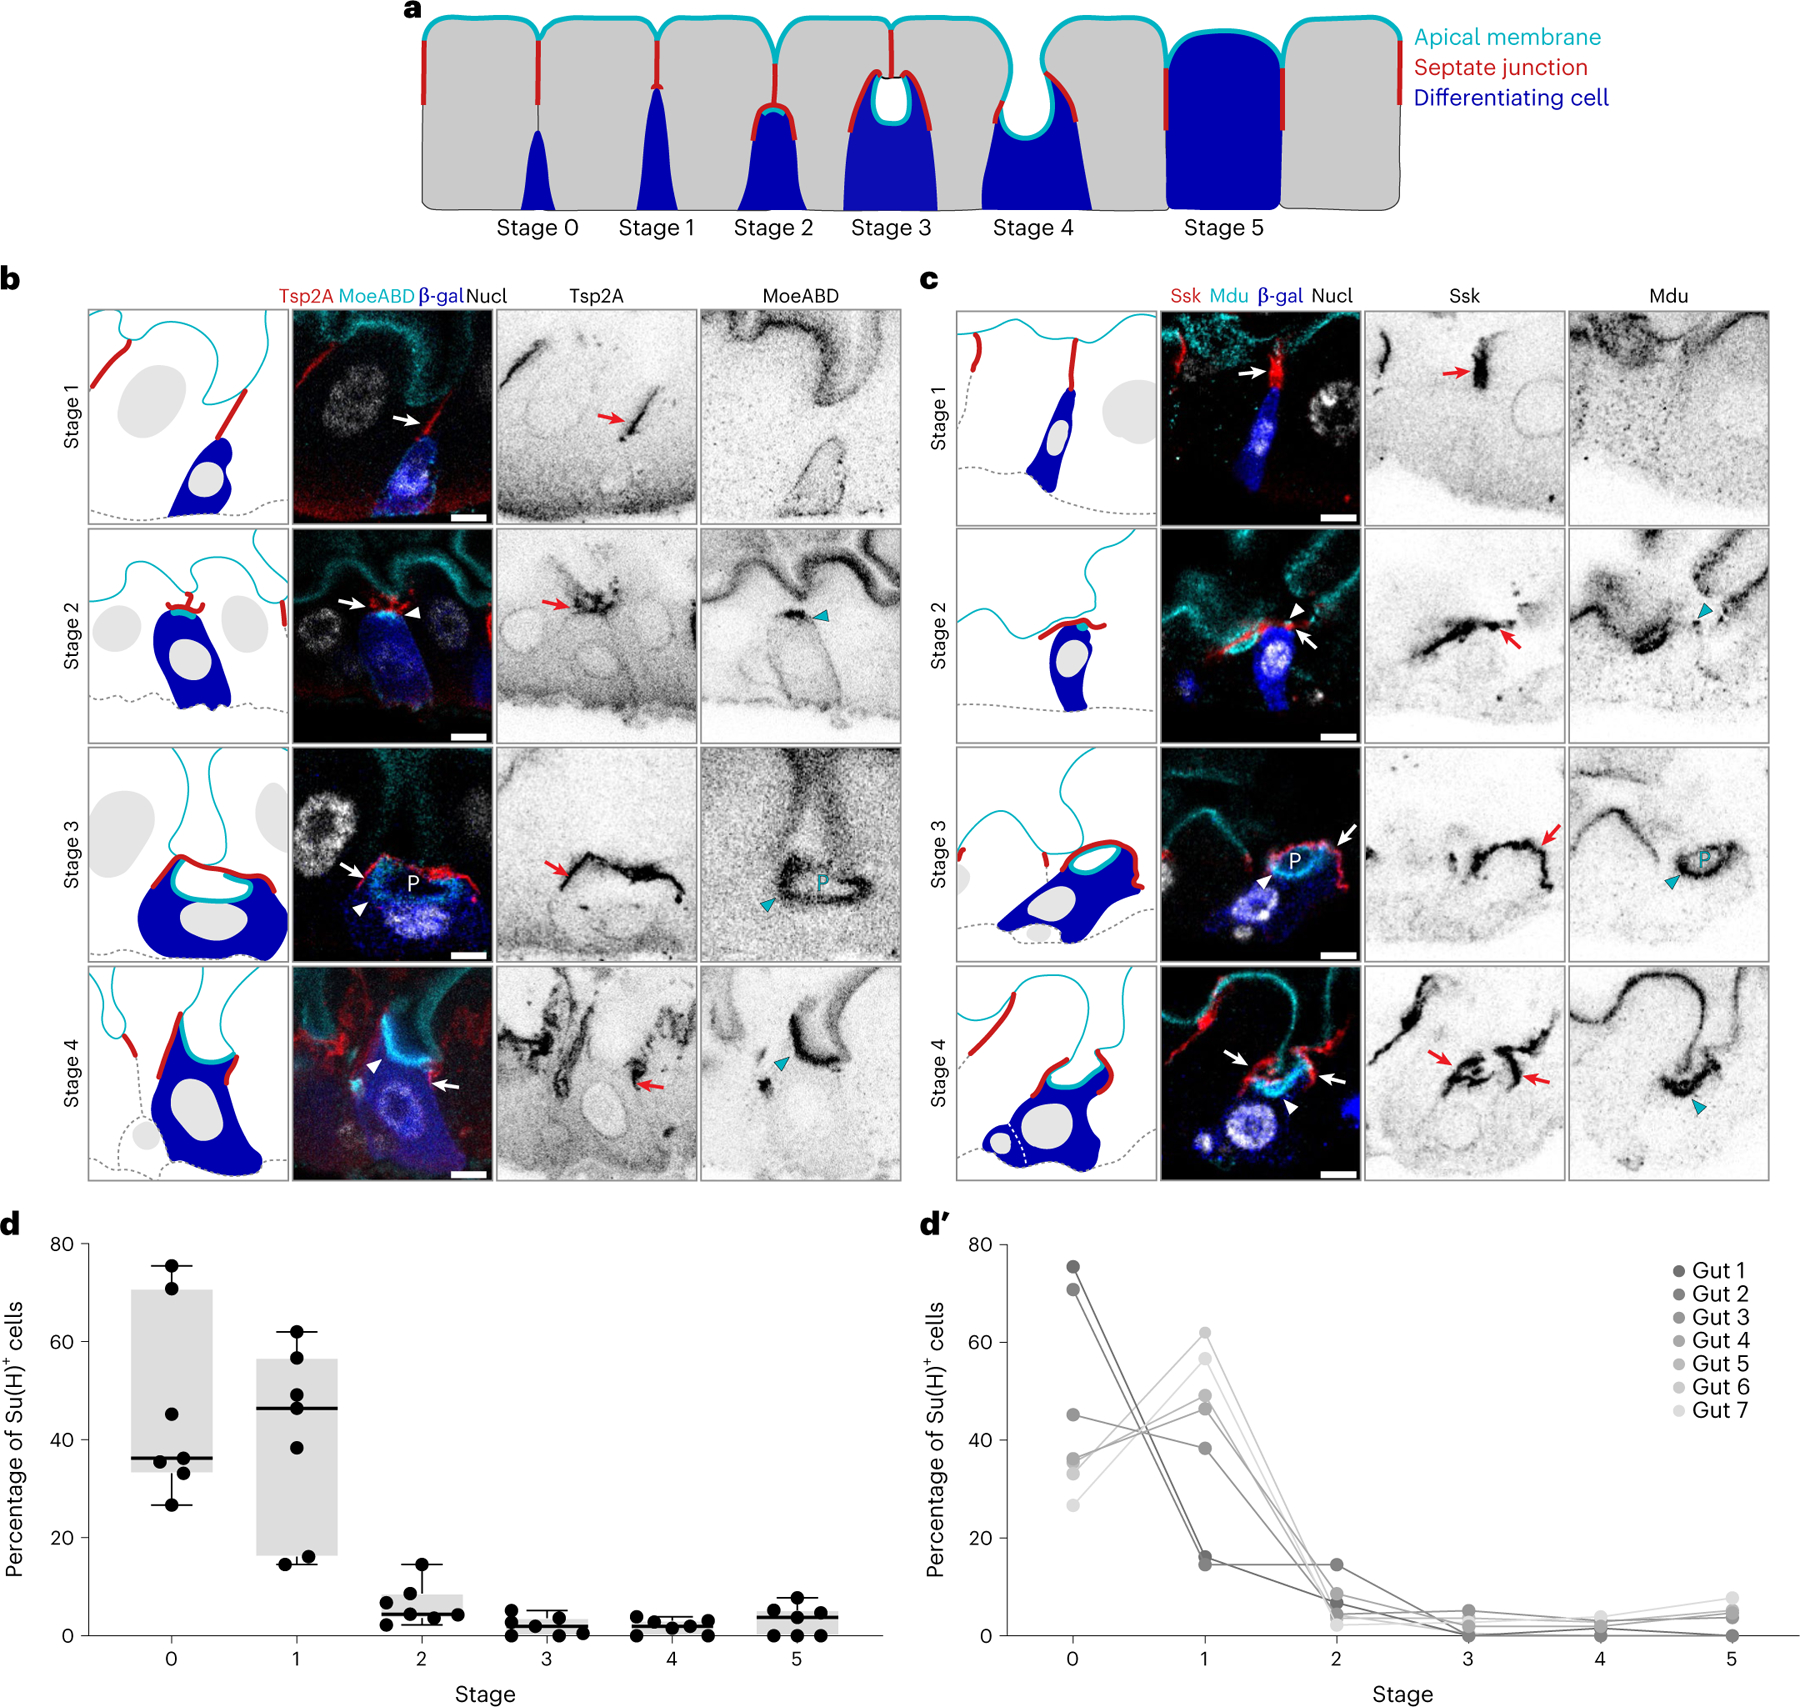
a, Cartoon model of stages 0–5 of cell integration depicting enteroblasts/pre-enterocytes (blue), apical membrane (cyan), SJ (red) and enterocytes (grey). b,c, Immunofluorescent images of Su(H)-lacZ+ cells in stages 1–4. Representative images collected from 40 guts in two independent experiments. SJs shown in red (b, Tsp2A; c, Ssk), marked by arrows. Apical markers shown in cyan (b, MoeABD::GFP; c, Mdu::GFP), and apical markers of Su(H)-lacZ+ cells marked by arrowheads. PAC (P) noted in stage 3 cells. Su(H)-lacZ in blue (b and c, β-gal). Nuclei (Nucl) shown in greyscale (b, His2av::mRFP; c, DAPI). Images are projections of short confocal stacks. Scale bars, 5 μm. β-Gal channel is shown in Extended Data Fig. 2. Full genotypes are in Supplementary Table 1. d,d′, Percentage of Su(H)-lacZ+ cells in each integration stage (N = 7 guts; n = 293, 180, 292, 192, 192, 187 and 248 cells). Box plot displays median as centre line, the bounds of the box represent the first and third quartiles, and whiskers show the minimum and maximum values (d). Line graphs of individual gut samples (d′).
In Su(H)-lacZ+ cells, the localization of apical markers and morphology of SJs suggested six stages of barrier integration (Fig. 2a and Extended Data Fig. 3). Cell size and ploidy generally increased with successive stages, consistent with these stages representing early-to-late phases of enteroblast–enterocyte maturation47,51–53.
In stage 0, enteroblasts lack apical polarity and do not contact SJs. They are small, with apparently diploid nuclei; this stem-like appearance is consistent with the cells being in the earliest stages of differentiation.
In stage 1 (Fig. 2b,c, top row), some apical markers, such as MoeABD::GFP (a marker of filamentous actin that labels the brush border of mature enterocytes34,54), localize to the enteroblast plasma membrane but are unpolarized (Fig. 2b). Other apical markers, such as Meduse/MISP (Mdu; Extended Data Fig. 4 and Methods) are not yet detected (Fig. 2c). The apex of stage 1 enteroblasts contacts the basal terminus of enterocyte–enterocyte SJs (Fig. 2b,c).
In stage 2 (Fig. 2b,c, second row), apical markers polarize to the enteroblast apex, forming a bright plaque covered by broadened SJ contacts (Fig. 2b,c). Some stage 2 enteroblasts are small and probably diploid, akin to stage 1 enteroblasts (Fig. 2c). Others are slightly larger and have nuclei that appear intermediate in ploidy (4–8N) (Fig. 2b).
In stage 3 (Fig. 2b,c, third row), apical markers—now highly expressed—localize to a conspicuous, concave structure that is enclosed by the broadened SJ. We conjecture that these structures originate the enterocytes’ future lumen-contacting surface; hence, we designate them PACs. Since the size and ploidy of PAC-containing cells resembles immature enterocytes, we refer to these cells as pre-enterocytes.
In stage 4 (Fig. 2b,c, fourth row), the cell’s apical surface contacts the gut lumen, and SJs circumscribe it. Stage 4 cells are thus integrated into the epithelial barrier, although their smaller size and the concave, PAC-like shape of their apical surface marks them as pre-enterocytes.
In stage 5 (Fig. 2a), the cell everts its lumenal–apical surface to form a convex shape and attains its mature size and ploidy, completing terminal differentiation.
To determine the relative prevalence of these stages, we identified and staged all Su(H)-lacZ+ cells in the R4 region of steady-state (4 day) guts aggregated from two independent replicates (Fig. 2d) (n = 1,584 cells, N = 7 guts). Stages 0–1 represented ~85% of these cells (stage 0: 46.7 ± 9.3%; stage 1: 40.5 ± 18.7%) (Fig. 2d′). Cells in stages 2–5 together made up only ~13% of Su(H)-lacZ+ cells (stage 2: 6.4 ± 4.2%; stage 3: 2.0 ± 2.0%; stage 4: 1.9 ± 1.5%; stage 5: 3.1 ± 3.1%) (Fig. 2d). The relative abundance of early stages is consistent with prior reports51–53.
Synchronized differentiation exhibits the predicted sequence of stages
The six stages of PAC integration (Extended Data Fig. 3) were inferred using fixed midguts at steady state. However, fixed tissues are static, and all stages of differentiation co-exist at steady state. Hence, these stages plausibly might represent multiple parallel mechanisms rather than the single mechanism we propose. To test if PAC integration is the predominant mechanism of new cell addition, we synchronized a cohort of newborn enteroblasts and followed its differentiation over time. If cells in this cohort collectively proceed through stages 1–5 in order, this finding implies that a single mechanism predominates.
We synchronized enteroblasts by ectopically expressing the transcription factor Sox21a, which triggers enteroblast differentiation without affecting initial enteroblast specification52,55–58. Specifically, we drove Sox21a in gut stem cells and enteroblasts using esg-GAL4 under inducible, GAL80ts control (henceforth referred to as esgts)59. esgts > sox21a was induced in newly eclosed flies (adult day 0) (Fig. 3a); this timing overrides the typical, variable onset of endogenous Sox21a expression52,60 and causes the cohort of day 0 enteroblasts to enter differentiation simultaneously.
Fig. 3 |. Synchronized differentiation drives Su(H)-lacZ+ cells through sequential stages of PAC integration.
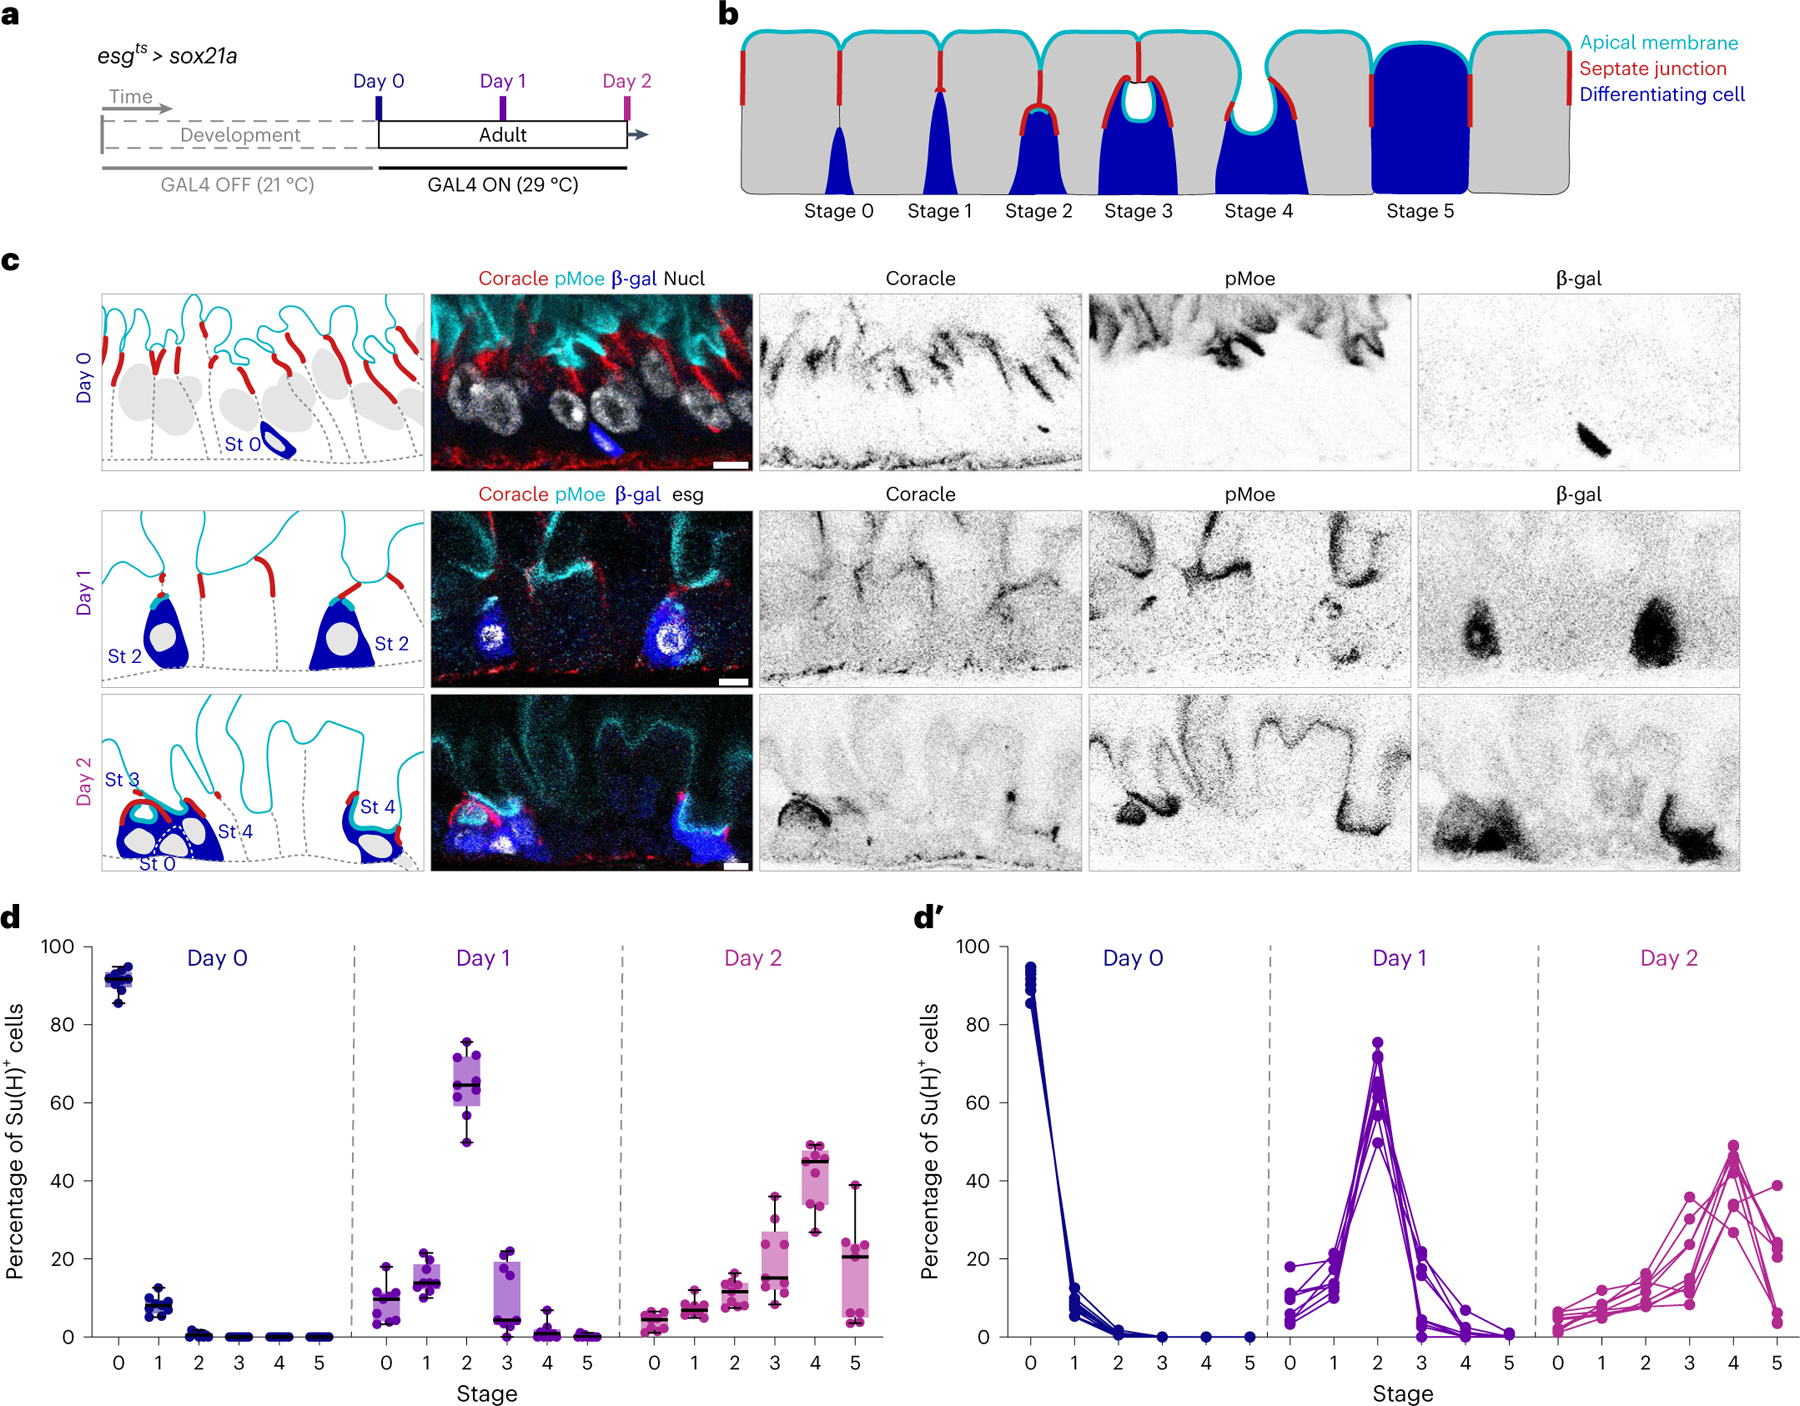
a, Experimental design for synchronizing enteroblast-to-enterocyte differentiation. esgts-controlled expression of the terminal differentiation factor Sox21a was induced by 29 °C temperature shift at adult day 0 to drive differentiation of a large cohort of enteroblasts born during the first 24 h post-eclosion. UAS-his2b::CFP and Su(H)-lacZ were also included to mark Sox21a-expressing cells and enteroblasts/pre-enterocytes, respectively. Full genotypes are in Supplementary Table 1. Guts were dissected before induction at day 0 or after induction at day 1 or 2. b, Model of PAC integration. Apical membrane (cyan), SJ (red) and enteroblast/pre-enterocytes (blue). c, Representative images collected from 27 guts in three independent experiments with immunostaining for β-gal (blue), the apical marker phospho-Moesin (pMoe; cyan), and the SJ marker Coracle (red). Nuclear stains (greyscale) are DAPI (day 0; esgts was inactive in day 0 guts) and esgts-driven his2b::CFP (days 1 and 2). Day 0 enterocytes have higher density because the gut lumen is not yet distended by ingested food. Scale bars, 5 μm. d,d′, Quantitation of stages over time. Box plots (d) show the aggregate stage distribution of all Su(H)-lacZ+ cells counted at days 0, 1 and 2 (N = 9 guts per timepoint; n = 6,596 cells total). Box plots display median as centre line, the bounds of the box represent the first and third quartiles, and minimum and maximum values are shown by whiskers (d). Line graphs of individual gut samples (d′).
We collected midguts at 0, 1 and 2 days after eclosion/sox21a induction (Fig. 3a), identified all Su(H)-lacZ+ cells (Fig. 3c, β-gal) in the gut R4 region, and classified them as stages 0–5 on the basis of apical marker localization and SJ morphology (Extended Data Fig. 3 and Fig. 3b,c). Some Su(H)-lacZ+ cells (11.5% of 6,596 cells total) exhibited poor immunostaining and were omitted from further analysis. We plotted the distribution of stages exhibited by the remaining Su(H)-lacZ+ cells (Fig. 3d).
Satisfyingly, we found the stage distribution of Sox21a-synchronized enteroblasts exhibits a single peak that shifts through the predicted stages of PAC integration in order. This peak is centred on stage 0 at day 0 (91.3 ± 2.8% of all day-0 Su(H)-lacZ+ cells), stage 2 at day 1 (64.6 ± 8.0%) and stage 4 at day 2 (41.3 ± 7.9%) (Fig. 3d). This aggregate pattern is reflected at the level of individual guts (Fig. 3d′), although in some day-2 guts the proportions of stages 3 or 5 are slightly higher than stage 4. Importantly, we found no evidence for multiple parallel mechanisms, such as guts that exhibited multiple peaks or no peaks. Altogether, these findings demonstrate new cells are added predominantly through PAC integration.
Basal-to-apical remodelling of a transitional SJ
The de novo SJ that initially forms between a differentiating cell and its mature neighbours must remodel extensively to reach its final shape. To shed light on this remodelling, we considered this transitional SJ as encompassing two non-overlapping zones––the SJ between the enterocytes directly apical to the progenitor cell (SJEC–EC), and the SJ between the progenitor cell (enteroblast or pre-enterocyte) and its neighbour enterocytes (SJPC–EC) (Fig. 4a).
Fig. 4 |. PAC integration involves basally directed growth of a transitional SJ with distinct apical EC–EC and basal PC–EC zones.
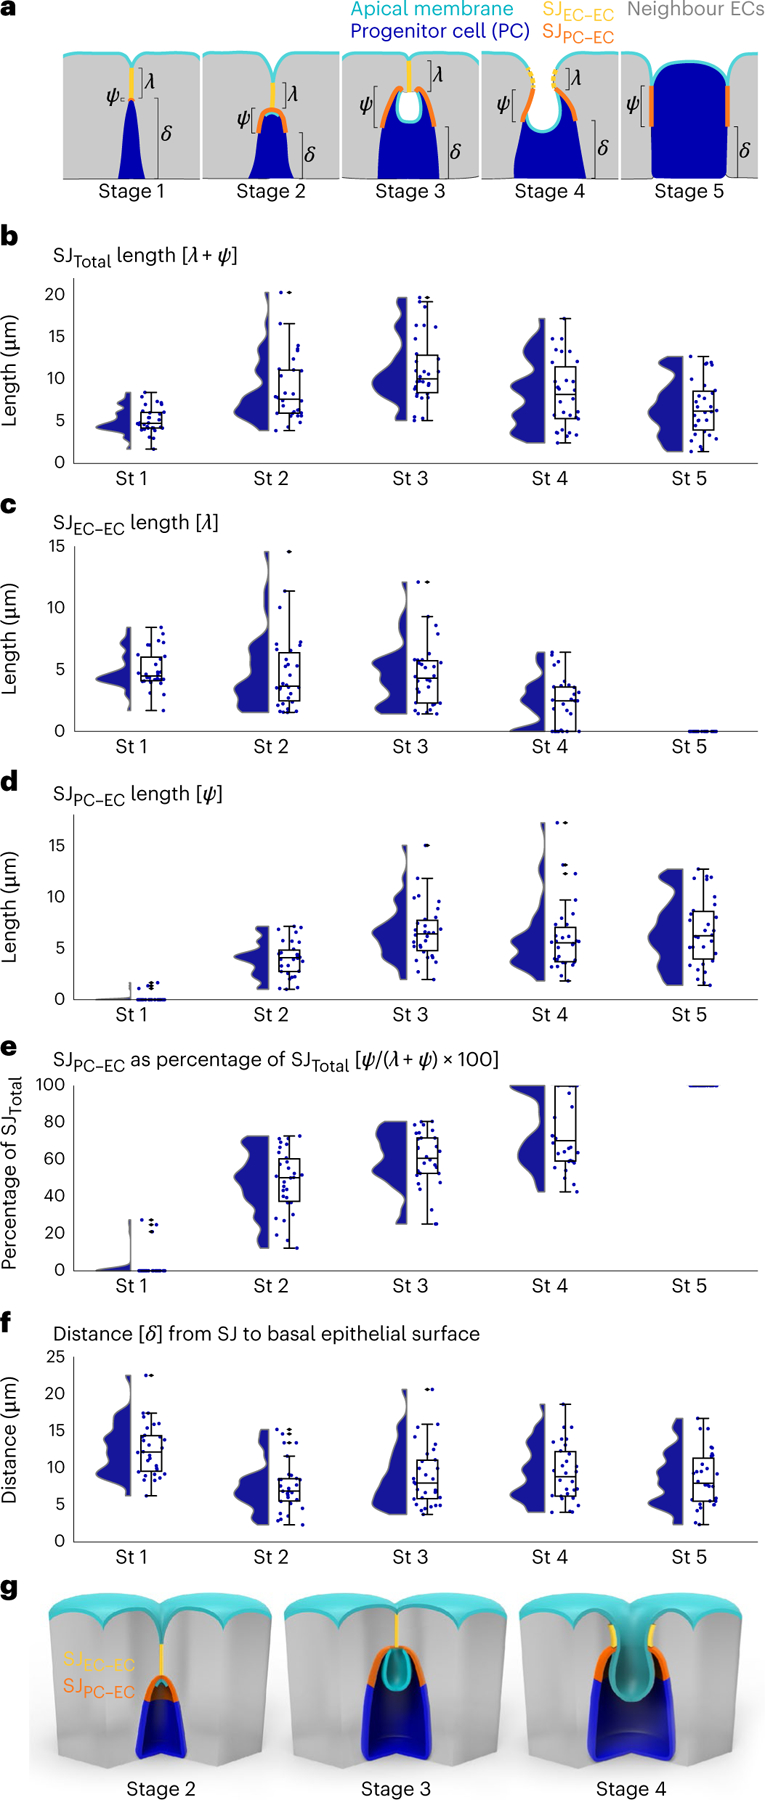
Volumetric images were analysed from midguts that expressed Su(H)-lacZ and an apical marker (moeABD::GFP or mdu::GFP) and that were immunostained for β-gal and an SJ marker (Ssk or Tsp2a). Cells were randomly selected from across eight guts in two independent experiments. Full genotypes are in Supplementary Table 1. a, Cartoon of the three SJ parameters measured at each integration stage (St): λ, SJEC–EC length; ψ, SJPC–EC length; δ, distance from the basal edge of the SJ to the basal epithelium. Apical membrane, cyan; SJEC–EC, yellow; SJPC–EC, orange; progenitor cell (Su(H)-lacZ+ enteroblast or pre-enterocyte), blue; mature neighbour enterocytes, grey. For measurement details, see Methods. In stage 4 depiction, dashed yellow line represents SJEC–EC that is out-of-plane of the drawing. b–f, Raincloud plots (violin plot on left; box plot on right) show the indicated measurements for SJs associated with stage 1–5 progenitor cells (blue; n = 30 SJs for each stage): total length of SJ associated with progenitor cell (λ + ψ) (b); length of SJEC–EC (λ) (c); length of SJPC–EC (ψ) (d); SJPC–EC as percentage of SJTotal (ψ/(λ + ψ) × 100) (e). f, Distance from basal edge of the SJ to the basal epithelium (δ). Box plots display median as centre line, the bounds of the box represent the first and third quartiles, whiskers show the minimum and maximum values shown by whiskers, and diamonds indicate outliers (N = 7 guts; n = 150 progenitor cells). g, Cartoons show 3D structure of transitional stage 2–4 SJs as defined by b–f. Apical membrane (cyan), progenitor cell (blue) and mature neighbour enterocytes (grey), apical SJEC–EC (yellow) and basal SJPC–EC (orange). During stages 2–4, the basal SJPC–EC expands at the expense of the apical SJEC–EC during a basal-to-apical neighbour exchange.
We measured the lateral lengths of SJEC–EC and SJPC–EC for 150 individual Su(H)+ progenitor cells using the steady-state gut samples in Fig. 2 (Fig. 4c,d). We also summed these values to determine SJTotal (Fig. 4b), and we calculated the percentage of SJTotal represented by SJPC–EC (Fig. 4e). Finally, we measured the distance (δ) between the basal-most edge of SJPC–EC and the basal epithelial surface (Fig. 4f). For comparison, we also measured SJTotal and δ for 300 nearby neighbour enterocyte–enterocyte SJs (Extended Data Fig. 5).
In stage 1, SJTotal is shortest (5.1 ± 1.5 μm (mean ± standard deviation referenced in text; box plots in figures display median, minimum and maximum) (Fig. 4b)) and composed almost entirely of SJEC–EC (Fig. 4c) with minimal, if any, measurable SJPC–EC (Fig. 4d,e). The SJ is also furthest from the basal surface (12.5 ± 3.6 μm) (Fig. 4f).
In stage 2, SJTotal increases to 8.8 ± 3.9 μm (Fig. 4b), surpassing mature SJs between nearby enterocytes (Extended Data Fig. 5b). This increase is due to growth of SJPC–EC, which extends to 4.0 ± 1.7 μm (Fig. 4d) and becomes 48.0 ± 16.9% of SJTotal (Fig. 4e). By contrast, SJEC–EC shrinks to 4.8 ± 3.1 μm (Fig. 4c). The stage 2 SJ is only 7.5 ± 3.4 μm from the basal surface—40% closer than at stage 1 (Fig. 4f). Neighbour enterocyte–enterocyte SJs also extend basally, although to a lesser degree (Extended Data Fig. 5c).
In stage 3, SJTotal reaches its maximum: 11.1 ± 4.0 μm, a 118% increase over stage 1 (Fig. 4b). Growth is driven by an increase in SJPC–EC, which reaches 6.6 ± 2.8 μm (Fig. 4d) and represents 60.0 ± 15.3% of SJTotal (Fig. 4e). In contrast, SJEC–EC remains relatively unchanged at 4.6 ± 2.6 μm (Fig. 4c). Stage 3 SJs remain a similar distance from the basal surface as stage 2 (Fig. 4f).
In stage 4, SJTotal shortens to 8.3 ± 4.1 μm (Fig. 4b). The SJEC–EC, which opens to fuse the PAC with the gut lumen (Fig. 4g), shrinks to just 2.3 ± 2.0 μm (Fig. 4c). By contrast, SJPC–EC is relatively unchanged at 6.0 ± 3.4 μm (Fig. 4d) and now represents 75.4 ± 19.7% of SJTotal (Fig. 4e).
In stage 5, SJEC–EC disappears (Fig. 4e), and SJPC–EC comprises all of SJTotal. The stage 5 length of SJPC–EC, 6.6 ± 3.3 μm (Fig. 4d), is comparable to mature enterocyte–enterocyte SJs (Extended Data Fig. 5b), as expected for the final stage.
These stage-by-stage measurements reveal that, as PAC integration proceeds, SJPC–EC rapidly expands while SJEC–EC progressively shrinks (Fig. 4g). Initial, basally directed growth of the stage 2 SJPC–EC envelops the apex of the differentiating cell. Subsequent, apically directed growth of the stage 3 SJPC–EC occurs at the expense of SJEC–EC (Fig. 4e), which shrinks and ultimately disappears. The gradual replacement of SJEC–EC by SJPC–EC seamlessly integrates the new cell into the tissue’s pre-existing SJ network.
The crux of the remodelling process is the changeover point between apical SJEC–EC and basal SJPC–EC—that is, where a mature cell swaps its previous SJ-forming partner (another mature cell) for a new one (the differentiating cell). As the differentiating cell progresses from stage 1 to stage 5, the changeover point moves from the basal–lateral region of the epithelium to its lumenal–apical surface. This basal-to-apical movement enables a neighbour exchange that reorganizes the packing geometry of mature cells to incorporate the new cell. Because the changeover point is within the transitional SJ, we conjecture that its basal-to-apical movement preserves barrier integrity during new cell addition.
FIB-SEM reveals the 3D ultrastructure of transitional SJs
At the resolution of fluorescence light microscopy, stage 1 enteroblasts appear to contact the overlying SJEC–EC (Fig. 2b,c). To determine whether this contact represents formation of nascent SJPC–ECs or mere physical juxtaposition, we performed CLEM35,36 on Su(H)-GFP:nls-expressing midguts. We analysed selected tissue volumes by array tomography to examine the interfaces between GFP-labelled enteroblasts and neighbour enterocytes.
By EM, SJs characteristically appear as electron-dense structures that seal apposing plasma membranes. The SJs between mature enterocytes localize to the apical-most regions of the lateral membranes, adjacent to the lumenal brush border (Fig. 5a)61–63.
Fig. 5 |. FIB-SEM reveals the 3D ultrastructure of early-stage SJs.
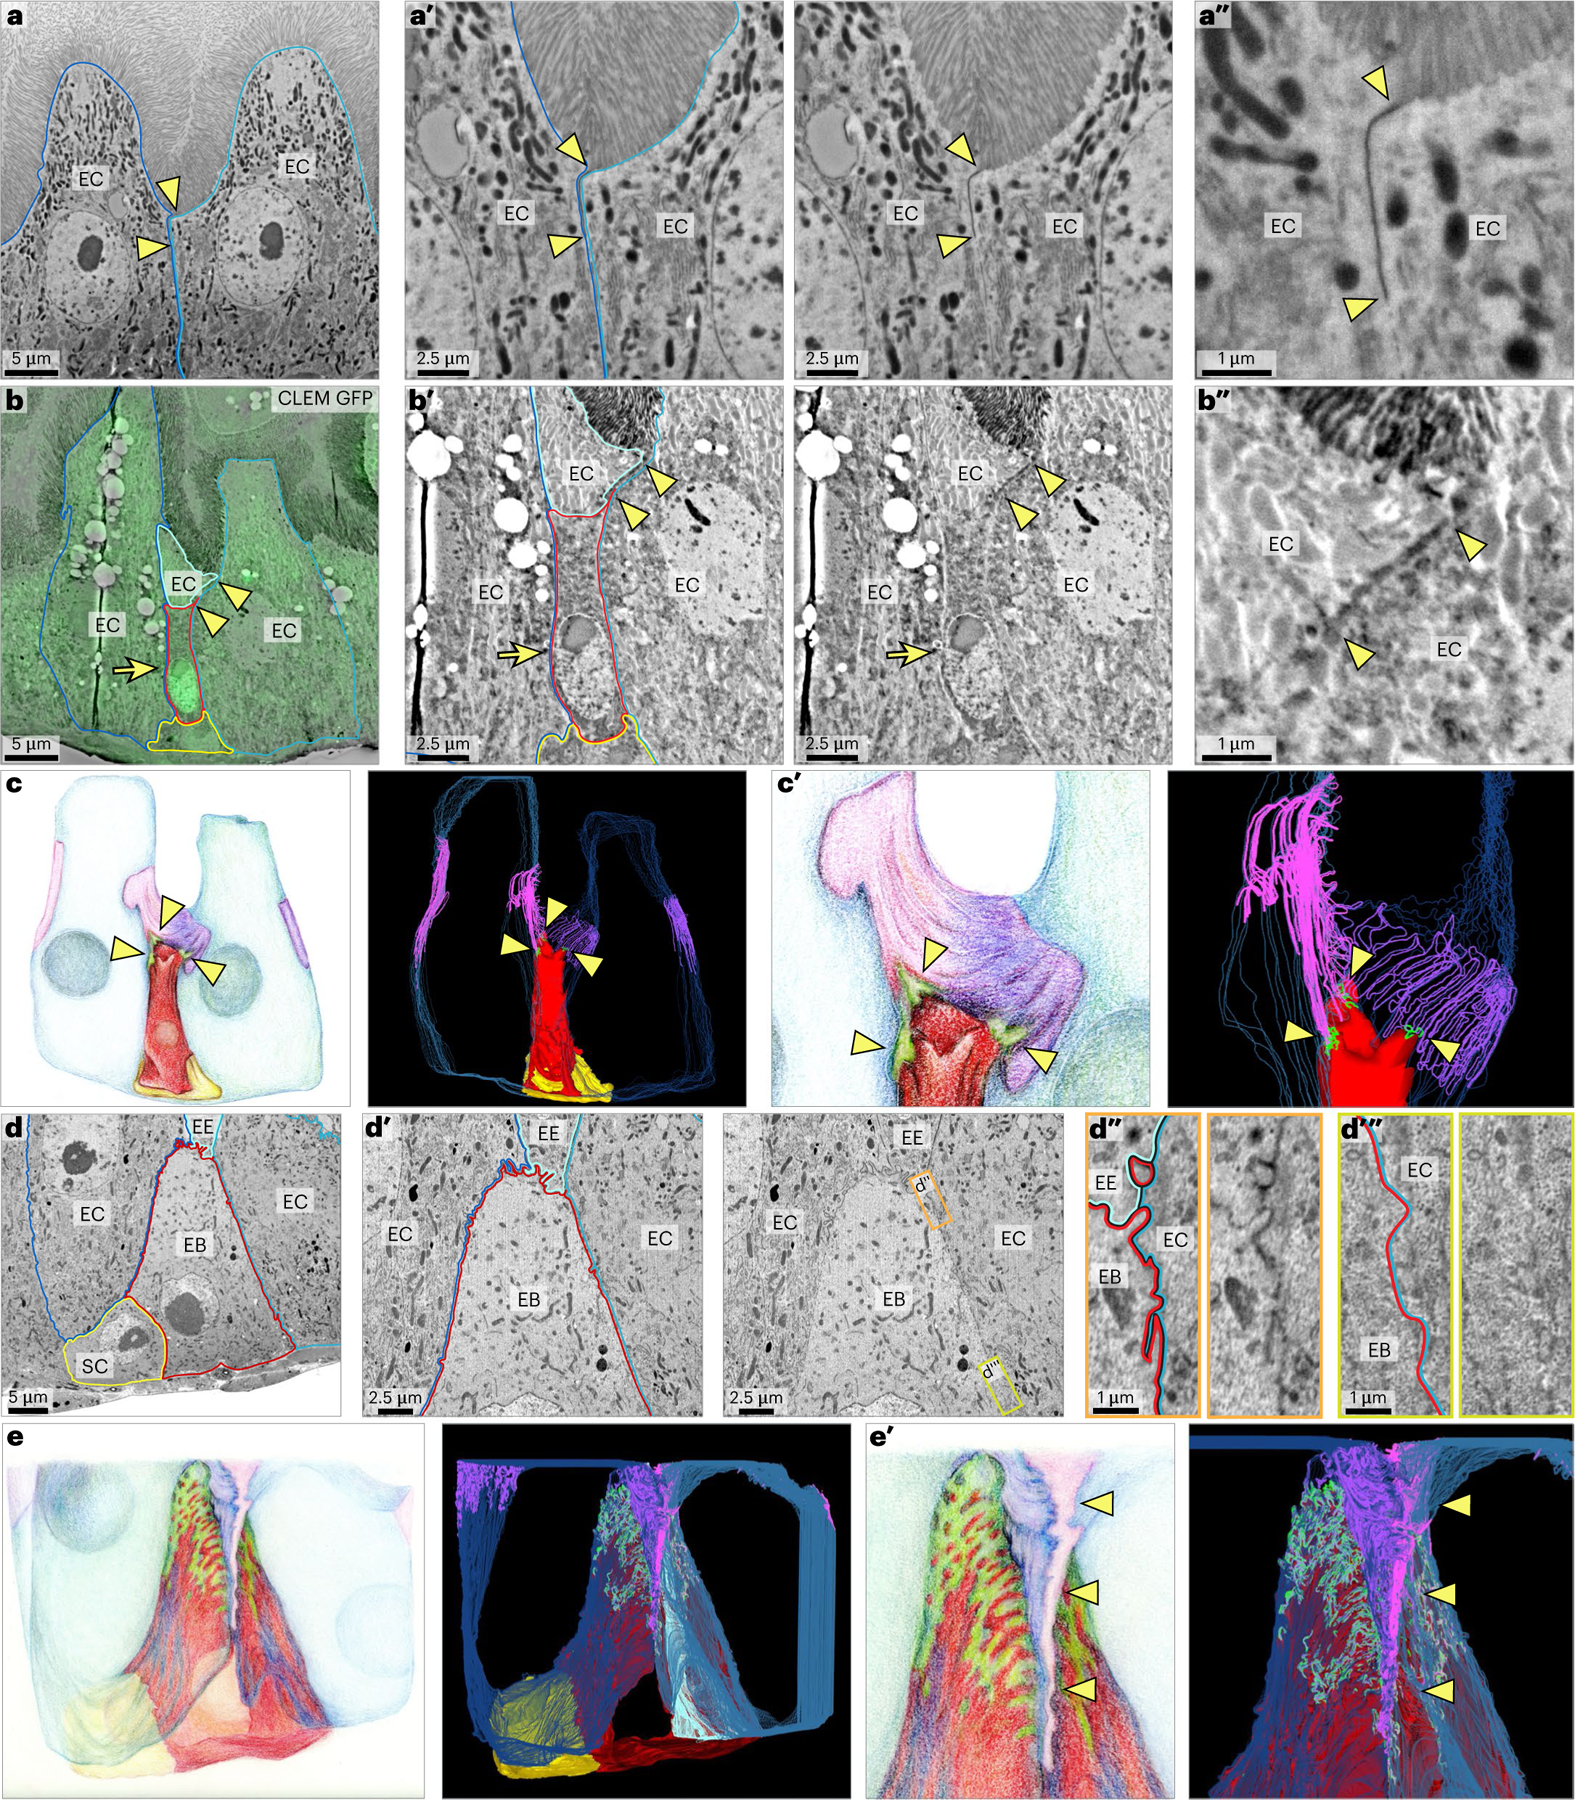
a, Enterocyte–enterocyte SJs localize at the boundary between the lumenal brush border and lateral plasma membranes. SEM shows two enterocytes (EC, outlined in blue and teal). Arrowheads indicate the apical and basal edges of the enterocyte–enterocyte SJ. a′,a″, Zoomed-in views of a with and without coloured outlines. Image is representative of 20 enterocyte–enterocyte SJs from three guts in a single experiment. b,b′,b′′,c,c′, A stage 1 enteroblast (EB) forms nascent SJPC–EC with enterocytes. CLEM overlay (b) identifies a Su(H)-GFP:nls+ enteroblast (arrow, GFP:nls; red outline, enteroblast) in an array tomography section. Morphology and position characterize the enteroblast as stage 1. Portions of three neighbour enterocytes (outlined in blue, teal and cyan) and a presumptive stem cell (SC, yellow outline) are visible. Arrowheads point to the apical and basal edges of an SJ with apical SJEC–EC between two ECs and basal SJPC–EC between the enteroblast and an EC. Zoomed-in views of b with and without coloured outlines (b′,b″). Illustration (c) and volumetric rendering (c′) of 30-slice FIB-SEM dataset spanning the enteroblast in b (red). Arrowheads point to three enteroblast SJPC–EC (green) that have formed with ECs (blue). SJPC–EC are continuous with SJEC–EC (EC SJ; pink, purple and lavender). A stem cell is also visible (yellow). Image is representative of two stage 1 enteroblasts from two guts in a singleexperiment. See Supplementary Video 2. d,d′,d″,d′′′,e, SJ basal zone of a stage 2 enteroblast. Single section (d) from 415-slice FIB-SEM dataset. Outlines show an enteroblast (red), two enterocytes (blue and teal), an enteroendocrine cell (EE, cyan) and a presumptive stem cell (yellow). The enteroblast’s slightly enlarged size is indicative of stage 2. Zoomed-in view (d′) of d with and without coloured outlines. Inset (orange) (d″) of d′ with and without coloured outlines. Inset shows EB–EC cell interface at the changeover point between SJEC–EC and SJPC–EC. EE is also in frame with SJPC-EE and SJEC-EE in view. Inset (yellow-green) (d′′′) of d′ with and without coloured outlines. Inset shows EB–EC cell interface along basolateral membrane in region devoid of SJs. Image is representative of one stage 2 enteroblast in a single experiment. See Extended Data Fig. 6. Illustration and volumetric rendering (e) of 415-slice FIB-SEM dataset, including the image in d. Enteroblast (red), enterocytes (blue and teal), enteroendocrine cell (cyan), stem cell (yellow), SJPC–EC (green) and EC SJ (purple and pink). Zoomed-in illustration and volumetric rendering of SJ basal zone from e (e′). Arrowheads point to basally extended SJEC–EC at the interface between ECs. See Supplementary Video 3. Full genotypes are in Supplementary Table 1. Scale bars, 5 μm (a, b and d), 2.5 μm (a′, b′ and d′) or 1 μm (a″, b″, d″ and d′′′).
Examining Su(H)-GFP:nls-labelled, stage 1 enteroblasts, we observed that the enteroblasts formed nascent SJPC–ECs that were continuous with their overlying SJEC–EC (Fig. 5b). To visualize a stage 1 SJTotal in 3D, we generated a volumetric rendering of the 30-slice array tomography series that encompassed the stage 1 enteroblast in Fig. 5b (Fig. 5c and Supplementary Video 2). The series also contained portions of three neighbour enterocytes and a stem cell. SJ densities and plasma membranes were manually traced in each slice, and the 30 slices were compiled to create a 3D volume (Methods). Hence, the rendered SJs do not represent individual SJ strands but rather show where these strands collectively localize.
3D rendering reveals that the stage 1 SJEC–EC wraps around the neighbour enterocytes’ apical–lateral boundaries, as expected (Fig. 5c and Supplementary Video 2). The basal edge of the SJEC–EC contacts the entire apex of the enteroblast (red). Within this contact zone, the enteroblast has established three, point-like SJPC-EC (green) with each of its three neighbour enterocytes. Thus, SJPC–EC originate in stage 1. Notably, these miniscule stage 1 SJPC–ECs are visible in only a few sections throughout the electron microscopy (EM) series, highlighting array tomography’s ability to reveal key details that cannot easily be discerned by light or standard EM.
We next considered the 3D ultrastructure of an enteroblast whose slightly larger size is indicative of stage 2. We generated an ultrathin, 415-slice FIB-SEM tomographic volume that includes a substantial portion of the enteroblast and four neighbour cells: two enterocytes, an enteroendocrine cell and a stem cell. An illustrative section (Fig. 5d and Extended Data Fig. 6) and a volumetric rendering of the entire series (Fig. 5e and Supplementary Video 3) are shown.
In this 3D rendering (Fig. 5e and Supplementary Video 3), the stage 2 SJPC–EC (green) extends basally along the lateral membranes of the enteroblast (red) and its neighbour enterocytes (blue), consistent with our light-based measurements (Fig. 4d,e). The 3D rendering reveals an additional feature that would not be detectable by light microscopy: the lateral interface between two neighbour enterocytes contains a basally extended SJ (pink/purple structure indicated by arrowheads in Fig. 5e′; see also Supplementary Video 3, t = 1:00–1:25). Basal expansion of SJs that are adjacent to, yet not formed by, the enteroblast raises the possibility that PAC integration involves remodelling of the regional SJ network surrounding the integrating cell.
PAC formation requires de novo SJs and Tor-driven cell growth
What happens to PAC integration when SJ formation is perturbed? We investigated this question using Su(H)-GAL4, which turns on in stage 0 enteroblasts, to deplete SJ components Ssk (UAS-sskRNAi) or Tsp2a (UAS-Tsp2aRNAi) under GAL80ts control59 (genotypes henceforth referred to as Su(H)ts > sskRNAi or Su(H)ts > Tsp2aRNAi, respectively). We also included a UAS-GFP transgene to identify the RNAi-expressing cells. The RNAi hairpins were expressed from adult days 0 to 4, and GFP+ cells were classified as stages 0–5 based on the apical marker phospho-Moesin (pMoe) and the SJ marker Coracle (Extended Data Fig. 3).
We found that RNAi-expressing cells were severely inhibited in their progression from early to late PAC integration (Fig. 6a–c). The proportion of cells in stages 3–5 decreased by ~68% and ~78% following depletion of Ssk and Tsp2a, respectively (Fig. 6a″). In particular, stage 3 comprised 9.5 ± 3.8% of control Su(H)ts cells but only 2.3 ± 2.2% of Su(H)ts > sskRNAi cells and 1.9 ± 1.9% of Su(H)ts > Tsp2aRNAi cells (Fig. 6a,a′). Stages 4 and 5 exhibited similar, though smaller, reductions (Fig. 6a,a′). The existence of rare, late-stage SJ RNAi cells may reflect residual expression of the RNAi-targeted SJ component, or it may indicate that new cell addition, while severely reduced, does not absolutely require intact SJs. We did not observe atypical localization or accumulation of the apical marker pMoe in SJ RNAi cells at any stage. Tissue-scale enterocyte density was unaffected (Extended Data Fig. 7a–d), probably due to compensatory lengthening of enterocyte lifespan64. Overall, these results imply that disrupting SJ synthesis disrupts PAC formation and terminal differentiation.
Fig. 6 |. Cells must form SJs and grow to integrate.
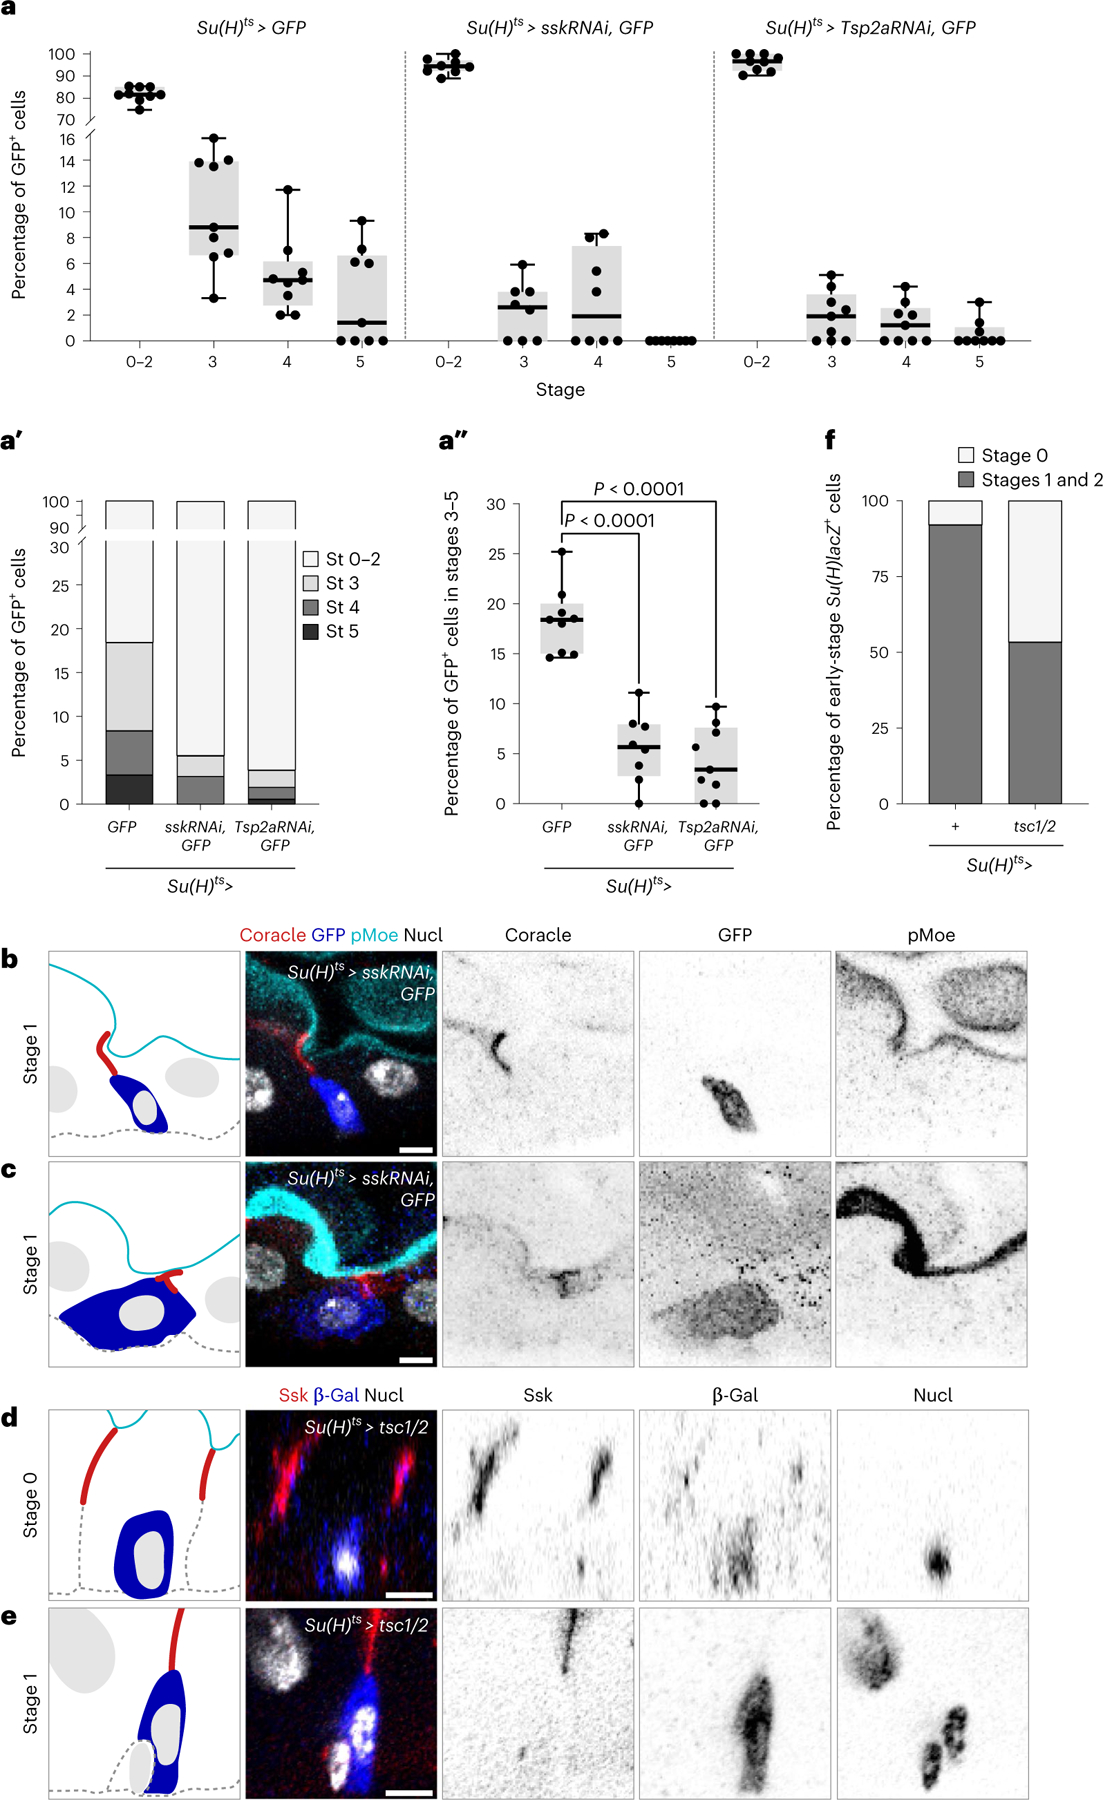
a–c, Knockdown of SJ components inhibits progression to late stages (St). a–a″, Percentage of Su(H)ts > GFP+ cells in each integration stage in midguts of the indicated genotypes. Su(H)ts > GFP (N = 9 guts; n = 1095 total cells), Su(H)ts > sskRNAi, GFP (N = 8 guts; n = 336 total cells), and Su(H)ts > Tsp2aRNAi, GFP (N = 9 guts; n = 801 total cells). Box plot displays median as centre line, the bounds of the box represent the first and third quartiles, minimum and maximum values are shown by whiskers. Each data point represents one midgut. Su(H)ts > GFP versus Su(H)ts > sskRNAi (two-tailed Student’s t-test, P = 3.5 × 10⁻⁶), Su(H)ts > GFP versus Su(H)ts > Tsp2aRNAi (two-tailed Student’s t-test, P = 4 × 10⁻⁷) (a″). b,c, Immunofluorescent images of Su(H)ts > sskRNAi, GFP cells in stage 1. Representative images collected from eight guts in three independent experiments. Apical marker (pMoe; cyan), SJs (Coracle; red), Su(H)ts > GFP (blue), and nuclei (DAPI; greyscale). d–f, Growth inhibition blocks progression to late stages. Representative immunofluorescent images of Su(H)ts > tsc1/2; Su(H)-lacZ cells in stage 0 (d) and stage 1 (e) from a single experiment. SJs (Ssk, red), Su(H)-lacZ, (β-gal, blue) and nuclei (DAPI, greyscale). Percentage of early-stage (stages 0–2) Su(H)-lacZ+ cells in either stage 0 (no SJ contact) or stages 1–2 (SJ contact) (f). Su(H)ts/+ (N = 3, n = 214 stage 0–2 cells; stage 3–5 cells were observed but not included in analysis) and Su(H)ts > tsc1/2 (N = 3, n = 146 stage 0–2 cells; no stage 3–5 cells were observed). Scale bars, 5 μm. Full genotypes are in Supplementary Table 1.
Most SJ RNAi cells had a size and shape typical for their stage. However, ~1–5% of stage 0–2 RNAi cells had a size and shape typical of stage 3 pre-enterocytes, despite lacking stage-3-defining PACs and enveloping SJs (Fig. 6b,c). These abnormally large, stage 0–2 RNAi cells also appeared polyploid, in contrast to typical, diploid stage 0–2 enteroblasts and akin to stage 3 pre-enterocytes (Fig. 6b, c). The finding that SJ RNAi can decouple cell size from integration stage prompted us to examine the role of cell size control in PAC integration.
Cell growth during the enteroblast–enterocyte transition is regulated by Tor pathway activation47,65–68. We inhibited Tor-controlled cell growth by overexpressing Tsc1/2 using Su(H)ts. Consistent with prior studies47,66,67, Su(H)ts > tsc1/2 guts exhibited increased enterocyte density (Extended Data Fig. 7e–g), probably due to reduced enterocyte growth following Tor inhibition. Assessing the effect on PAC integration, we found that 100% of Su(H)ts > tsc1/2 cells were in stages 0–2, as defined by apical marker localization and SJ morphology (Fig. 6d,e and Extended Data Fig. 3). Moreover, stage 0 cells accounted for 46.6% of Su(H)ts > tsc1/2 cells, a 5.9-fold increase compared with early-stage controls (7.9% Su(H)ts > tsc1/2 stage 0 cells; Fig. 6f). Thus, cell growth is essential for late-stage PAC formation and SJPC-EC expansion; growth may also facilitate early-stage progression.
PACs are intercellular and sealed off from the gut lumen
Our confocal imaging indicated that PACs are physically separate from the gut’s lumenal–apical surface, but their basic identity remained mysterious: Are PACs intracellular endosomes or intercellular lumens? Do they form a sublumenal brush border? Does their close proximity to SJs reflect a structural connection? Light microscopy lacks the resolution to answer these questions, so we investigated the PACs’ ultrastructure using FIB-SEM.
Examining FIB-SEM series, we observed microvilli-lined structures whose bowl-like shapes and apical cellular positions resemble PACs (Fig. 7a cyan box, Fig. 7b). These structures were associated with larger, polyploid cells that lacked a detectable lumenal-apical surface, suggestive of stage 3 pre-enterocytes (Fig. 7a). The microvilli that line these structures were densely arrayed, like brush border microvilli, but shorter, which suggested they were immature. We also found sausage-shaped structures lined with similarly dense, short microvilli (Fig. 7a magenta box, Fig. 7c); their extremely slender lumens suggest that these structures may be newly formed. Thus, we posit the bowl-like structures are PACs and the sausage-like structures are their precursors (pre-PACs).
Fig. 7 |. PACs are intercellular, split-polarity lumens that are sealed off from the gut lumen.
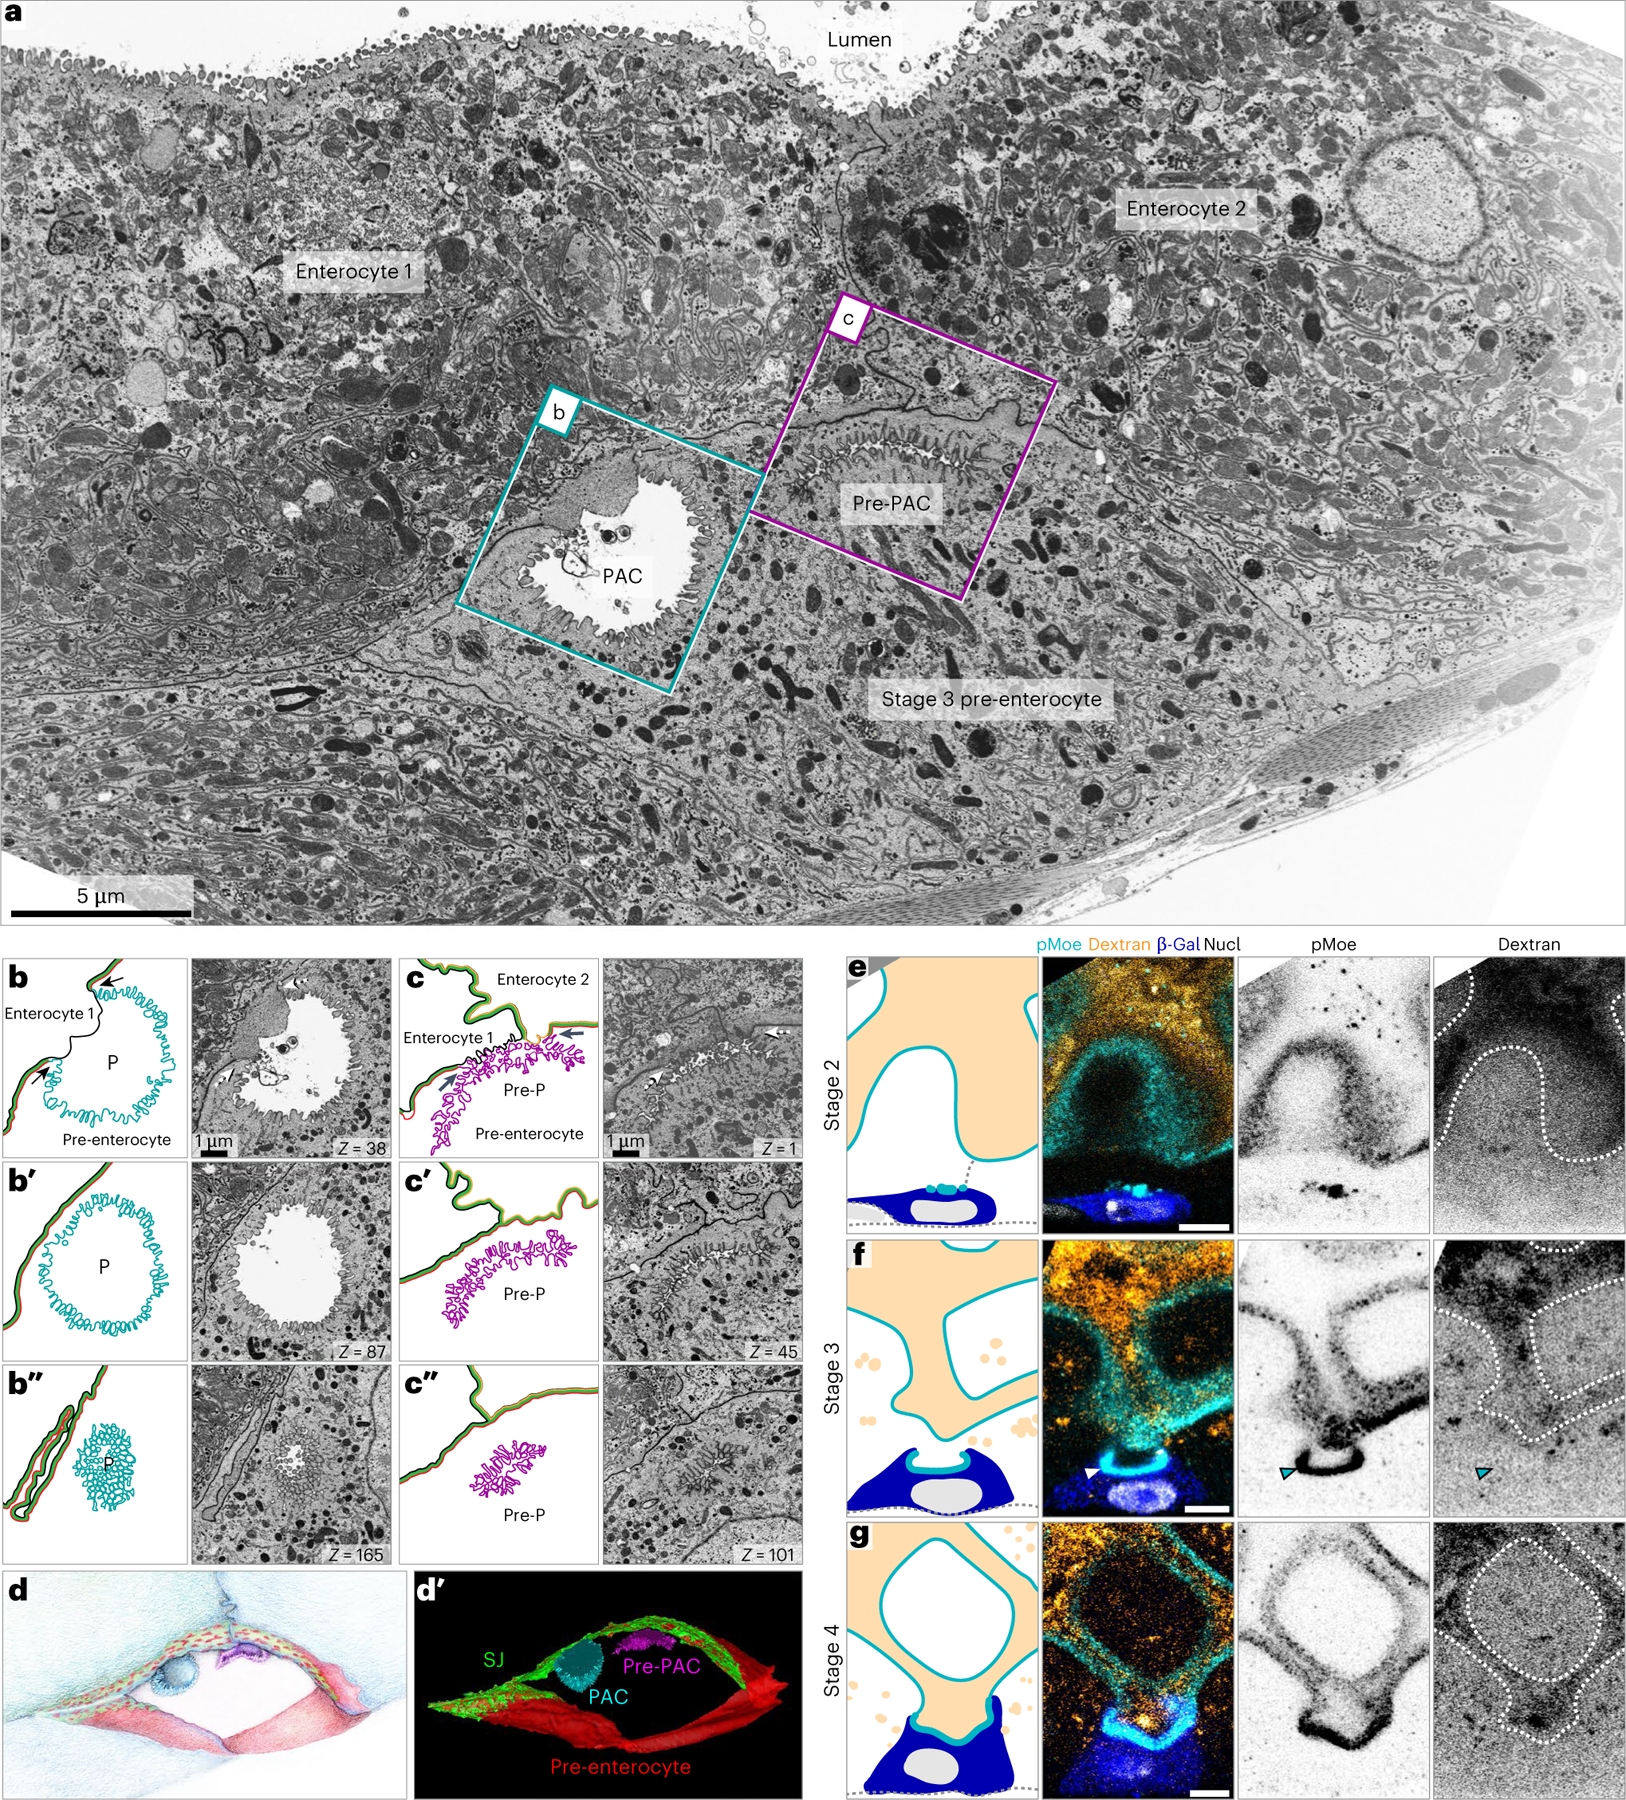
a, One slice from a representative, 200-slice FIB-SEM tomographic series (40.2 μm × 23.9 μm × 8 μm). Series captures two mature enterocytes and a pre-enterocyte. A PAC and a PAC precursor (Pre-PAC) appear at the apex of the pre-enterocyte. b–b″, Inset of the PAC (P) in cyan box in a. Three FIB-SEM sections are shown next to cartoon representations. Pre-enterocyte’s apical membrane (cyan), pre-enterocyte’s basolateral membrane (red), Enterocyte 1’s basolateral membrane (black) and SJ (green). Arrows in b point to the three-way boundary between the pre-enterocyte apical membrane, Enterocyte 1’s basolateral membrane and the pre-enterocyte basolateral membrane. c–c″, Inset of the PAC precursor (pre-P) in magenta box in a. Pre-enterocyte’s apical membrane (magenta), pre-enterocyte’s basolateral membrane (red), Enterocyte 1’s basolateral membrane (black), Enterocyte 2’s basolateral membrane (orange) and SJ (green). Arrows in c point to two three-way boundaries between the pre-enterocyte apical membrane, the basolateral membrane of either Enterocyte 1 or Enterocyte 2, and the pre-enterocyte basolateral membrane. In a–c, Z values in lower right of panels are slice numbers. Images are representative of four PACs/pre-PACs from two guts from a single experiment. d,d′, Illustration (d) and volumetric rendering (d′) of 200 FIB-SEM sections, including the section in a. PAC (cyan), PAC precursor (magenta; Pre-PAC), pre-enterocyte’s basolateral membrane (red) and SJ (green). Enterocyte membranes not shown. See Supplementary Video 4. e–g, Immunofluorescent images of Su(H)-lacZ+ cells in guts of flies fed Alexa Fluor 647-conjugated 10 kDa dextran dye for 48 h. e–g are representative images of 1,000 cells examined from four guts from a single experiment: stage 2 (e), stage 3 (f) and stage 4 (g). Apical membrane (pMoe; cyan), dextran dye (orange), Su(H)-lacZ+ cells (β-gal; blue), and nuclei (DAPI, greyscale). Full genotypes are in Supplementary Table 1. Scale bars, 5 μm (a and e–g) or 1 μm (b and c).
Prior studies of cultured epithelial cells reported that the apical plasma membrane can form through exocytosis of large, microvilli-lined, apical endosomes69–71. We thus wondered whether PACs were apical endosomes. To evaluate this possibility, we selected series that captured the complete or near-complete volume of four individual PACs, and we analysed their membrane topologies slice by slice (Fig. 7b,c). Although PACs resembled endosomes in many individual slices (for example, Fig. 7b′,b″), we consistently found a small region in which a PAC’s microvillar membrane was continuous with the pre-enterocyte plasma membrane (arrows in Fig. 7b,c; 4/4 PACs). Thus, PACs are not endosomes. Instead, they are pit-like invaginations whose narrow openings are covered by overlying mature enterocytes (Fig. 7b; 4/4 PACs).
The invagination of the pre-enterocyte and the overlying membranes of the mature enterocytes together form an intercellular lumen. Yet while the pre-enterocyte membrane is apical, the mature enterocyte membranes are basolateral—they lack microvilli (Fig. 7b) and apical markers (Supplementary Video 1). This split apical/basal character makes PACs a singular exception to the rule that intercellular lumens are uniformly apical72–74 (or, in rare instances, uniformly basolateral75,76). Interestingly, nearly all of the PAC’s lumenal volume is formed by the deep apical membrane invagination.
To understand the spatial relationship between the PAC and the transitional SJ, we generated a volumetric rendering of 200 ultrathin FIB-SEM slices taken through the pre-enterocyte in Fig. 7a (Fig. 7d,d′ and Supplementary Video 4). Consistent with our stage 3 measurements (Fig. 4), 3D rendering reveals a broad, transitional SJ (green) that encompasses much of the pre-enterocyte surface (red). The SJ surrounds the rims of the PAC and pre-PAC invaginations (cyan and magenta, respectively; Supplementary Video 4, t = 0:18–1:00), suggesting that the SJ may seal these structures from the gut lumen.
To functionally test whether PACs are sealed, we fed flies an Alexa Fluor 647-conjugated 10 kDa dextran dye, which is too large to penetrate the SJ network, and asked whether the dye accumulated in PACs. After 2 days of feeding, bright dextran signal filled the gut lumen (Fig. 7e–g). Dextran was, as expected, absent from Su(H)-lacZ+ stage 2 cells (Fig. 7e) and present in the open apical cavity of stage 4 cells (Fig. 7g). Crucially, dextran was excluded from the PACs of stage 3 cells (Fig. 7f). Thus, SJ-rimmed PACs are shielded from the gut’s lumenal contents.
Discussion
Here we present a mechanism whereby basal stem cell progeny integrate into a physiologically active barrier epithelium. Seamless cell addition is achieved through de novo formation of a basally extended, transitional SJ between the new cell and its overlying, mature neighbours. The PAC integration stages we report here are corroborated by a recent study from Chen and St. Johnston, published while our manuscript was under review77.
The transitional SJ serves two vital functions: First, it creates a protected niche that enables the new cell to form a nascent apical surface. Second, its basal-to-apical remodelling assimilates the new cell into the gut’s barrier-forming SJ network (Extended Data Fig. 8c). Unlike radial intercalation (Extended Data Fig. 8b), PAC integration enables stem cell daughters to develop barrier structures in the shelter of a transient niche, protected from lumenal insults until they are prepared to withstand them.
The salient hallmark of PAC integration is the gestation of a PAC under the aegis of the transitional SJ (Extended Data Fig. 8d). PACs are created by the new cell’s apical membrane, which forms a pit-like invagination, and the mature neighbours’ basolateral membranes, which cover the opening of the pit. This combination produces an asymmetrically shaped lumen with split apical/basolateral character.
In both PAC integration and radial intercalation, cells assimilate into an epithelium through basal-to-apical movement. We speculate that, in general, basal-to-apical cell addition requires a trade-off between integration speed and barrier integrity. A particular biological context may favour one of these qualities at the expense of the other.
For example, radial intercalation is rapid and parsimonious, occurring over timescales of minutes or a few hours24–29,32. New junctions initiate within the pre-existing junctional network and expand directly into their final morphology24–29,32. Intriguingly, all published descriptions of radial intercalation occur in developing epithelia. Because embryos develop in a protective environment (such as an egg or a womb), cells in embryonic tissues can form immature junctions and primitive microvilli at the organ’s apical surface without risking exposure to the external environment.
In contrast, PAC integration is slower. We estimate, based on Sox21a-synchronized differentiation (Fig. 3), that stages 2–5 of PAC integration take place over ~24–36 h, and physiological differentiation may occur at even slower rates. The longer timescale may be needed to construct the broad transitional SJ and the deep, microvilli-lined PAC—large structures that remodel extensively as a cell integrates. PAC integration also requires cell growth (Fig. 6d–f), which is controlled by Tor47,65–68 and probably other factors such as epidermal growth factor receptor (EGFR) and Zfh2 (refs. 47,53,78). This more complex process may provide an additional layer of protection for differentiating cells—a potentially worthwhile trade-off for a functionally active organ in continuous contact with the external environment.
Fascinatingly, prior ultrastructural studies have reported structures akin to PACs in the midgut epithelia of numerous arthropod species, including the cockroach Periplaneta americana79, western corn rootworm Diabrotica virgifera virgifera80 and millipede Telodeinopus aoutii81. The guts of these arthropods contain proliferative, basal stem cells and immature, enteroblast-like cells, suggesting that they undergo continuous renewal81,82. Like PACs in the fly gut, PAC-like structures in these other arthropods are intercellular and microvilli-lined. Their prevalence suggests that PAC integration, or a similar mechanism, may be used widely in the arthropod phylum.
In mammals, numerous barrier epithelia are renewed by basally localized stem cells that lack occluding junctions and lumenal–apical surfaces10–18. Histological evidence hints that PAC-like structures may contribute to renewal of some of these tissues; for instance, intercellular, microvilli-lined lumens are observed in the adult human oviduct83 and nasal mucosa84. PAC-like mechanisms also may occur in mammalian development; in foetal rat intestine, for example, the transition from stratified to simple columnar epithelia involves microvilli-lined lumens that appear between cells and ultimately merge with the gut lumen85,86. These intriguing reports raise the possibility that PAC integration is used by differentiating cells in vertebrate epithelial renewal and development.
In considering how epithelial structure guides new cell addition, we note that two of the best-understood barrier epithelia, mammalian intestine and lung alveoli, sidestep the challenge of barrier integration entirely. Intestinal and alveolar stem cells possess both occluding junctions and lumenal-apical surfaces, and daughter cells symmetrically inherit these barrier structures (Extended Data Fig. 8a)22,87–89. Although symmetric inheritance appears morphogenetically straightforward, it requires breaking and creating tight junctions at the new mother–daughter cell interface. Since this interface contacts the organ lumen, symmetric inheritance seems to contradict the notion that physiologically active epithelia need safeguards to protect barrier integrity during new cell addition.
We speculate, however, that the architecture of these organs’ stem cell niches—deep intestinal crypts and terminal alveolar end-buds—mitigates the potential risk. These recessed niches are secluded from bulk lumenal flow, providing their stem cells with protection that other epithelia lack. In this light, PACs can be viewed as a cellular-scale solution for epithelia without the tissue-scale protection of a recessed stem cell niche. As such, our findings spotlight the intimate relationship between physiological function, organ form, and cellular differentiation and morphogenesis.
Methods
Drosophila husbandry
A complete list of the fly stocks and full genotypes used in this study can be found in Supplementary Tables 1 and 2. Mated adult 2–4-day-old female Drosophila melanogaster were used for all experiments, unless otherwise indicated. For the esgts > sox21a experiment, 0-day-old (newly emerged), 1-day-old and 2-day-old adult female flies were used as indicated. Flies were raised on standard molasses medium in all experiments. Crosses utilizing the TARGET system (GAL4/GAL80ts) were performed at 18 °C (ref. 59), or 21 °C for crosses with UAS-Sox21a. Upon eclosion, or during pharate stage for crosses used in Fig. 6, animals were temperature shifted to 29 °C to inactivate GAL80ts and induce GAL4-mediated expression. Midguts were collected for immunostaining at 4 days after induction, unless otherwise specified.
Immunohistochemistry and sample preparation for confocal microscopy
Dissected guts were fixed in 4% formaldehyde in phosphate-buffered saline (PBS; pH 7.4) at room temperature for 1 h, immunostained, and mounted as previously described90. Briefly, samples were blocked overnight at 4 °C in PBT (PBS with 0.3% Triton X-100 (Sigma-Aldrich X100)) with 5% normal goat serum (NGS; Capralogics GS0250), incubated with primary antibody in PBT + 5% NGS overnight at 4 °C, washed five times in PBT, incubated with secondary antibody in PBT + 5% NGS for 4 h at room temperature, and washed five times in PBT and two times in PBS before mounting. Samples were mounted in ProLong Gold Antifade (LifeTechnologies P10144) and stored at −20 °C until imaging. Primary antibodies: chicken anti-β-gal (1:1,000, abcam 9361), chicken anti-GFP (1:400, Thermo Fisher A10262), mouse anti-Armadillo (1:100, DSHB N2 7A1), mouse anti-β-gal (1:400, Promega Z3781), mouse anti-Coracle (1:50, DSHB C615.16), rabbit anti-pMoesin (pEzrin; 1:200, Cell Signaling 3726), rabbit anti-Snakeskin (1:1,000, gift from Furuse lab), rabbit anti-Tetraspanin2A (1:200, gift from Furuse lab). Information on antibody validation provided in Supplementary Table 3. Secondary antibodies: donkey anti-mouse Alexa Fluor 647 (1:400, Invitrogen A-31571), donkey anti-rabbit Alexa Fluor 555 (1:400, Invitrogen, A-31572), goat anti-chicken Alexa Fluor 488 (1:400, Invitrogen A-11039), goat anti-chicken Alexa Fluor 647 (1:400, Thermo Fisher A-21449), goat anti-mouse Alexa Fluor 405 (1:400, Thermo Fisher, A-31553), goat anti-mouse Alexa Fluor 555 (1:400, Thermo Fisher A-21137), goat anti-mouse Alexa Fluor 647 (1:400, Thermo Fisher, A-21240), goat anti-rabbit Alexa Fluor 405 (1:400, Thermo Fisher A-31556), goat anti-rabbit Alexa Fluor 647 (1:400, Thermo Fisher A-21244). Nuclei were stained with 4′,6-diamidino-2-phenylindole (DAPI; LifeTechnologies D1306). Further details on antibodies and reagents used are provided in Supplementary Table 2.
Confocal microscopy
Fixed samples were imaged on a Leica SP8 WLL confocal microscope with a 63× HC PL APO CS2 oil objective. Serial optical sections were taken at 0.5 μm intervals through the entirety of whole-mounted, immunostained midguts. Confocal microscopy images were collected using Leica Application Suite X (LAS X) (Version 3.5.7.23225). Fiji (Version 2.9.0) and Bitplane Imaris x64 (Version 9.7.2) were used for image analysis.
Ovary dissection and staining
Egg chambers were dissected in PBS (pH 7.4) + 0.1% Triton X-100 and incubated for 2 h in 1 mM latrunculin B (LatB; Sigma). They were then fixed 20 min in 4% paraformaldehyde (in PBS pH 7.4), incubated 2 h in a 1:250 dilution of TRITC-conjugated phalloidin (Molecular Probes), and subsequently imaged on a Zeiss LSM 700 confocal microscope.
Staging of Su(H)-lacZ+ enteroblasts/pre-enterocytes
To perform staging of Su(H)-lacZ+ cells in the R4 region of the midgut, 63× confocal image stacks were used to generate three-dimensional organ reconstructions in Bitplane Imaris. Individual Su(H)-lacZ+ cells were identified and marked with the Spots feature. Staging was performed on the basis of expression of a GFP-tagged (sqh-moeABD::GFP or mdu::GFP) or immunostained (pMoe) apical membrane marker and an immunostained SJ marker (Ssk, Tsp2a, or Coracle) (Fig. 2 and Extended Data Fig. 3).
Stage 0: no apical membrane marker and no contact with SJ
Stage 1: Su(H)-lacZ+ cell contacting SJ, but no apical membrane marker
Stage 2: apical membrane marker at apex of Su(H)-lacZ+ cell, and contact with broad SJ
Stage 3: apical membrane marker in concave PAC, and contact with broad SJ
Stage 4: apical membrane is concave but open to lumen, and SJ circumscribes the cell
Stage 5: apical membrane is convex and lumen-contacting, and SJ circumscribes the cell
SJ quantitation
To quantitate the SJs associated with Su(H)-lacZ+ cells, we generated three-dimensional organ reconstructions from 63× confocal image stacks in Bitplane Imaris. Individual Su(H)-lacZ+ cells were identified and marked with the Spots feature. For each Su(H)-lacZ+ cell, four metrics of their associated SJ were measured (Fig. 4a): (1) lateral length of the SJ from its apical-most to basal-most point (lambda (λ)), (2) lateral length of the SJ in contact with the Su(H)-lacZ+ cell (psi (ψ)), (3) lateral height of the Su(H)-lacZ+ cell (nu (η)) and (4) distance between the basal-most point of the SJ and the basal surface of the epithelium (delta (δ)). For each Su(H)-lacZ+ cell, we also measured these four metrics for two nearby SJs associated with neighbouring enterocytes. Cells were identified from N = 7 guts. n = 30 Su(H)-lacZ+ cells per stage (150 cells total) and n = 60 neighbour cells per stage (300 cells total). Raincloud plots were generated in Python 3.9.
Enterocyte density analysis
To measure the density of enterocytes, we used immunofluorescent images of the R4 region of midguts. A rectangular section of a representative flat area (~30,000 μm2) was isolated from the centre of each gut image. We then used Imaris to count the number of polyploid nuclei in each section, representing the number of enterocytes. The number of enterocytes was divided by the known area of each section to calculate the enterocyte density.
Dextran dye feeding
To determine if PACs are continuous with the intestinal lumen, flies were fed Alexa Fluor 647-conjugated 10,000 MW (10 kDa) dextran dye (Thermofisher D22914), which is too large to breach the intestinal barrier. For the feeding assay, 1% dextran dye in water was mixed with yeast to create a paste that was provided to flies in vials atop flugs wetted with water. Adult flies were fed this yeast–dextran mixture for 2 days at 29 °C. Midguts were collected for immunostaining. esgts > Sox21a flies were used to ensure the presence of numerous later stage Su(H)-lacZ+ cells.
Cloning of A142/Meduse, the Drosophila homologue of human MISP
The splice-trap transposon line A142 was originally identified as a luminally polarized marker91,92, which expresses a GFP fusion protein that localizes at or near enterocyte microvilli. We found that this transposon is inserted into CG2556 (Extended Data Fig. 4a), which was previously identified as a homologue of the mammalian Mitotic Interactor and Substrate of PLK1 (also known as Mitotic Spindle Positioning, MISP93). MISP is an actin bundling protein that localizes to the rootlets of mouse and human intestinal microvilli94. We mapped the site of the A142 insertion through PCR (details on primers used listed in Supplementary Table 2).
Since the filamentous appearance of the A142 fusion protein in egg chambers is reminiscent of sea jelly tentacles (Extended Data Fig. 4b), we named this gene meduse (mdu). Mdu is predicted to be a 470 amino-acid, 51 kDa protein whose sole identifiable motif is an actin binding domain. This putative actin-binding function is consistent with localization of the A142 splice trap to the apical brush border of enterocytes and with actin filaments in stage 10 egg chambers, the latter of which is latrunculin-sensitive (Extended Data Fig. 4b,c).
Sample preparation for CLEM
To preserve native fluorescence for CLEM, samples were subjected to high-pressure freezing followed by rapid freeze substitution, as previously described36,95. Dissected guts were immediately transferred to large high pressure freezing carriers filled with 20% bovine serum albumin for cryo-protection and frozen using the standard procedure according to the manufacturer’s instructions (High Pressure Freezing Machine HPF Compact 02, Engineering Office M. Wohlwend GmbH, Sennwald, Switzerland). Samples were substituted in an AFS2 machine (Leica) with 0.1% uranyl acetate diluted in anhydrous acetone and embedded in HM20 acrylic resin mix (Electron Microscopy Sciences). To assure precise orientation of the samples, the flat embedding procedure was used36.
Sample preparation for FIB-SEM
Fly guts were dissected in PBS and immediately processed as previously described36,96. Briefly, the samples were fixed in 1% formaldehyde, 2.5% glutaraldehyde in 0.1 M phosphate buffer (PB) for 2 h at room temperature, then incubated for 1 h in 2% (wt/vol) osmium tetroxide and 1.5% (wt/vol) K4[Fe(CN)6] in PB followed by 1 h in 1% (wt/vol) tannic acid in 100 mM cacodylate buffer, then 30 min in 2% (wt/vol) osmium tetroxide in water followed by 1% (wt/vol) uranyl acetate for 2 h at room temperature. After the dehydration cycles, samples were embedded in Epon-Araldite mix. Samples were flat embedded to assure the targeting of the region of interest during the sectioning step.
EM image acquisition and analysis
Polymerized flat blocks were trimmed using a 90° diamond trim tool (Diatome) mounted on a Leica UC6 microtome. Transmission EM samples were analysed with an FEI CM100 electron microscope operated at 80 kV, equipped with a TVIPS camera piloted by the EMTVIPS program.
Samples for CLEM were sectioned at 100–150 nm thickness and transferred to wafers using an array tomography protocol35,97. CLEM wafers were first imaged for fluorescence signal using a Zeiss fluorescent microscope equipped with DAPI and GFP filters using 20× and 60× objectives. To analyse the ultrastructure, sections on wafer were contrasted with uranyl acetate and lead citrate and observed using an FEI Quanta 250 FEG scanning electron microscope (FEI). The imaging settings were as follows: accelerating voltage, 10 kV; spot size, 5; image dimensions, 4,096 × 4,096; pixel dwell time, 10 μs.
FIB-SEM tomography was done with a Helios 650 (FEI). Fibbing conditions were 30 keV, 770 pA, 30–40 nm slice thickness (specified in text for each experiment) at a tilt angle of 52° and a working distance of 13 mm. For imaging, the block face was tilted normal towards the electron beam98. The imaging conditions were: 2 keV, 800 pA, 20 μs dwell time, with a frame size of 6,144 × 4,096 and a pixel size of 9.7 mm. For publication, the image contrast was inverted.
IMOD99 was used to convert raw data from sequential sections to an MRC file stack and also used for alignment of serial sections and volumetric rendering. Adobe Photoshop (Version 24.1.0) was used for image adjustment, layers superposition, annotations, pseudo-colouring of image zones, and volume reconstructions.
Volumetric rendering of FIB-SEM images
Serial sections were stacked and aligned using the cross-correlation function of IMOD, which was also used to trace and reconstruct specific regions. Drawing tools were used for outlining subcellular features (for example, SJs, plasma membrane, nuclei and PAC) on the EM layers. The 3D reconstruction surfaces were Meshed in Model View/ Objects tool. Images were captured using the Model View/Movie Montage tool and reformatted into .avi format using Fiji.
Statistics and reproducibility
Data are represented in the main text as mean ± standard deviation; and in figures as box plots that display median as centre line, the bounds of the box represent the first and third quartiles, minimum and maximum values are shown by whiskers, and diamonds indicate outliers. The number of experimental replicates for each assay is indicated in the figure legends. Statistical tests used are indicated in the figure legends. No statistical methods were used to pre-determine sample sizes, but our sample sizes are similar to those reported in previous publications21,47,51. Data distribution was assumed to be normal, but this was not formally tested. In the esgts > Sox21a experiments, some Su(H)-lacZ+ cells (11.5% of 6,596 cells total) exhibited poor immunostaining and were excluded from further analysis. No other data were excluded from the analyses. For all experiments, randomization was not relevant/not performed. Data collection and analysis were not performed blind to the conditions of the experiments. A majority of the experiments in this manuscript are not a comparison between different treatments, so blinding was not relevant/not performed. All data were acquired and processed identically and in parallel. Graphpad Prism 9 (Version 9.3.1 (350)), Microsoft Excel 365 (Version 16.69) and Python (Version 3.9) were used for statistics and graph generation. Adobe Illustrator (Version 27.2) was used for figure assembly.
Extended Data
Extended Data Fig. 1 |. Same images as Fig. 1b–g, without drawn cell outlines.
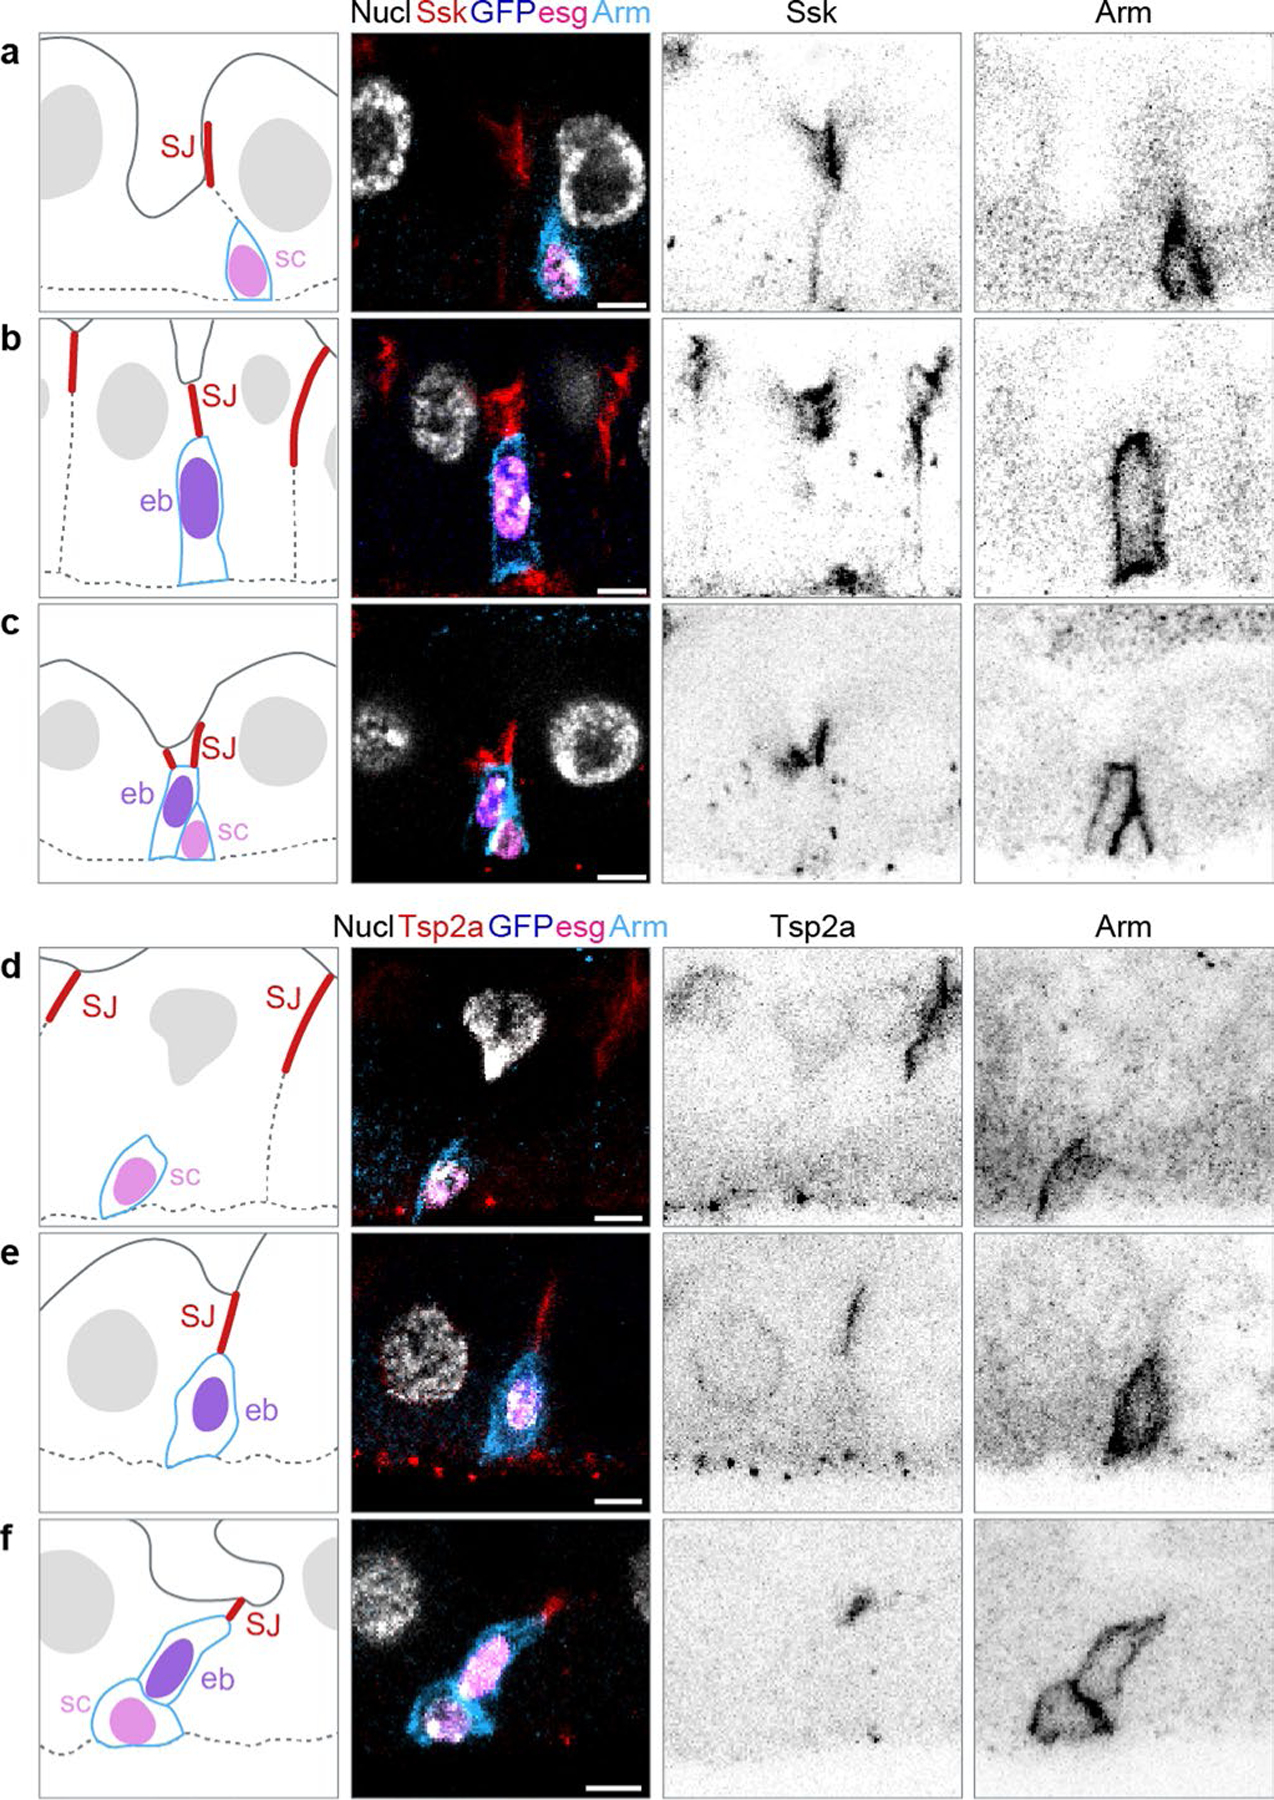
a-f, Images are representative of 119 stem cells and 125 enteroblasts across 5 guts. Scale bars, 5 μm, Full genotypes in Supplementary Table 1.
Extended Data Fig. 2 |. Same images as Fig. 2b,c, showing Su(H)-lacZ expression (b-galactosidase immunostain).
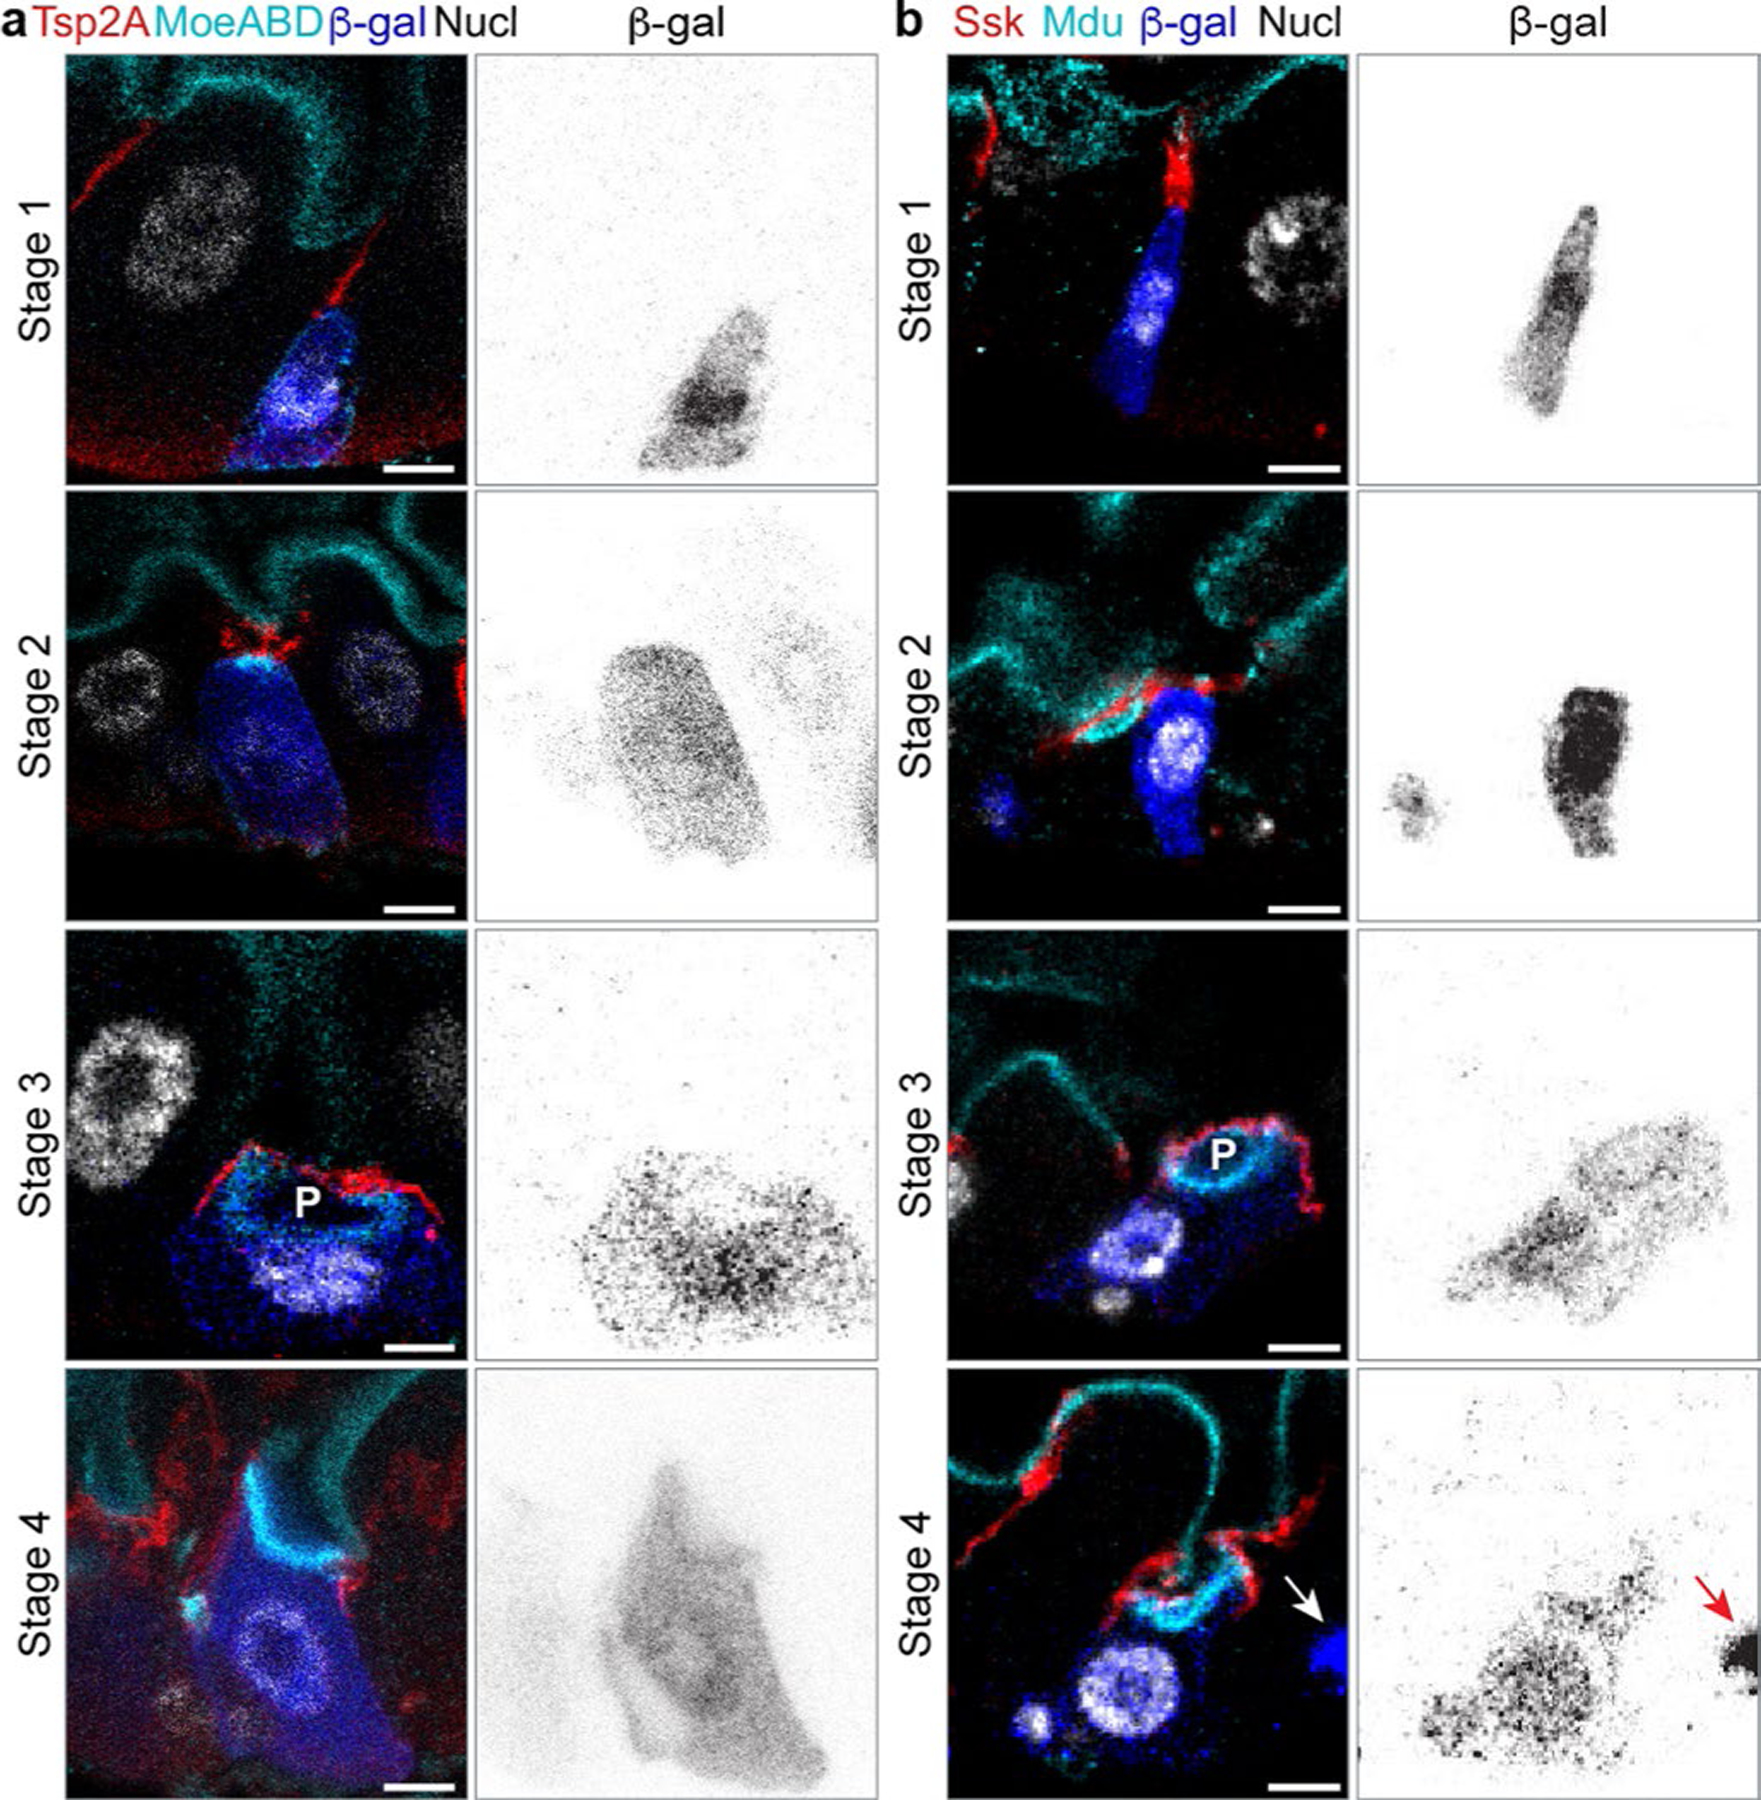
a-b, Multi-channel and β-galactosidase channel view of the same images as Fig. 2b,c. The presence of β-galactosidase in Stage 3 and Stage 4 cells demonstrates that these cells derived recently from enteroblasts. During acquisition of the Stage 3 and 4 images, the gain was increased compared to Stages 1 and 2 to visualize lower levels of β-galactosidase. Arrows in (b) point to a Stage 1 enteroblast next to the Stage 4 pre-enterocyte; at the higher gain necessary to visualize β-galactosidase in the Stage 4 pre-enterocyte, β-galactosidase intensity in the Stage 1 enteroblast is overexposed. Panels (a,b) are representative images collected from 40 guts in 2 independent experiments. Images are projections of short confocal stacks. Scale bars, 5 μm. Full genotypes in Supplementary Table 1.
Extended Data Fig. 3 |. Criteria for identification of integration stage for differentiating progenitor cells.
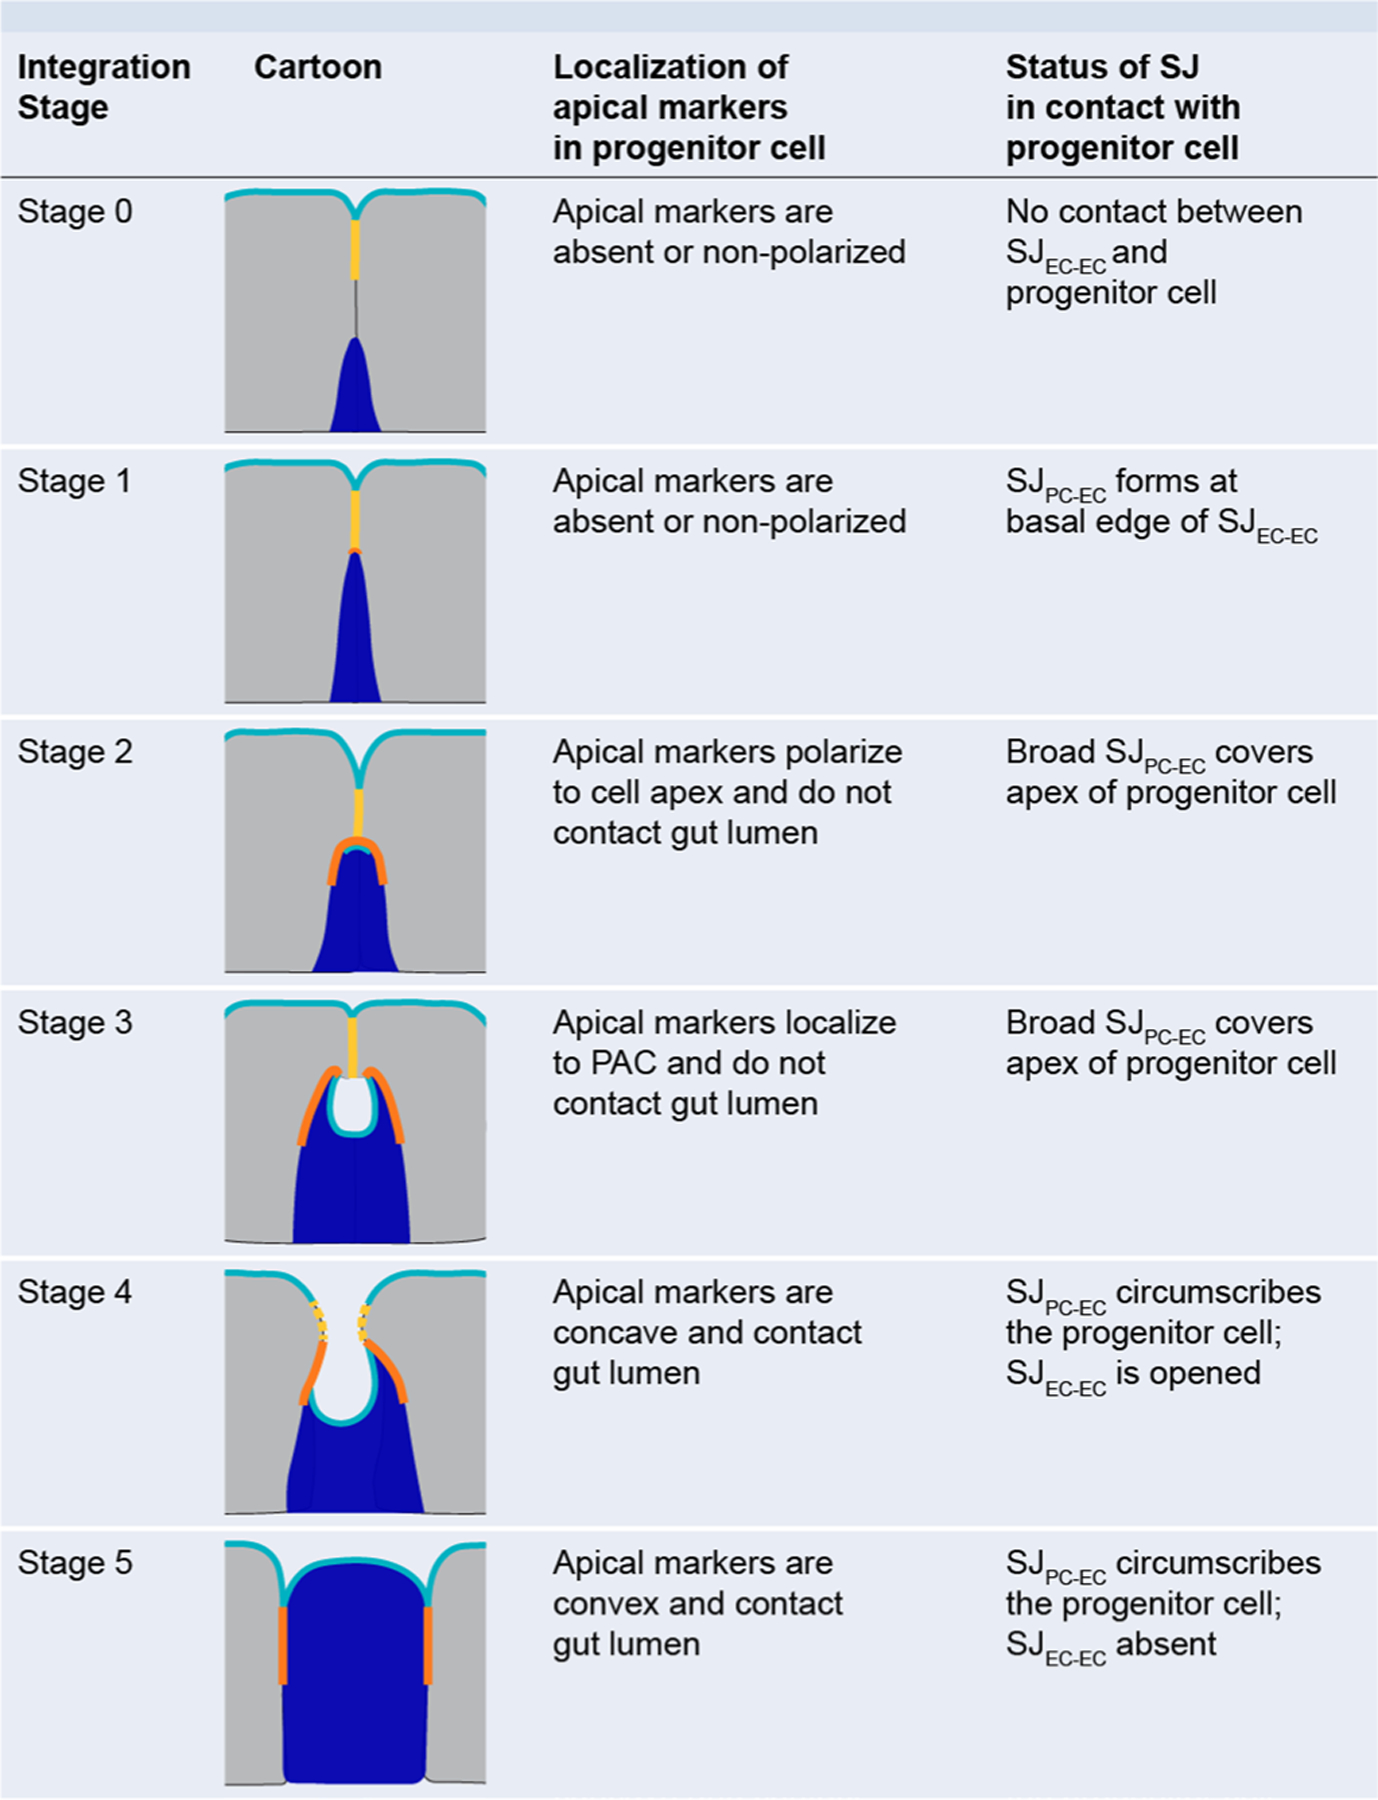
Integration stage is assessed by localization of two key markers: (1) apical membrane, and (2) SJ. Cartoons display marker localization for Stages 0–5. Apical membrane, cyan; SJEC-EC, yellow; SJPC-EC, orange; progenitor cell (Su(H)-lacZ+ enteroblast or pre-enterocyte), blue; mature neighbor enterocytes, gray.
Extended Data Fig. 4 |. The A142 splice trap transposon is inserted into CG2556/meduse, the Drosophila homolog of the mammalian actin bundling protein MISP.
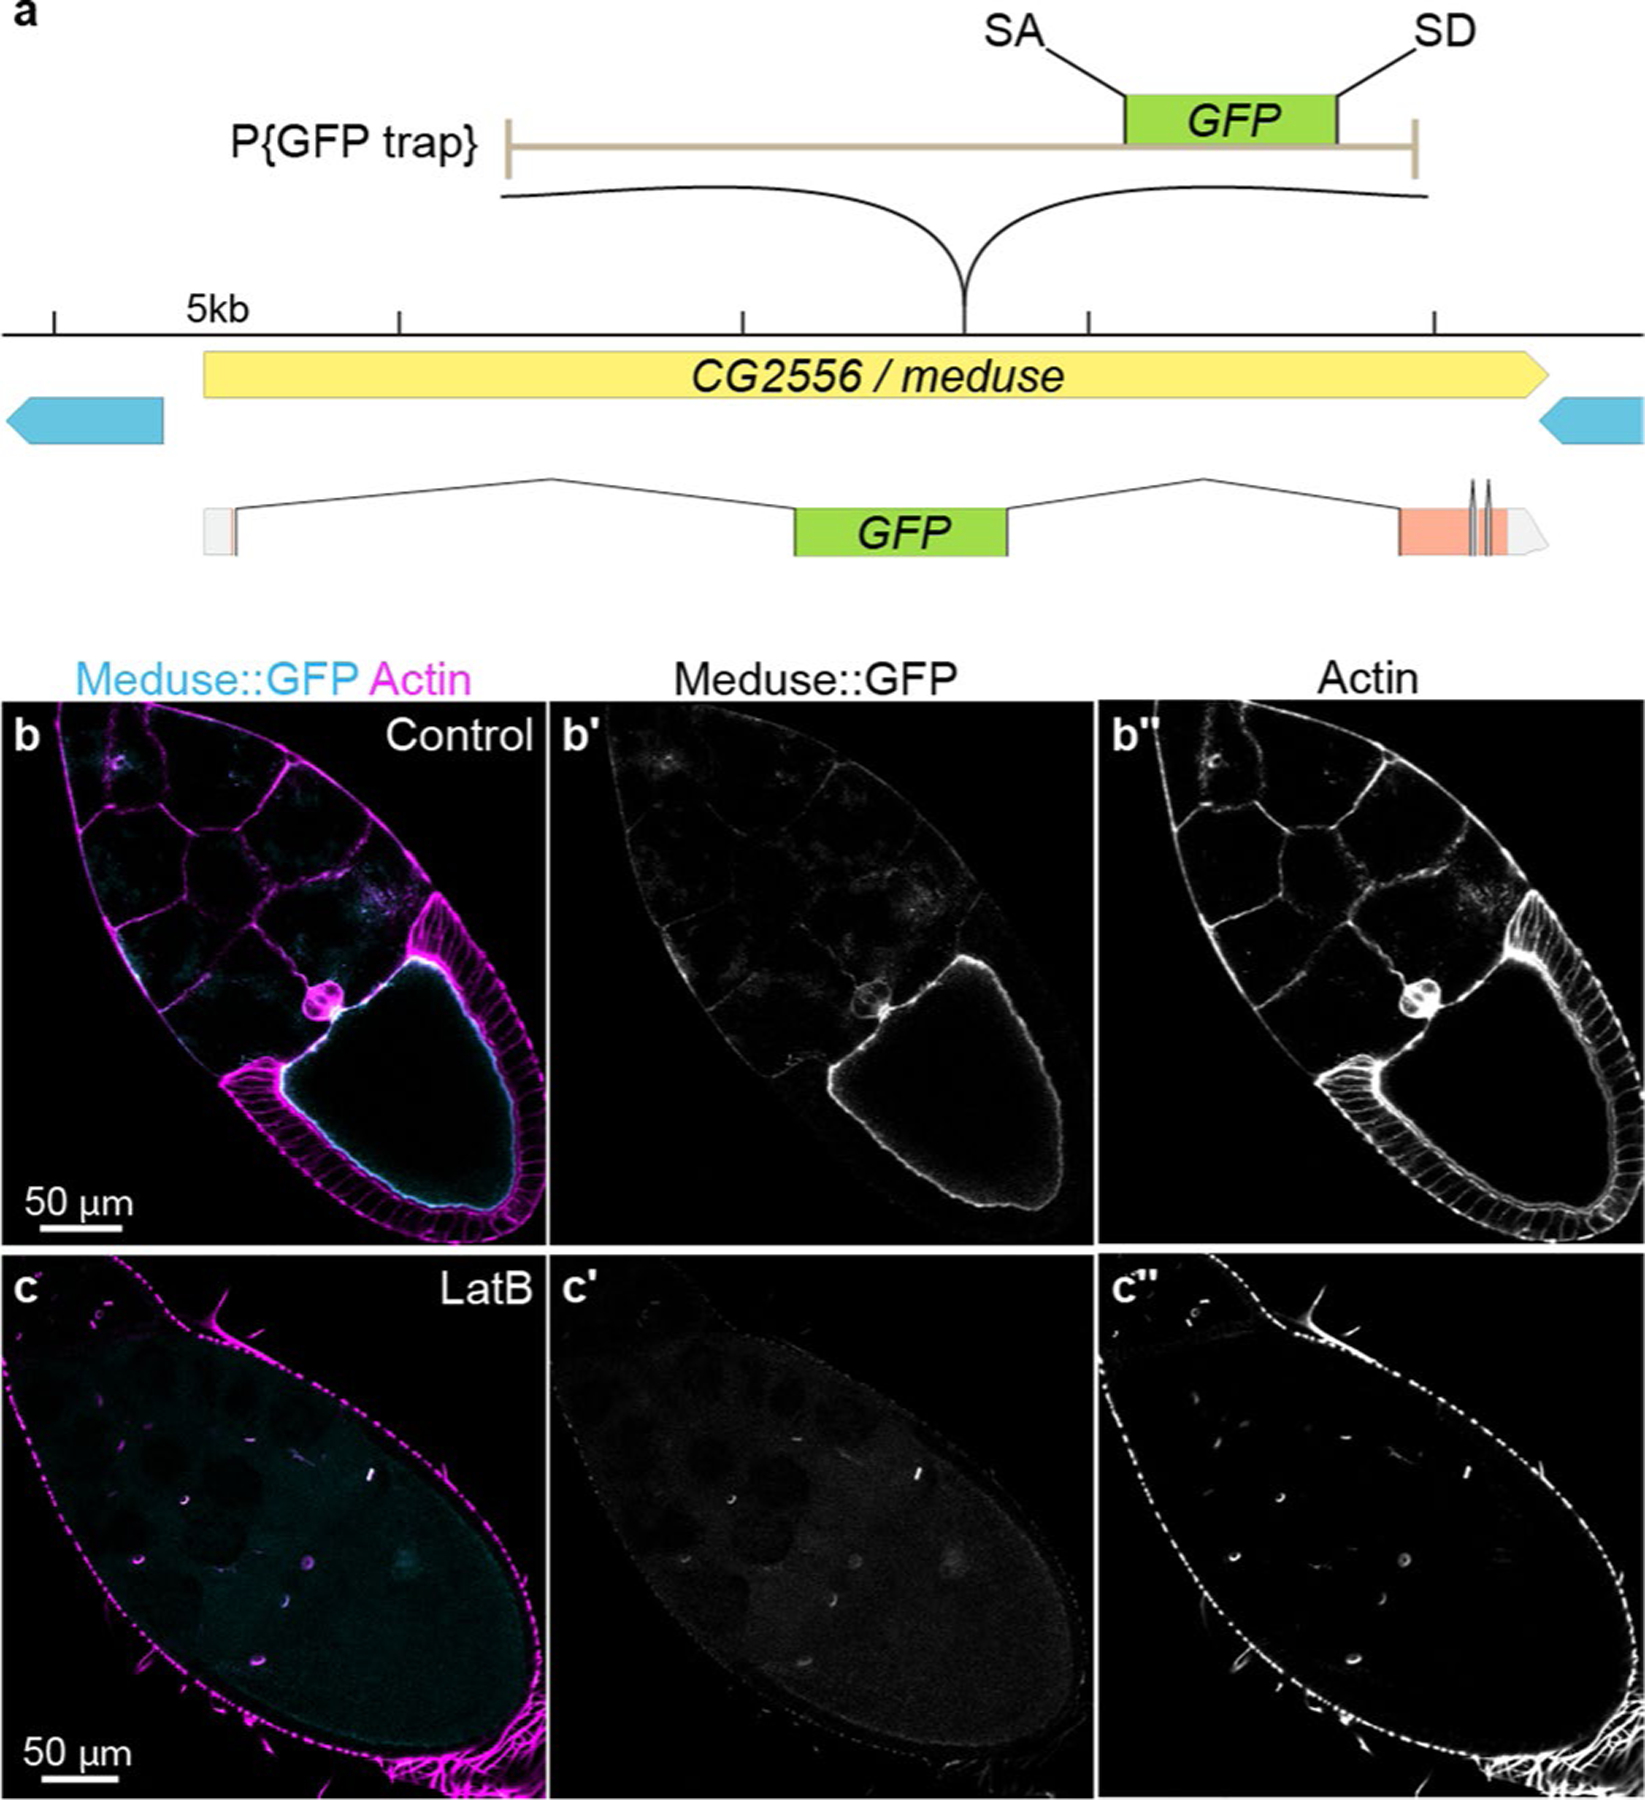
a, Genomic location of the splice trap transposon in the A142 line. The insertion was mapped by inverse PCR and genomic PCR to the large first intron of CG2556, approximately 10.6 kb downstream of the splice site in Exon 1. The transposon is inserted in the proper orientation to capture transcripts from CG2556, which would result in an N-terminal GFP tag on the nearly undisrupted protein (Exon 1 encodes only 7 amino acids, including the initiator Met). CG2556 was previously identified as a homolog of the mammalian Mitotic Interactor and Substrate of PLK1 (aka Mitotic Spindle Positioning, MISP)93. MISP is an actin bundling protein that localizes to the rootlets of mouse and human intestinal microvilli94. The tentacular appearance of the fusion protein in oocytes prompted us to name the gene meduse (mdu). b, Mdu::GFP (cyan) co-localizes with cortical actin filaments (magenta, Rhodamin-phalloidin) in Stage 10 oocytes. Image is representative of 10 oocytes. c, Latrunculin B (LatB) treatment disrupts cortical actin filaments in the oocyte and leads to abrogation of the oocyte Mdu::GFP signal. Note that LatB does not disrupt actin in ring canals; localization of Mdu::GFP to ring canals is visible in Panels (c) and (c′). Image is representative of 10 oocytes. Full genotype in Supplementary Table 1.
Extended Data Fig. 5 |. PAC integration affects neighboring enterocyte-enterocyte SJ dynamics.
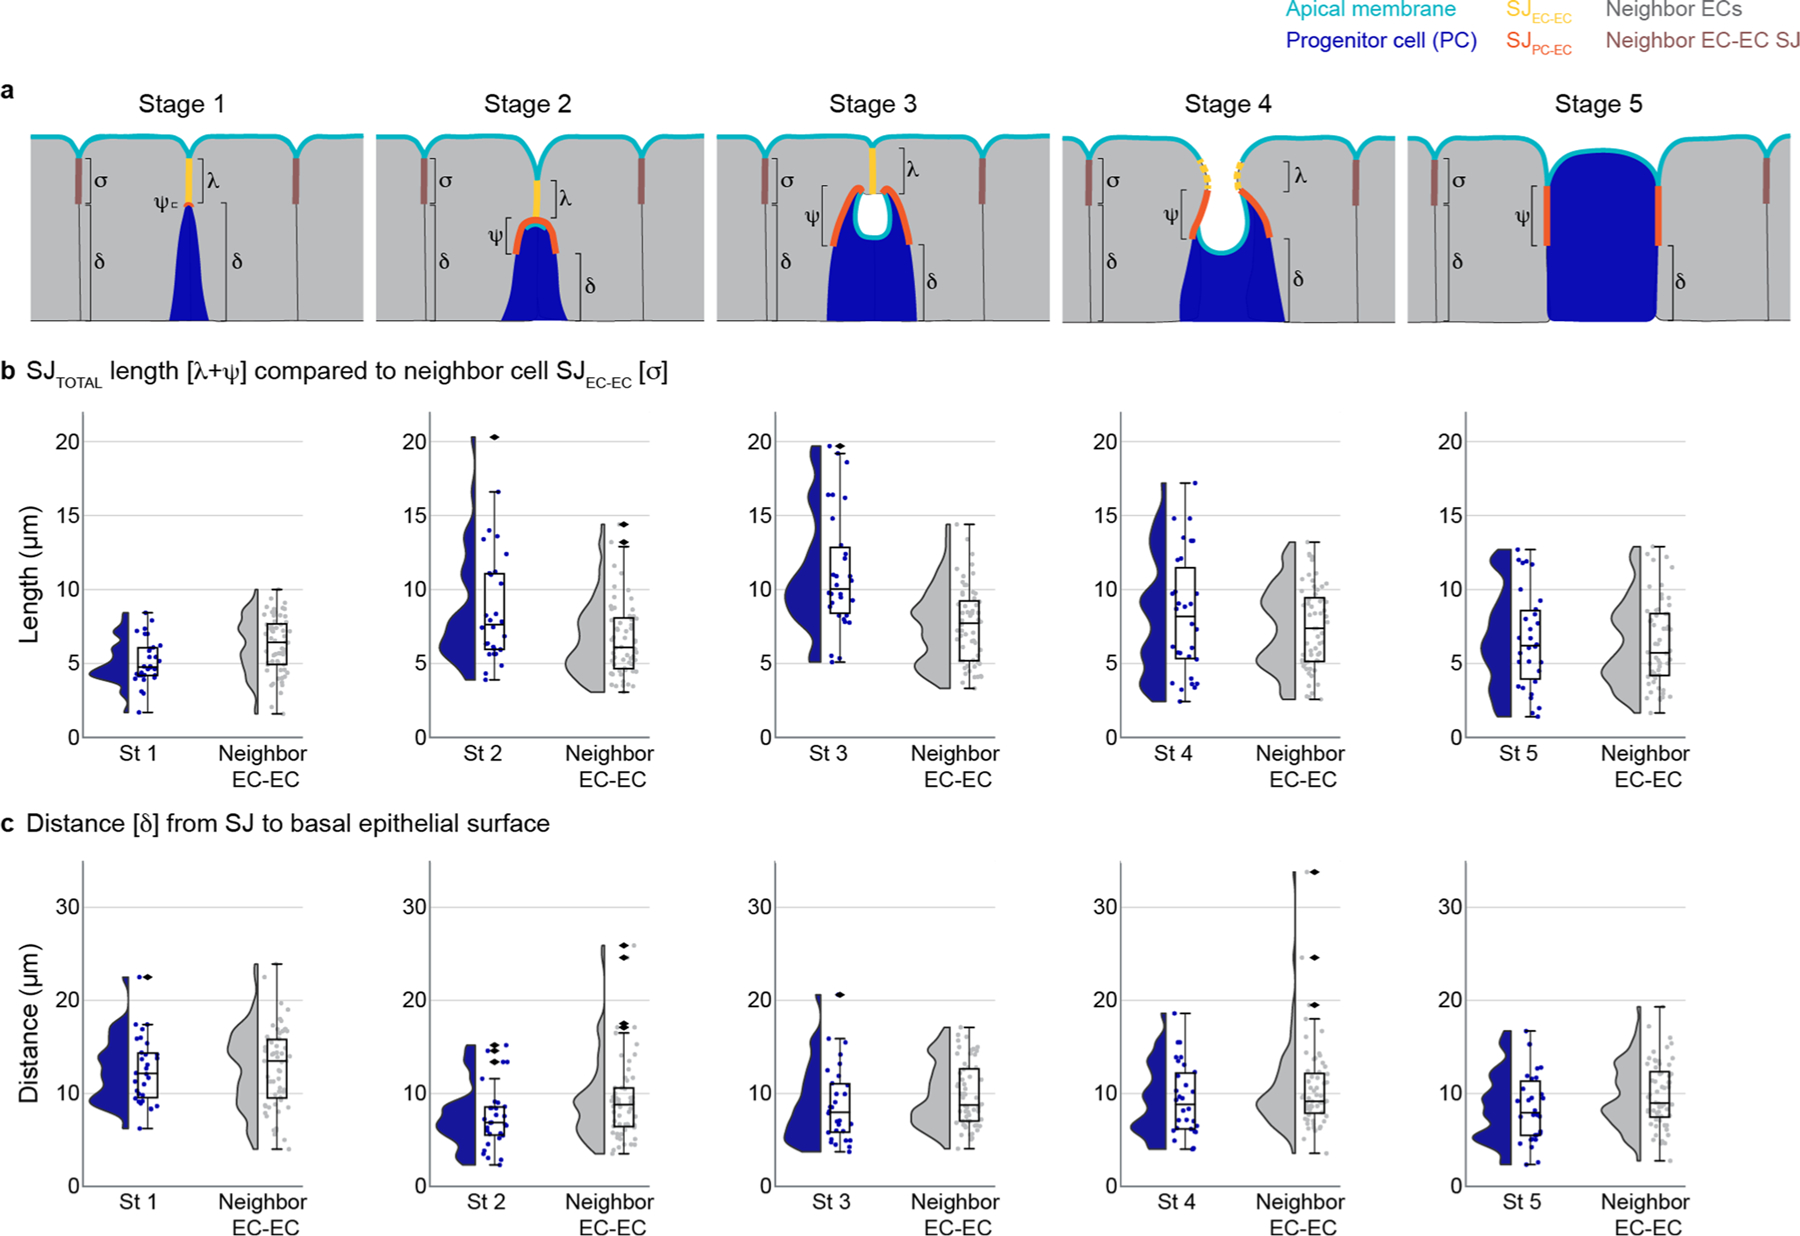
Volumetric images were analyzed from midguts that expressed Su(H)-lacZ and an apical marker (moeABD::GFP or mdu::GFP) and that were immunostained for β-galactosidase and an SJ marker (Ssk or Tsp2a). Full genotypes in Supplementary Table 1. a, Cartoon of the SJ parameters measured at each integration stage for progenitor-associated SJ: λ - SJEC-EC length, ψ - SJPC-EC length, and δ - distance from the basal edge of the SJ to the basal epithelium; and parameters measured for neighbor EC-EC SJ: σ - SJEC-EC length, and δ - distance from the basal edge of the SJ to the basal epithelium. Apical membrane, cyan; progenitor SJEC-EC, yellow; progenitor SJPC-EC, orange; progenitor cell (Su(H)-lacZ+ enteroblast or pre-enterocyte), blue; mature neighbor enterocytes, gray; neighbor SJEC-EC, brown. See Methods for measurement details. In Stage 4 depiction, dashed yellow line represents SJEC-EC that is out-of-plane of the drawing. b-c, Raincloud plots (violin plot on left; boxplot on right) show the indicated measurements for SJs associated with Stage 1–5 progenitor cells (blue; n=30 SJs for each stage) and the SJs associated with neighboring enterocytes (gray; n=60 SJs for each stage, two per each integrating progenitor). (b), Total length of SJ associated with progenitor cell (λ + ψ) compared to length of SJ between neighbor EC-EC (σ). (c), Distance from basal edge of the SJ to the basal epithelium (δ). Boxplots display median as center line, the bounds of the box represent the first and third quartiles, minimum and maximum values shown by whiskers, diamonds indicate outliers. (N=7 guts; n=150 progenitor cells).
Extended Data Fig. 6 |. High resolution view of FIB-SEM section shown in Fig. 5d.
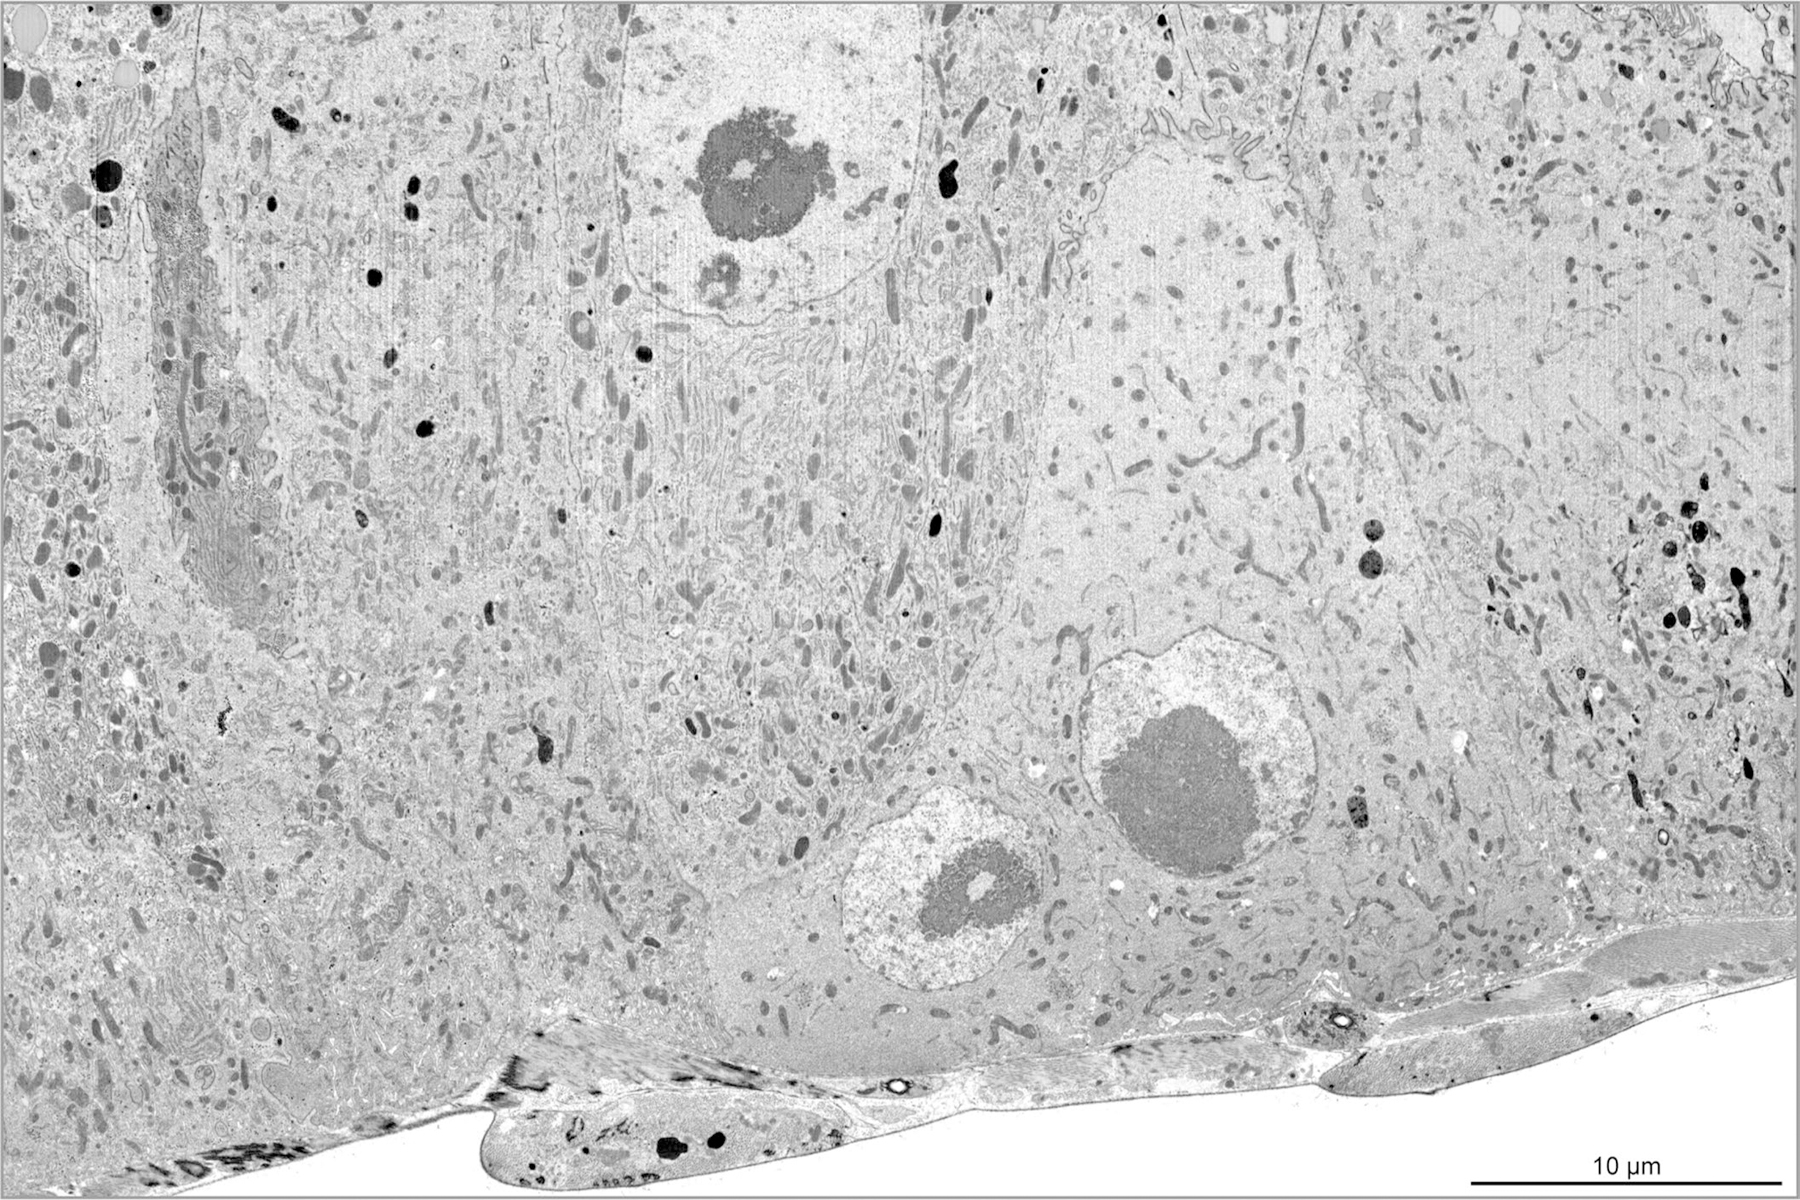
30 nm-thick sections were cut with a gallium ion beam at 30 keV and 770 pA. Images were taken with the electron beam at 2 keV, 0.8 nA, 2 μm working distance, 20 μs dwell time, 6144×4096 pixel frame size. Pixel size 9.7 nm. Scale bar, 10 μm. Full genotype in Supplementary Table 1.
Extended Data Fig. 7 |. EC density is unaffected by SJ knockdown but increases following growth inhibition.
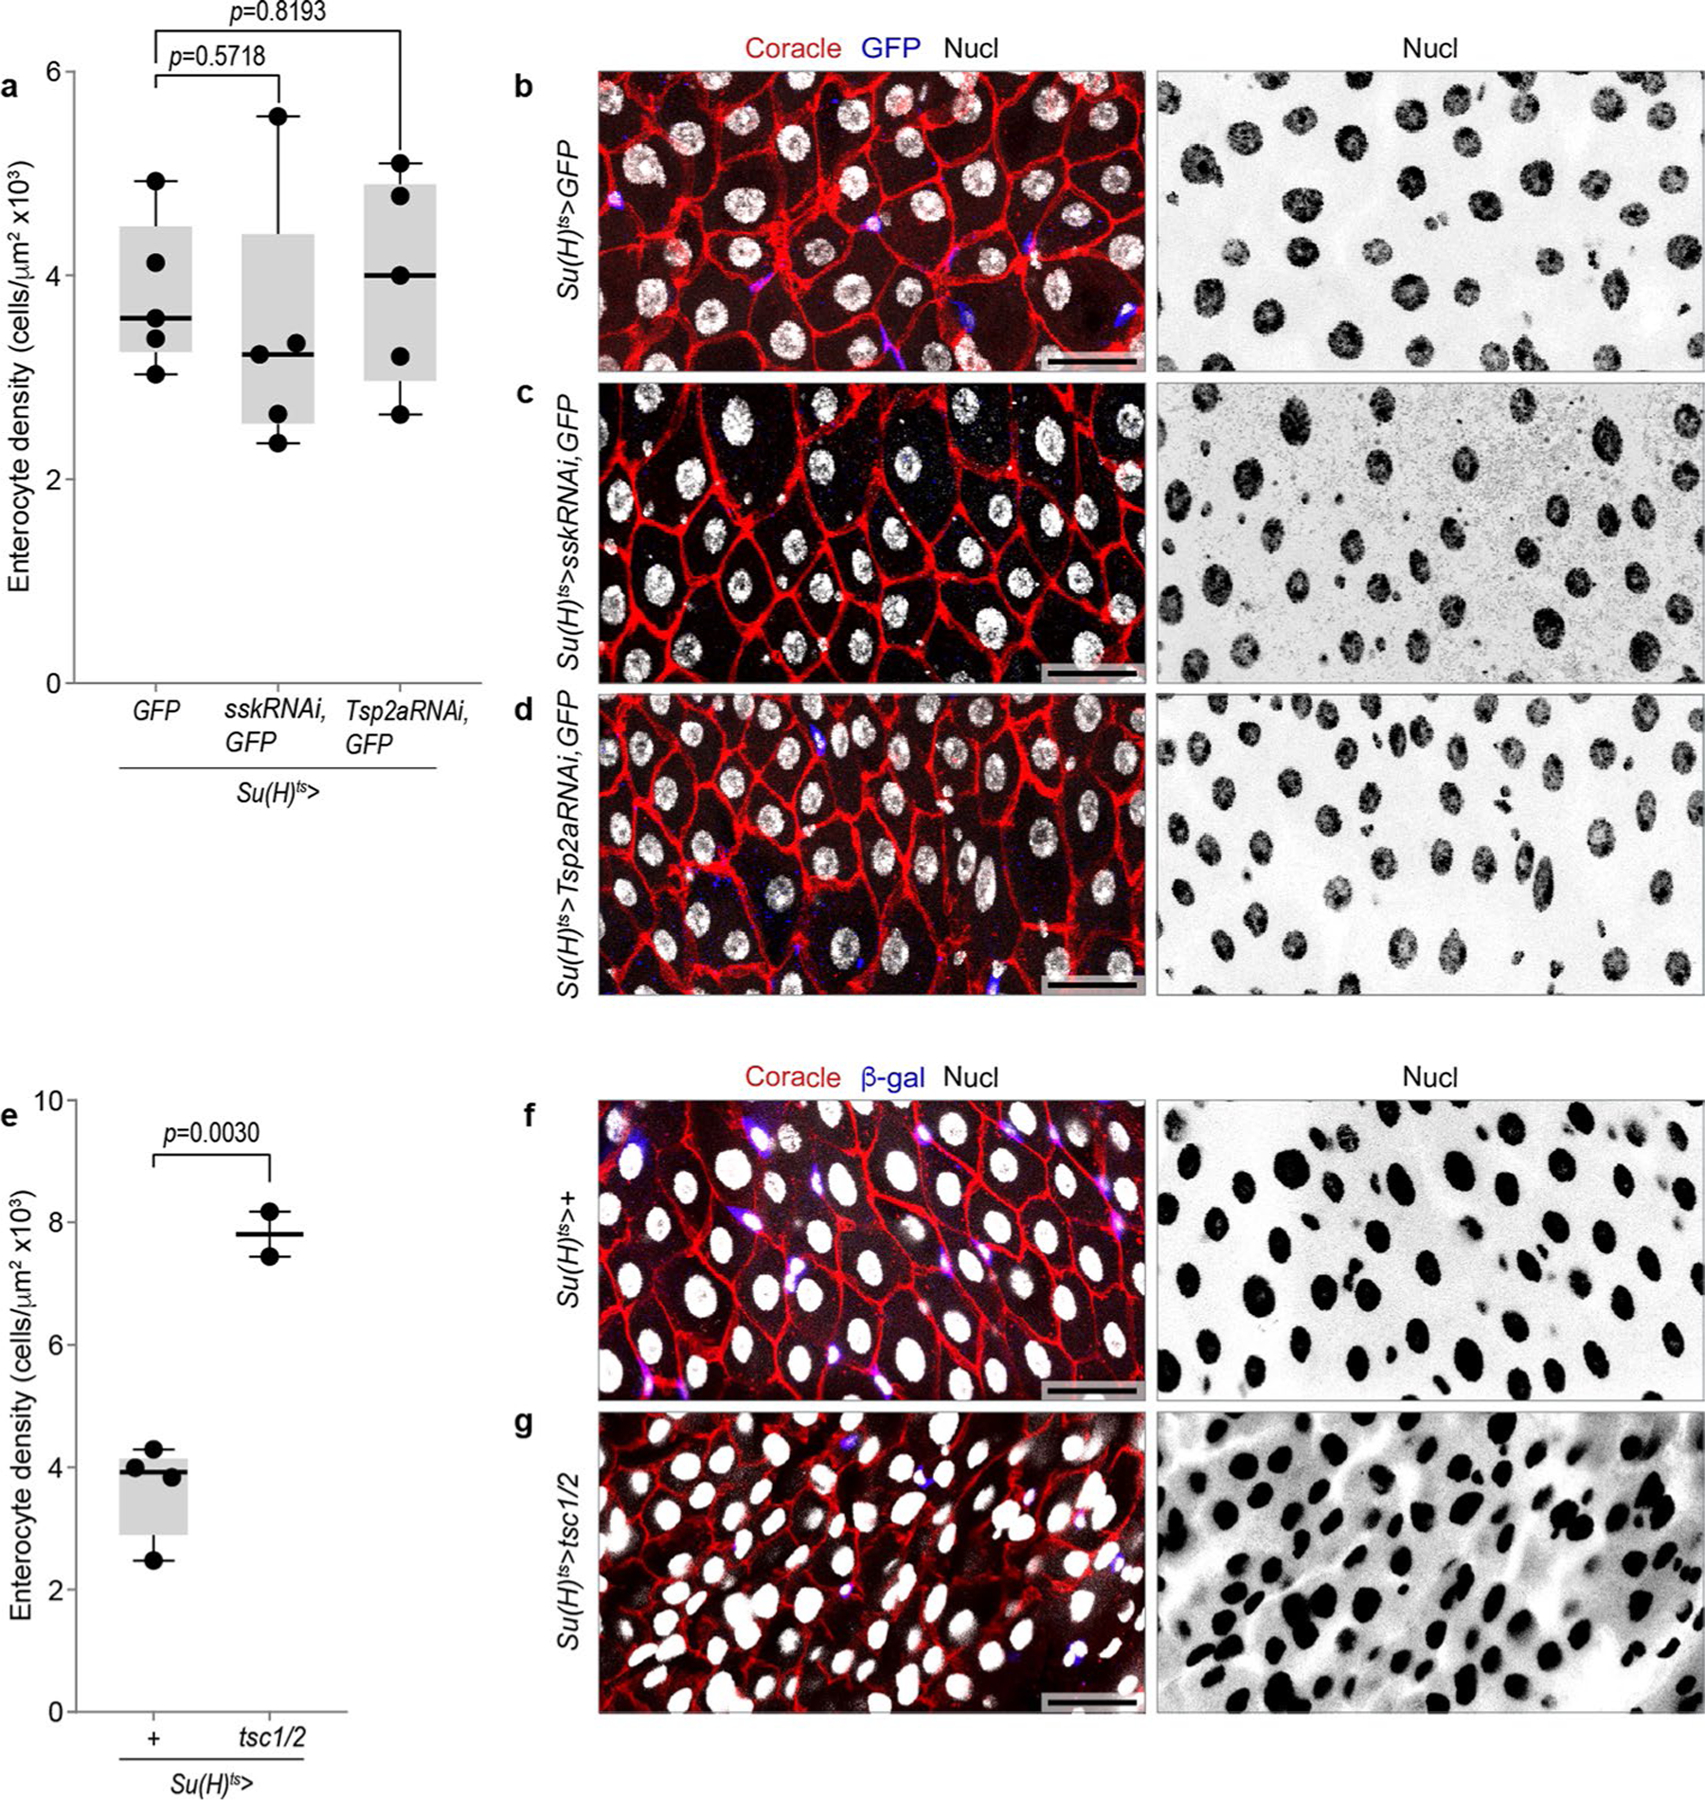
a-d, Knockdown of SJ components in enteroblasts does not affect enterocyte density. (a) Boxplot shows the enterocyte density in R4 region of midguts (N=5 guts per genotype). Boxplots display median as center line, the bounds of the box represent the first and third quartiles, minimum and maximum values shown by whiskers. Each data point represents one midgut. Su(H)ts>GFP versus Su(H)ts>sskRNAi (two-tailed Student’s t-test, p=0.8193), Su(H)ts>GFP versus Su(H)ts>Tsp2aRNAi (two-tailed Student’s t-test, p=0.5718). (b-d), Representative immunofluorescent images of gut epithelia from (a) Su(H)ts>GFP, (b) Su(H)ts>sskRNAi, GFP, and (c) Su(H)ts>Tsp2aRNAi, GFP. Guts immunostained for GFP (blue), the SJ marker Coracle (red), and nuclei (DAPI, grayscale). e-g, Growth inhibition in enteroblasts increases enterocyte density. (e) Boxplot shows the enterocyte density in R4 region of midguts (Su(H)ts>+, N=4 guts; Su(H)ts>tsc1/2, N=2 guts). Boxplots display median as center line, the bounds of the box represent the first and third quartiles, minimum and maximum values shown by whiskers. Each data point represents one midgut. Su(H)ts>+ versus Su(H)ts>tsc1/2 (two-tailed Student’s t-test, p=0.0030). (f,g), Representative immunofluorescent images of gut epithelia from (f) Su(H)ts>+ and (g) Su(H)ts>tsc1/2. Guts immunostained for GFP (blue), the SJ marker Coracle (red), and nuclei (DAPI, grayscale). Scale bars, 25 μm. Full genotypes are in Supplementary Table 1.
Extended Data Fig. 8 |. Mechanisms of epithelial cell incorporation.
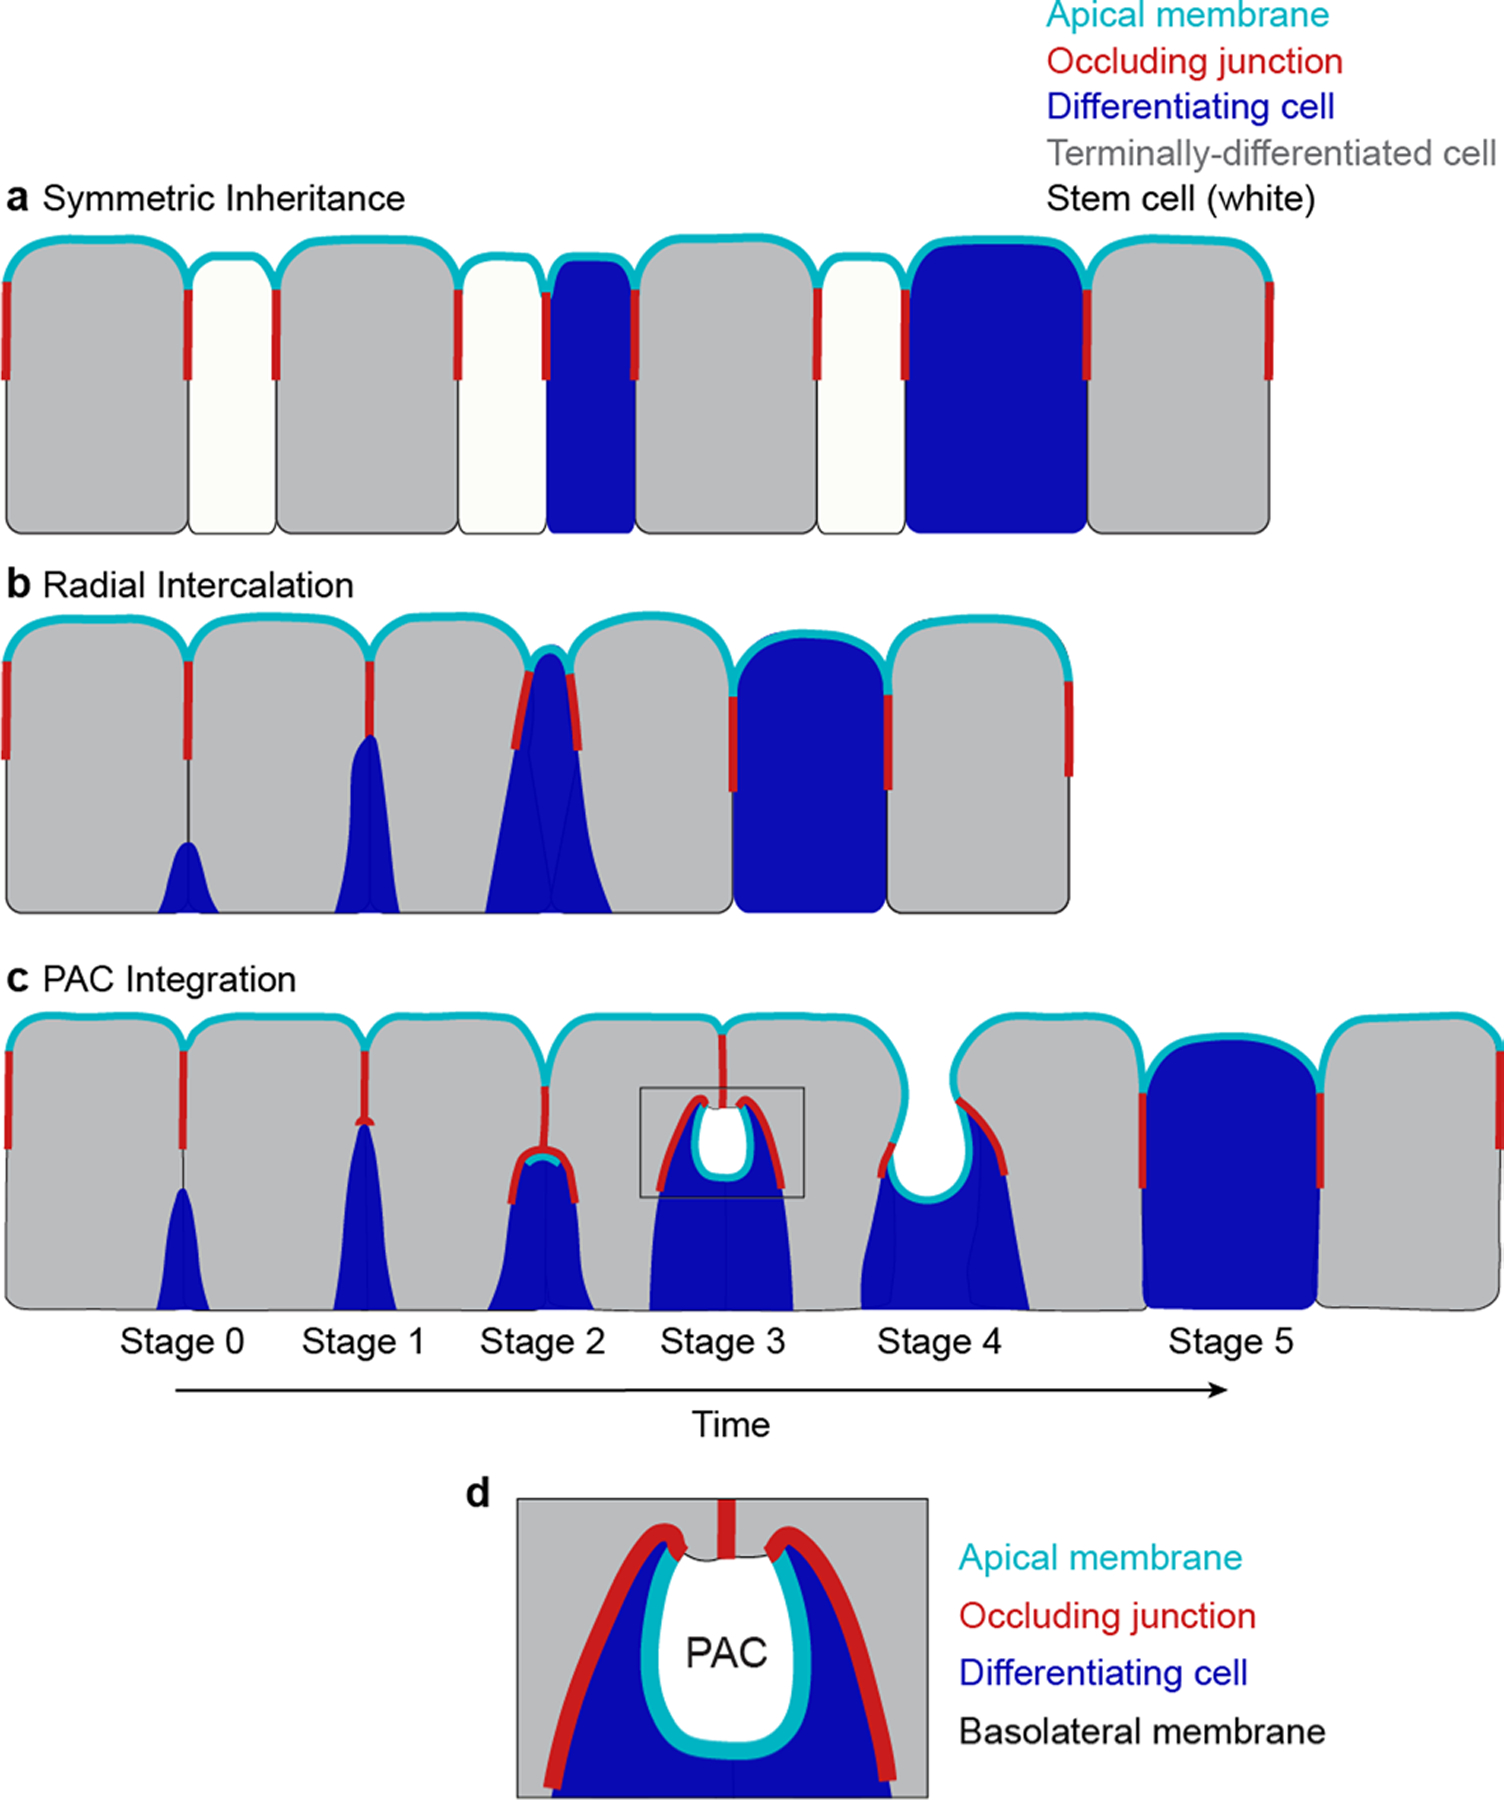
Three mechanisms to incorporate stem cell progeny into a mature epithelium are shown. Apical membrane (cyan), occluding junction (red), differentiating cell (blue), terminally-differentiated cells (gray), and stem cells (white). a, Symmetric inheritance. Stem cells possess occluding junctions, which are inherited by their progeny. b, Radial intercalation. Stem cells lack occluding junctions. As stem cell progeny differentiate, they grow apically, wedging themselves between terminally-differentiated cells. When they reach the occluding junction of the epithelium, the differentiating cell forms occluding junctions with its neighbors. These junctions expand radially in a ring around the cell’s nascent apical membrane. c, Pre-assembled Apical Compartment (PAC) integration. Stem cells lack occluding junctions Differentiating cells create a transient, occluding junction niche that supports development of the new cell’s future, lumen-facing apical surface. This Pre-assembled Apical Compartment (PAC) is formed from deep, apical plasma membrane pit in the differentiating cell that is covered by overlying mature cells. As the new cell grows and differentiates, the transitional junction mediates a basal-to-apical neighbor exchange between the new cell and mature cells that exposes the PAC to the gut lumen and seamlessly integrates the new cell into the epithelial barrier. d, PACs are asymmetric structures with split apical/basolateral character. The pre-enterocyte’s apical membrane pit accounts for most of the PAC’s surface area.
Supplementary Material
Acknowledgements
We are grateful to A. Bardin, D. Bilder, N. Buchon, J. de Navascues, M. Furuse, Y. Inoue, H. Jasper, S. Siegrist, N. Tapon and Drosophila stock centres (Bloomington Drosophila Stock Center (NIH P40OD018537), Vienna Drosophila Resource Center (Dietzl et al., 2007), Kyoto Drosophila Genomics and Genetic Resources) for fly stocks; M. Furuse, S. Russell and X. Yang for antibodies; M. Petersen and E. Smith for illustrations; S. Xie for Python support; and J. Mulholland and K. Lee for microscopy support. Confocal microscopy was performed at the Stanford Beckman Cell Sciences Imaging Facility (NIH 1S10OD01058001A1, NIH 1S10OD010580). We thank D. Bryant, T. Reiff, D. St. Johnston, J. Chen and members of the O’Brien lab for invaluable discussions. A. Galenza is supported by a Canadian Institutes of Health Research Fellowship MFE 181906. P.M.R. was supported by a Stanford Bio-X Bowes Graduate Fellowship, an EMBO Short-Term Travelling Fellowship, and a Stanford DARE Graduate Fellowship (Diversifying Academia, Recruiting Excellence). The authors acknowledge the financial support by the Faculty of Biology and Medicine of the University of Lausanne and of the Swiss National Science Foundation, R’Equip Grant 316030_128692. This work was supported by NIH R01GM116000-01A1, NIH R35GM141885-01, NIH 1R01DK128485-01A1 and ACS RSG-17-167-01 to L.E.O. L.E.O. is an investigator of the Chan-Zuckerberg Biohub.
Footnotes
Online content
Any methods, additional references, Nature Portfolio reporting summaries, source data, extended data, supplementary information, acknowledgements, peer review information; details of author contributions and competing interests; and statements of data and code availability are available at https://doi.org/10.1038/s41556-023-01116-w.
Reporting summary
Further information on research design is available in the Nature Portfolio Reporting Summary linked to this article.
Competing interests
The authors declare no competing interests.
Additional information
Extended data is available for this paper at https://doi.org/10.1038/s41556-023-01116-w.
Supplementary information The online version contains supplementary material available at https://doi.org/10.1038/s41556-023-01116-w.
Peer review information Nature Cell Biology thanks Barry Thompson, Bruce Edgar and the other, anonymous, reviewer(s) for their contribution to the peer review of this work.
Data availability
EM data are available through EMBL-EBI BioStudies under accession number S-BSST946. Source data are provided with this paper. All other data are available from the corresponding author on reasonable request.
References
- 1.Guillot C & Lecuit T Mechanics of epithelial tissue homeostasis and morphogenesis. Science 340, 1185–1189 (2013). [DOI] [PubMed] [Google Scholar]
- 2.Leblond CP The life history of cells in renewing systems. Am. J. Anat 160, 114–158 (1981). [DOI] [PubMed] [Google Scholar]
- 3.Liang J, Balachandra S, Ngo S & O’Brien LE Feedback regulation of steady-state epithelial turnover and organ size. Nature 548, 588–591 (2017). [DOI] [PMC free article] [PubMed] [Google Scholar]
- 4.Macara IG, Guyer R, Richardson G, Huo Y & Ahmed SM Epithelial homeostasis. Curr. Biol 24, R815–R825 (2014). [DOI] [PMC free article] [PubMed] [Google Scholar]
- 5.Pellettieri J & Alvarado AS Cell turnover and adult tissue homeostasis: from humans to planarians. Annu. Rev. Genet 41, 83–105 (2007). [DOI] [PubMed] [Google Scholar]
- 6.Linden SK, Sutton P, Karlsson NG, Korolik V & McGuckin MA Mucins in the mucosal barrier to infection. Mucosal Immunol 1, 183–197 (2008). [DOI] [PMC free article] [PubMed] [Google Scholar]
- 7.McGuckin MA, Lindén SK, Sutton P & Florin TH Mucin dynamics and enteric pathogens. Nat. Rev. Microbiol 9, 265–278 (2011). [DOI] [PubMed] [Google Scholar]
- 8.Overeem AW, Bryant DM & van IJzendoorn SCD Mechanisms of apical–basal axis orientation and epithelial lumen positioning. Trends Cell Biol 25, 476–485 (2015). [DOI] [PubMed] [Google Scholar]
- 9.Varadarajan S, Stephenson RE & Miller AL Multiscale dynamics of tight junction remodeling. J. Cell Sci 132, jcs229286 (2019). [DOI] [PMC free article] [PubMed] [Google Scholar]
- 10.Evans MJ & Moller PC Biology of airway basal cells. Exp. Lung Res 17, 513–531 (1991). [DOI] [PubMed] [Google Scholar]
- 11.Evans MJ, Plopper CG, Van Winkle LS & Fanucchi MV Cellular and molecular characteristics of basal cells in airway epithelium. Exp. Lung Res 27, 401–415 (2001). [DOI] [PubMed] [Google Scholar]
- 12.Rock JR et al. Basal cells as stem cells of the mouse trachea and human airway epithelium. Proc. Natl Acad. Sci. USA 106, 12771–12775 (2009). [DOI] [PMC free article] [PubMed] [Google Scholar]
- 13.Sekiya K, Futaesaku Y & Nakase Y Electron microscopic observations on tracheal epithelia of mice infected with Bordetella bronchiseptica. Microbiol. Immunol 32, 461–472 (1988). [DOI] [PubMed] [Google Scholar]
- 14.Chepko G & Dickson RB Ultrastructure of the putative stem cell niche in rat mammary epithelium. Tissue Cell 35, 83–93 (2003). [DOI] [PubMed] [Google Scholar]
- 15.Chepko G & Smith GH Three division-competent, structurally-distinct cell populations contribute to murine mammary epithelial renewal. Tissue Cell 29, 239–253 (1997). [DOI] [PubMed] [Google Scholar]
- 16.Tsujimura A et al. Proximal location of mouse prostate epithelial stem cells: a model of prostatic homeostasis. J. Cell Biol 157, 1257–1265 (2002). [DOI] [PMC free article] [PubMed] [Google Scholar]
- 17.Cotsarelis G, Cheng S-Z, Dong G, Sun T-T & Lavker RM Existence of slow-cycling limbal epithelial basal cells that can be preferentially stimulated to proliferate: implications on epithelial stem cells. Cell 57, 201–209 (1989). [DOI] [PubMed] [Google Scholar]
- 18.Leung CT, Coulombe PA & Reed RR Contribution of olfactory neural stem cells to tissue maintenance and regeneration. Nat. Neurosci 10, 720–726 (2007). [DOI] [PubMed] [Google Scholar]
- 19.Korzelius J et al. Escargot maintains stemness and suppresses differentiation in Drosophila intestinal stem cells. EMBO J 33, 2967–2982 (2014). [DOI] [PMC free article] [PubMed] [Google Scholar]
- 20.Resnik-Docampo M et al. Tricellular junctions regulate intestinal stem cell behaviour to maintain homeostasis. Nat. Cell Biol 19, 52–59 (2017). [DOI] [PMC free article] [PubMed] [Google Scholar]
- 21.Xu C et al. The septate junction Protein Tsp2A restricts intestinal stem cell activity via endocytic regulation of aPKC and hippo signaling. Cell Rep 26, 670–688.e6 (2019). [DOI] [PMC free article] [PubMed] [Google Scholar]
- 22.Jinguji Y & Ishikawa H Electron microscopic observations on the maintenance of the tight junction during cell division in the epithelium of the mouse small intestine. Cell Struct. Funct 17, 27–37 (1992). [DOI] [PubMed] [Google Scholar]
- 23.Zhou B et al. Claudin-18–mediated YAP activity regulates lung stem and progenitor cell homeostasis and tumorigenesis. J. Clin. Invest 128, 970–984 (2018). [DOI] [PMC free article] [PubMed] [Google Scholar]
- 24.Merzdorf CS, Chen Y-H & Goodenough DA Formation of functional tight junctions in Xenopus embryos. Dev. Biol 195, 187–203 (1998). [DOI] [PubMed] [Google Scholar]
- 25.Deblandre GA, Wettstein DA, Koyano-Nakagawa N & Kintner C A two-step mechanism generates the spacing pattern of the ciliated cells in the skin of Xenopus embryos. Development 126, 4715–4728 (1999). [DOI] [PubMed] [Google Scholar]
- 26.Stubbs JL, Davidson L, Keller R & Kintner C Radial intercalation of ciliated cells during Xenopus skin development. Development 133, 2507–2515 (2006). [DOI] [PubMed] [Google Scholar]
- 27.Voiculescu O, Bertocchini F, Wolpert L, Keller RE & Stern CD The amniote primitive streak is defined by epithelial cell intercalation before gastrulation. Nature 449, 1049–1052 (2007). [DOI] [PubMed] [Google Scholar]
- 28.McMahon A, Supatto W, Fraser SE & Stathopoulos A Dynamic analyses of Drosophila gastrulation provide insights into collective cell migration. Science 322, 1546–1550 (2008). [DOI] [PMC free article] [PubMed] [Google Scholar]
- 29.Campbell K, Casanova J & Skaer H Mesenchymal-to-epithelial transition of intercalating cells in Drosophila renal tubules depends on polarity cues from epithelial neighbours. Mech. Dev 127, 345–357 (2010). [DOI] [PMC free article] [PubMed] [Google Scholar]
- 30.Sedzinski J, Hannezo E, Tu F, Biro M & Wallingford JB Emergence of an apical epithelial cell surface in vivo. Dev. Cell 36, 24–35 (2016). [DOI] [PMC free article] [PubMed] [Google Scholar]
- 31.Sedzinski J, Hannezo E, Tu F, Biro M & Wallingford JB RhoA regulates actin network dynamics during apical surface emergence in multiciliated epithelial cells. J. Cell Sci 130, 420–428 (2017). [DOI] [PMC free article] [PubMed] [Google Scholar]
- 32.Ventura G et al. Multiciliated cells use filopodia to probe tissue mechanics during epithelial integration in vivo. Nat. Commun 13, 6423 (2022). [DOI] [PMC free article] [PubMed] [Google Scholar]
- 33.Walck-Shannon E & Hardin J Cell intercalation from top to bottom. Nat. Rev. Mol. Cell Biol 15, 34–48 (2014). [DOI] [PMC free article] [PubMed] [Google Scholar]
- 34.Chen J, Sayadian A-C, Lowe N, Lovegrove HE & St Johnston D An alternative mode of epithelial polarity in the Drosophila midgut. PLoS Biol 16, e3000041 (2018). [DOI] [PMC free article] [PubMed] [Google Scholar]
- 35.Burel A et al. A targeted 3D EM and correlative microscopy method using SEM array tomography. Development 145, dev160879 (2018). [DOI] [PubMed] [Google Scholar]
- 36.Kolotuev I Positional correlative anatomy of invertebrate model organisms increases efficiency of TEM data production. Microsc. Microanal 20, 1392–1403 (2014). [DOI] [PubMed] [Google Scholar]
- 37.Lemaitre B & Miguel-Aliaga I The digestive tract of drosophila melanogaster. Annu Rev. Genet 47, 377–404 (2013). [DOI] [PubMed] [Google Scholar]
- 38.Chen J & St Johnston D Epithelial cell polarity during drosophila midgut development. Front. Cell Dev. Biol 10, 886773 (2022). [DOI] [PMC free article] [PubMed] [Google Scholar]
- 39.Furuse M & Izumi Y Molecular dissection of smooth septate junctions: understanding their roles in arthropod physiology: smooth septate junction-associated proteins. Ann. N. Y. Acad. Sci 1397, 17–24 (2017). [DOI] [PubMed] [Google Scholar]
- 40.Jiang H & Edgar BA EGFR signaling regulates the proliferation of Drosophila adult midgut progenitors. Development 136, 483–493 (2009). [DOI] [PMC free article] [PubMed] [Google Scholar]
- 41.Micchelli CA & Perrimon N Evidence that stem cells reside in the adult Drosophila midgut epithelium. Nature 439, 475–479 (2006). [DOI] [PubMed] [Google Scholar]
- 42.Ohlstein B & Spradling A The adult Drosophila posterior midgut is maintained by pluripotent stem cells. Nature 439, 470–474 (2006). [DOI] [PubMed] [Google Scholar]
- 43.Bardin AJ, Perdigoto CN, Southall TD, Brand AH & Schweisguth F Transcriptional control of stem cell maintenance in the Drosophila intestine. Development 137, 705–714 (2010). [DOI] [PMC free article] [PubMed] [Google Scholar]
- 44.Ohlstein B & Spradling A Multipotent Drosophila intestinal stem cells specify daughter cell fates by differential Notch signaling. Science 315, 988–992 (2007). [DOI] [PubMed] [Google Scholar]
- 45.Perdigoto CN, Schweisguth F & Bardin AJ Distinct levels of Notch activity for commitment and terminal differentiation of stem cells in the adult fly intestine. Development 138, 4585–4595 (2011). [DOI] [PubMed] [Google Scholar]
- 46.de Navascués J et al. Drosophila midgut homeostasis involves neutral competition between symmetrically dividing intestinal stem cells. EMBO J 31, 2473–2485 (2012). [DOI] [PMC free article] [PubMed] [Google Scholar]
- 47.Xiang J et al. EGFR-dependent TOR-independent endocycles support Drosophila gut epithelial regeneration. Nat. Commun 8, 15125 (2017). [DOI] [PMC free article] [PubMed] [Google Scholar]
- 48.Izumi Y, Motoishi M, Furuse K & Furuse M A tetraspanin regulates septate junction formation in Drosophila midgut. J. Cell Sci 129, 1155–1164 (2016). [DOI] [PubMed] [Google Scholar]
- 49.Yanagihashi Y et al. Snakeskin, a membrane protein associated with smooth septate junctions, is required for intestinal barrier function in Drosophila. J. Cell Sci 125, 1980–1990 (2012). [DOI] [PubMed] [Google Scholar]
- 50.Bachmair A, Finley D & Varshavsky A In vivo half-life of a protein is a function of its amino-terminal residue. Science 234, 179–186 (1986). [DOI] [PubMed] [Google Scholar]
- 51.Antonello ZA, Reiff T, Ballesta‐Illan E & Dominguez M Robust intestinal homeostasis relies on cellular plasticity in enteroblasts mediated by miR‐8–Escargot switch. EMBO J 34, 2025–2041 (2015). [DOI] [PMC free article] [PubMed] [Google Scholar]
- 52.Chen J, Xu N, Huang H, Cai T & Xi R A feedback amplification loop between stem cells and their progeny promotes tissue regeneration and tumorigenesis. eLife 5, e14330 (2016). [DOI] [PMC free article] [PubMed] [Google Scholar]
- 53.Villa SER, Meng FW & Biteau B Zfh2 controls progenitor cell activation and differentiation in the adult Drosophila intestinal absorptive lineage. PLoS Genet 15, e1008553 (2019). [DOI] [PMC free article] [PubMed] [Google Scholar]
- 54.Kiehart DP, Galbraith CG, Edwards KA, Rickoll WL & Montague RA Multiple forces contribute to cell sheet morphogenesis for dorsal closure in Drosophila. J. Cell Biol 149, 471–490 (2000). [DOI] [PMC free article] [PubMed] [Google Scholar]
- 55.Jin Z et al. The Drosophila ortholog of mammalian transcription factor sox9 regulates intestinal homeostasis and regeneration at an appropriate level. Cell Rep 31, 107683 (2020). [DOI] [PubMed] [Google Scholar]
- 56.Meng FW & Biteau B A Sox transcription factor is a critical regulator of adult stem cell proliferation in the Drosophila intestine. Cell Rep 13, 906–914 (2015). [DOI] [PubMed] [Google Scholar]
- 57.Meng FW, Villa SER & Biteau B Sox100B regulates progenitor-specific gene expression and cell differentiation in the adult Drosophila intestine. Stem Cell Rep 14, 226–240 (2020). [DOI] [PMC free article] [PubMed] [Google Scholar]
- 58.Zhai Z et al. Accumulation of differentiating intestinal stem cell progenies drives tumorigenesis. Nat. Commun 6, 10219 (2015). [DOI] [PMC free article] [PubMed] [Google Scholar]
- 59.McGuire SE, Le PT, Osborn AJ, Matsumoto K & Davis RL Spatiotemporal rescue of memory dysfunction in Drosophila. Science 302, 1765–1768 (2003). [DOI] [PubMed] [Google Scholar]
- 60.Zhai Z, Boquete J-P & Lemaitre B A genetic framework controlling the differentiation of intestinal stem cells during regeneration in Drosophila. PLoS Genet 13, e1006854 (2017). [DOI] [PMC free article] [PubMed] [Google Scholar]
- 61.Baumann O Posterior midgut epithelial cells differ in their organization of the membrane skeleton from other Drosophila epithelia. Exp. Cell. Res 270, 176–187 (2001). [DOI] [PubMed] [Google Scholar]
- 62.Tepass U & Hartenstein V Epithelium formation in the Drosophila midgut depends on the interaction of endoderm and mesoderm. Development 120, 579–590 (1994). [DOI] [PubMed] [Google Scholar]
- 63.Tepass U & Hartenstein V The development of cellular junctions in the Drosophila embryo. Dev. Biol 161, 563–596 (1994). [DOI] [PubMed] [Google Scholar]
- 64.Jin Y et al. Intestinal stem cell pool regulation in Drosophila. Stem Cell Rep 8, 1479–1487 (2017). [DOI] [PMC free article] [PubMed] [Google Scholar]
- 65.Amcheslavsky A, Ito N, Jiang J & Ip YT Tuberous sclerosis complex and myc coordinate the growth and division of Drosophila intestinal stem cells. J. Cell Biol 193, 695–710 (2011). [DOI] [PMC free article] [PubMed] [Google Scholar]
- 66.Kapuria S, Karpac J, Biteau B, Hwangbo D & Jasper H Notch-mediated suppression of TSC2 expression regulates cell differentiation in the drosophila intestinal stem cell lineage. PLoS Genet 8, e1003045 (2012). [DOI] [PMC free article] [PubMed] [Google Scholar]
- 67.Nie Y et al. Bunched and madm function downstream of tuberous sclerosis complex to regulate the growth of intestinal stem cells in Drosophila. Stem Cell Rev. Rep 11, 813–825 (2015). [DOI] [PMC free article] [PubMed] [Google Scholar]
- 68.Quan Z, Sun P, Lin G & Xi R TSC1/2 regulates intestinal stem cell maintenance and lineage differentiation through Rheb–TORC1–S6K but independently of nutritional status or Notch regulation. J. Cell Sci 126, 3884–3892 (2013). [DOI] [PubMed] [Google Scholar]
- 69.Gilbert T & Rodriguez-Boulan E Induction of vacuolar apical compartments in the Caco-2 intestinal epithelial cell line. J. Cell Sci 100, 451–458 (1991). [DOI] [PubMed] [Google Scholar]
- 70.Taniguchi K et al. An apicosome initiates self-organizing morphogenesis of human pluripotent stem cells. J. Cell Biol 216, 3981–3990 (2017). [DOI] [PMC free article] [PubMed] [Google Scholar]
- 71.Vega-Salas DE Exocytosis of vacuolar apical compartment (VAC): a cell–cell contact controlled mechanism for the establishment of the apical plasma membrane domain in epithelial cells. J. Cell Biol 107, 1717–1728 (1988). [DOI] [PMC free article] [PubMed] [Google Scholar]
- 72.Blasky AJ, Mangan A & Prekeris R Polarized protein transport and lumen formation during epithelial tissue morphogenesis. Annu. Rev. Cell Dev. Biol 31, 575–591 (2015). [DOI] [PMC free article] [PubMed] [Google Scholar]
- 73.Datta A, Bryant DM & Mostov KE Molecular regulation of lumen morphogenesis. Curr. Biol 21, R126–R136 (2011). [DOI] [PMC free article] [PubMed] [Google Scholar]
- 74.O’Brien LE, Zegers MMP & Mostov KE Opinion: building epithelial architecture: insights from three-dimensional culture models. Nat. Rev. Mol. Cell Biol 3, 531–537 (2002). [DOI] [PubMed] [Google Scholar]
- 75.Lowery LA, Rienzo GD, Gutzman JH & Sive H Characterization and classification of zebrafish brain morphology mutants. Anat. Rec 292, 94–106 (2009). [DOI] [PMC free article] [PubMed] [Google Scholar]
- 76.Wang X et al. A luminal epithelial stem cell that is a cell of origin for prostate cancer. Nature 461, 495–500 (2009). [DOI] [PMC free article] [PubMed] [Google Scholar]
- 77.Chen J & St Johnston D De novo apical domain formation inside the Drosophila adult midgut epithelium. eLife 11, e76366 (2022). [DOI] [PMC free article] [PubMed] [Google Scholar]
- 78.Reiff T et al. Notch and EGFR regulate apoptosis in progenitor cells to ensure gut homeostasis in Drosophila. EMBO J 38, e101346 (2019). [DOI] [PMC free article] [PubMed] [Google Scholar]
- 79.Endo Y & Nishiitsutsuji-Uwo J Fine structure of developing endocrine cells and columnar cells in cockroach midgut. Biomed. Res 3, 637–644 (1982). [Google Scholar]
- 80.Hu X et al. Discovery of midgut genes for the RNA interference control of corn rootworm. Sci. Rep 6, 30542 (2016). [DOI] [PMC free article] [PubMed] [Google Scholar]
- 81.Rost-Roszkowska MM, Kszuk-Jendrysik M, Marchewka A & Poprawa I Fine structure of the midgut epithelium in the millipede Telodeinopus aoutii (Myriapoda, Diplopoda) with special emphasis on epithelial regeneration. Protoplasma 255, 43–55 (2018). [DOI] [PubMed] [Google Scholar]
- 82.Caccia S, Casartelli M & Tettamanti G The amazing complexity of insect midgut cells: types, peculiarities, and functions. Cell Tissue Res 377, 505–525 (2019). [DOI] [PubMed] [Google Scholar]
- 83.Hagiwara H, Ohwada N & Fujimoto T Intracytoplasmic lumina in human oviduct epithelium. Ultrastruct. Pathol 21, 163–172 (1997). [DOI] [PubMed] [Google Scholar]
- 84.Boysen M & Reith A Intracytoplasmic lumina with and without cilia in both normal and pathologically altered nasal mucosa. Ultrastruct. Pathol 1, 477–485 (1980). [DOI] [PubMed] [Google Scholar]
- 85.Colony PC & Neutra MR Epithelial differentiation in the fetal rat colon: I. Plasma membrane phosphatase activities. Dev. Biol 97, 349–363 (1983). [DOI] [PubMed] [Google Scholar]
- 86.Trier JS & Moxey PC in Ciba Foundation Symposium 70—Development of Mammalian Absorptive Processes (eds Elliott K & Whelan J) 3–29 (John Wiley & Sons, 1979). [Google Scholar]
- 87.DeMaio L et al. Characterization of mouse alveolar epithelial cell monolayers. Am. J. Physiol. Lung Cell. Mol. Physiol 296, L1051–L1058 (2009). [DOI] [PMC free article] [PubMed] [Google Scholar]
- 88.Fleming ES et al. Planar spindle orientation and asymmetric cytokinesis in the mouse small intestine. J. Histochem. Cytochem 55, 1173–1180 (2007). [DOI] [PMC free article] [PubMed] [Google Scholar]
- 89.McKinley KL et al. Cellular aspect ratio and cell division mechanics underlie the patterning of cell progeny in diverse mammalian epithelia. eLife 7, e36739 (2018). [DOI] [PMC free article] [PubMed] [Google Scholar]
- 90.O’Brien LE, Soliman SS, Li X & Bilder D Altered modes of stem cell division drive adaptive intestinal growth. Cell 147, 603–614 (2011). [DOI] [PMC free article] [PubMed] [Google Scholar]
- 91.Bobinnec Y, Marcaillou C, Morin X & Debec A Dynamics of the endoplasmic reticulum during early development of Drosophila melanogaster. Cell Motil 54, 217–225 (2003). [DOI] [PubMed] [Google Scholar]
- 92.Buchon N et al. Morphological and molecular characterization of adult midgut compartmentalization in Drosophila. Cell Rep 3, 1725–1738 (2013). [DOI] [PubMed] [Google Scholar]
- 93.Zhu M et al. MISP is a novel Plk1 substrate required for proper spindle orientation and mitotic progression. J. Cell Biol 200, 773–787 (2013). [DOI] [PMC free article] [PubMed] [Google Scholar]
- 94.Morales EA, Arnaiz C, Krystofiak ES, Zanic M & Tyska MJ Mitotic Spindle Positioning (MISP) is an actin bundler that selectively stabilizes the rootlets of epithelial microvilli. Cell Rep 39, 110692 (2022). [DOI] [PMC free article] [PubMed] [Google Scholar]
- 95.Kolotuev I, Schwab Y & Labouesse M A precise and rapid mapping protocol for correlative light and electron microscopy of small invertebrate organisms. Biol. Cell 102, 121–132 (2010). [DOI] [PubMed] [Google Scholar]
- 96.Daniel E et al. Coordination of septate junctions assembly and completion of cytokinesis in proliferative epithelial tissues. Curr. Biol 28, 1380–1391.e4 (2018). [DOI] [PubMed] [Google Scholar]
- 97.Kolotuev I & Micheva KD in Correlative Imaging (eds Verkade P & Collinson L) 81–98 (John Wiley & Sons, Ltd., 2019). [Google Scholar]
- 98.Kizilyaprak C, Longo G, Daraspe J & Humbel BM Investigation of resins suitable for the preparation of biological sample for 3-D electron microscopy. J. Struct. Biol 189, 135–146 (2015). [DOI] [PubMed] [Google Scholar]
- 99.Kremer JR, Mastronarde DN & McIntosh JR Computer visualization of three-dimensional image data using IMOD. J. Struct. Biol 116, 71–76 (1996). [DOI] [PubMed] [Google Scholar]
Associated Data
This section collects any data citations, data availability statements, or supplementary materials included in this article.
Supplementary Materials
Data Availability Statement
EM data are available through EMBL-EBI BioStudies under accession number S-BSST946. Source data are provided with this paper. All other data are available from the corresponding author on reasonable request.


