Abstract
New ideas for diagnostics in clinical parasitology are needed to overcome some of the difficulties experienced in the widespread adoption of detection methods for gastrointestinal parasites in livestock. Here we provide an initial evaluation of the performance of a newly developed automated device (Telenostic) to identify and quantify parasitic elements in fecal samples. This study compared the Telenostic device with the McMaster and Mini-FLOTAC for counting of strongyle eggs in a fecal sample. Three bovine fecal samples were examined, in triplicate, on each of the three fecal egg-counting devices. In addition, both manual (laboratory technician) and automated analysis (image analysis algorithm) were performed on the Telenostic device to calculate fecal egg counts (FEC). Overall, there were consistent egg counts reported across the three devices and calculation methods. The Telenostic device compared very favourably to the Mini-FLOTAC and McMaster. Only in sample C, a significant difference (P < 0.05) was observed between the egg counts obtained by Mini-FLOTAC and by the other methods. From this limited dataset it can be concluded that the Telenostic-automated test is comparable to currently used benchmark FEC methods, while improving the workflow, test turn-around time and not requiring trained laboratory personnel to operate or interpret the results.
Key words: Automation, cattle, McMaster, Mini-FLOTAC, quantitative diagnostic techniques, strongyle eggs, Telenostic device
Introduction
Grazing ruminants are exposed to a number of gastrointestinal parasites (GIP). Depending on the age and immune status of the host, and on the parasite species involved, infection can lead to losses in productivity (reduced weight gain) or even clinical disease (Charlier et al., 2014b).
For this reason, farmers routinely treat their animals with anthelmintic drugs as a primary means of controlling these parasites. However, this widespread, indiscriminate use of anthelmintics has resulted in the development of anthelmintic resistance of nematode populations in many herds/flocks (Kaplan, 2004; Rose et al., 2015). There is therefore a clear need to use anthelmintic drugs much more conservatively, only when really necessary to maintain adequate levels of parasites in refugia. This has led several European Union countries to implement prescription-only legislation for anthelmintic drugs, to ensure veterinary involvement in the decision to treat and to encourage parasite diagnostics and surveillance using fecal egg counts (FECs). This follows a recent European Union (EU) directive (https://eur-lex.europa.eu/eli/reg/2019/6/oj). Many control approaches therefore focus on the use of targeted selected or targeted treatment of animals (Kenyon and Jackson, 2012; Charlier et al., 2014a).
These approaches clearly should rely on the availability of accurate diagnostic tests for assessing infection levels in both individuals and herds. Non-invasive tools, such as the examination of feces for the detection of parasite elements, are most commonly used to investigate the patterns of infection with GIP. In this way the relative abundance of the GIP can be estimated in individual hosts. These data can then be used to guide appropriate management decisions on helminth control (Kaplan, 2020).
A range of techniques and their modifications have been described in the literature; for example, the McMaster (MAFF, 1986), Stoll egg counting (Stoll, 1930), FLOTAC (Cringoli et al., 2010) and Mini-FLOTAC (Cringoli et al., 2017). All these techniques are based on the principle of floating the parasite elements on a solution of specific gravity greater than that of the parasite elements (Sawitz, 1942). These techniques differ in their sensitivities, the times required to process a sample and the technical knowledge required for their interpretation. Because of the cost, labour intensity, equipment needed and the inherit variability in egg counts (Cringoli et al., 2004; Rinaldi et al., 2011; Levecke et al., 2012) historically FEC has been underutilized as a monitoring tool in animal parasite control.
To overcome some of the drawback of the traditional assays, new technologies have been developed in recent years for more automated procedures for identifying and counting parasite eggs, thereby reducing the operator-dependency of manual counts (Yang et al., 2001; Castañón et al., 2007; Mes et al., 2007; Dogantekin et al., 2008; Ghazali et al., 2013; Suzuki et al., 2013). These procedures, to some extent, still rely on a microscope and computer to capture and process sample images.
In this study, we compare two commonly used fecal egg counting techniques (the McMaster and Mini-FLOTAC) with a novel Telenostic device, to detect and count gastrointestinal nematode eggs in bovine fecal samples. The Telenostic device is a prototype-automated digital microscope with a 10× lens. It is used in conjunction with a custom Telenostic cassette with a circular channel of approximately 2 mL capacity. It uses automated focusing methods to acquire multiple images along the channel at the optimum focal point. These images are stored and made available for both manual and automated analysis of FECs. For the automated analysis an algorithm has been developed where the images are evaluated to identify and count strongyle eggs (https://arxiv.org/abs/1804.02767).
Materials and methods
Sample preparation
Three fecal samples (approximately 100 g) were collected from cattle naturally infected with trichostrongyle parasites. The fecal samples were then fixed using a 10% formalin solution and stored at 4°C until used for this study. Each fecal sample was well homogenized and then divided to three subsamples (10 g each). From each subsample, after thorough homogenization, 3 g were taken and blended in 42 mL of saturated sodium chloride solution (specific gravity = 1.200). The suspension was first poured through a tea-strainer and then through a wire mesh filter (Endecott, UK; aperture 212 μm) to remove any remaining large debris. The filtered suspension was stirred and then divided into three aliquots to provide three replicates for each of the three FEC devices: McMaster (Vetlab Supplies, UK), Mini-FLOTAC (University of Naples Federico II, Italy) and Telenostic (Telenostic Limited, Ireland).
Test procedure
For the McMaster, 0.5 mL of slurry was loaded into each chamber of a McMaster slide and left to settle for 10 min. Strongyle eggs were then counted at 100× magnification (Olympus BX40F4, Mason Technology) in both grids with a sensitivity of 50 eggs per g (epg) (MAFF, 1986).
For the Mini-FLOTAC, 1 mL of the slurry was loaded into each of the chambers of a Mini-FLOTAC device and the slide was left to settle for 10 min. Strongyle eggs were then counted at 100× magnification (Olympus BX40F4, Mason Technology) in both grids with a sensitivity of 7.5 epg (Cringoli et al., 2017).
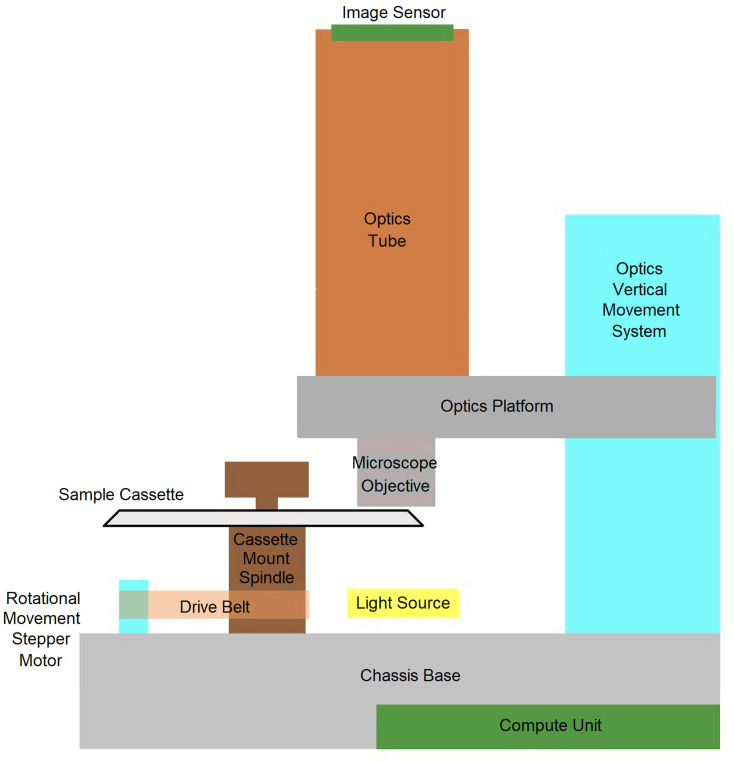
The Telenostic Digital Microscopy Device (beta1), is an automated image capturing device with a 10× lens, a single use cassette designed to hold the slurry sample for acquiring the images (Fig. 1) and a cloud platform that allows for the automated recognition and counting of strongyle eggs (https://patentscope.wipo.int/search/en/detail.jsf?docId=WO2018206802).
Fig. 1.
Schematic representation of various components of the Telenostic device.
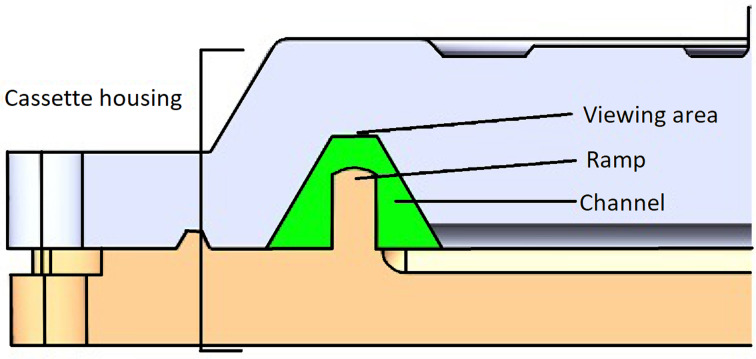
The Telenostic cassette (v1.3) is transparent, round, approximately 100 mm in diameter, with a circular enclosed sample channel with a volume of 2 mL. The channel is trapezoidal in shape with 60° side walls and a ramp in the middle that creates two sumps left and right of the viewing area (Fig. 2) concentrating the area to be viewed by 800%. The width of the channel (0.72 mm) is equivalent of one field of view of the objective lens of the device.
Fig. 2.
Cross-section through the Telenostic cassette showing the trapezoid shaped (green) channel with a ramp in the middle.
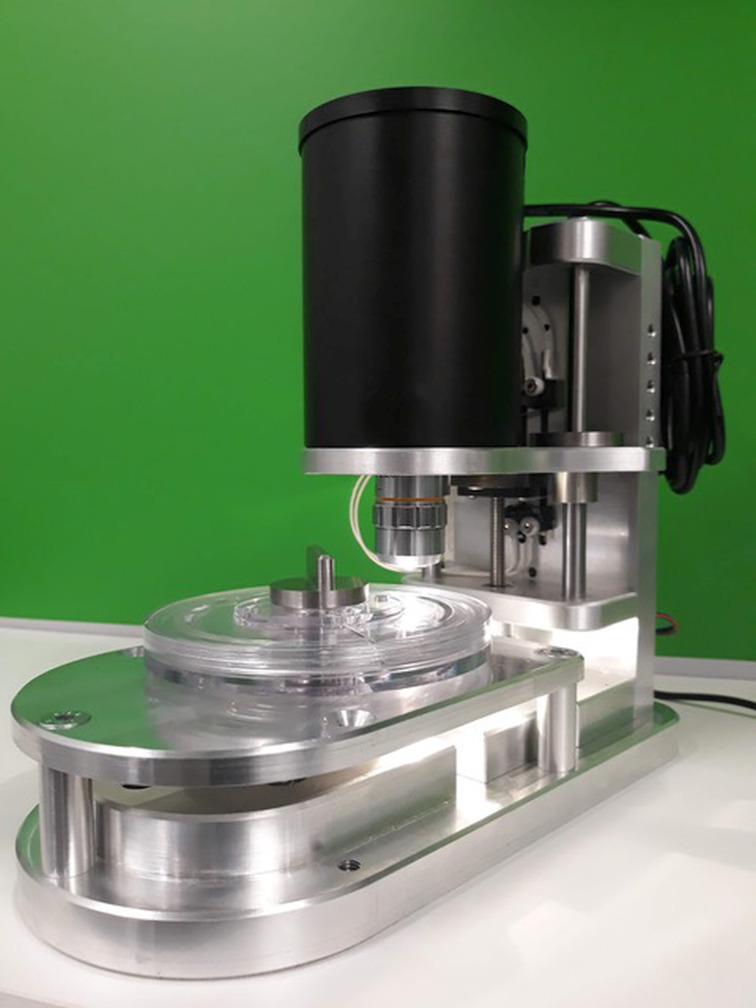
Two mL of the fecal slurry was loaded into the channel through the filling hole using a 5 mL syringe. The cassette was then secured to the device and the test initiated (Fig. 3). The entire surface of the channel was then scanned by stepwise slowly rotating the cassette through 360°. The Telenostic device uses an automated focusing method and acquires multiple images (n = 340) along the channel of the cassette at the optimum focal point. The images are transmitted to a cloud server. The quality of each image was then checked (for air bubbles, focus and duplication) before being analysed for the presence of strongyle eggs, using both manual (by a qualified laboratory technician) and automated analysis (analysed by using a pre-trained, image-analysis algorithm; https://arxiv.org/abs/1804.02767). The analytical sensitivity of the Telenostic device was calculated using the details listed in Table 1.
Fig. 3.
Telenostic prototype device (beta1) with the cassette fixed in place.
Table 1.
Specification of the cassette of Telenostic device
| Variable | Value |
|---|---|
| Channel cross-section area | 7.83 mm2 |
| Field of view (FOV) | 0.72 mm |
| Volume per image (FOV) | 5.6376 mm3 = 0.0056376 mL |
| No. of images (n) | 340 |
| Filtrate concentration | 3 g/45 mL = 0.06667 g/mL |
| Multiplication factor | 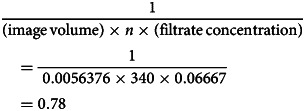 |
Statistical analysis
All analyses were conducted using the computation environment R (v3.6.1). The corrected egg counts measured using the four methods on three different feces samples (A, B and C) were analysed using a generalized linear model (GLM) with negative binomial distribution that was built using the glm.nb() function in the MASS R package (v7.3.51.4). All code is freely available online at https://github.com/JosephCrispell/GeneralTools/blob/master/TelenosticDevice_ExaminingEggCounts_11-10-19.R. The differences were considered significant when P < 0.05.
Results
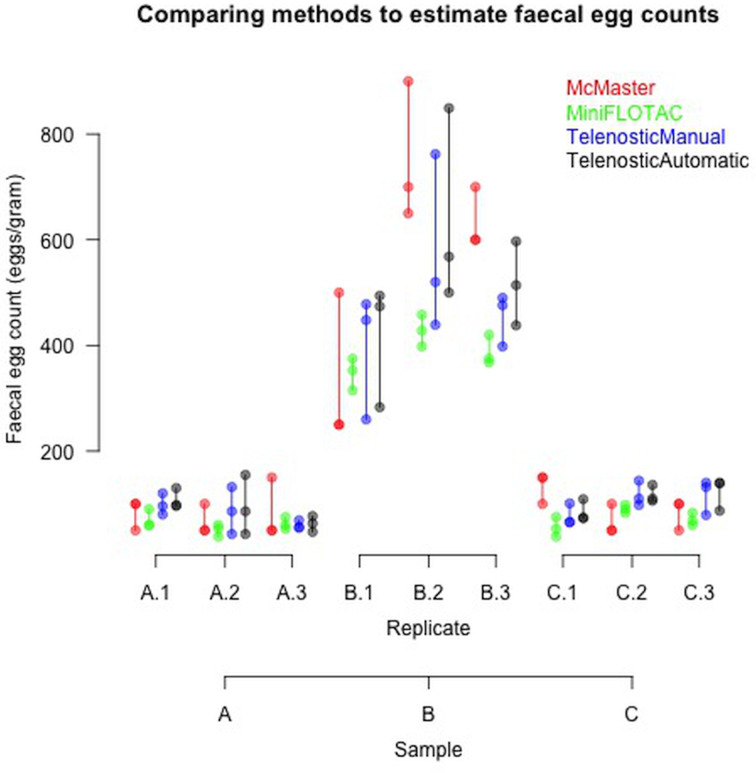
Three fecal samples with three replicates each were examined and the FEC results from the three devices are summarized in Fig. 4 (Supplementary data Table S1). Samples A and C had similar low (<100 epg) FEC, while sample B had a much higher FEC (>500 epg).
Fig. 4.
Comparison of the FEC of three bovine fecal samples (A, B and C), using three different devices (McMaster, Mini-FLOTAC and Telenostic). For the Telenostic device FEC was calculated using both a manual and automated method. Each replicate was repeated three times.
The outputs from the GLM comparing the three different devices are presented in Table 2. In sample A there were no significant differences between methods (Table 2). The greatest variability was observed in sample B, with significant differences (P< 0.05) observed. As shown in Fig. 4, these differences reflect the higher egg count values reported using the McMaster and the generally lower counts reported for sample A. In sample C, a significant difference (P < 0.05) was observed between the egg counts reported by the Mini-FLOTAC method and the other methods. Overall, there were consistent egg counts reported across the three devices, though larger variations were observed in the higher egg counts associated with sample B (Table 2).
Table 2.
GLM comparing the FEC between the three devices, McMaster, Mini-FLOTAC and Telenostic and the two methods (manual and automatic) of determining FEC in the Telenostic device
| Term | Estimate | s.e. | Statistic | P value | |
|---|---|---|---|---|---|
| Sample A | (Intercept) | 4.514282 | 0.136416 | 33.09195 | <0.001 |
| Method-MiniFLOTAC | −0.24846 | 0.159377 | −1.55895 | 0.119 | |
| Method-TelenosticAutomatic | 0.109316 | 0.157639 | 0.693461 | 0.488 | |
| Method-TelenosticManual | 0.035332 | 0.157951 | 0.223691 | 0.823 | |
| Replicate A.2 | −0.195 | 0.136715 | −1.42635 | 0.154 | |
| Replicate A.3 | −0.27706 | 0.137072 | −2.02131 | 0.043 | |
| Sample B | (Intercept) | 6.07003 | 0.085825 | 70.72566 | <0.001 |
| Method-MiniFLOTAC | −0.34821 | 0.099147 | −3.51206 | <0.001 | |
| Method-TelenosticAutomatic | −0.06224 | 0.098782 | −0.63004 | 0.529 | |
| Method-TelenosticManual | −0.15747 | 0.098892 | −1.59237 | 0.111 | |
| Replicate B.2 | 0.447947 | 0.085832 | 5.218895 | <0.001 | |
| Replicate B.3 | 0.268887 | 0.085995 | 3.126778 | 0.002 | |
| Sample C | (Intercept) | 4.488078 | 0.121995 | 36.78912 | <0.001 |
| Method-MiniFLOTAC | −0.29351 | 0.141846 | −2.06922 | 0.039 | |
| Method-TelenosticAutomatic | 0.115006 | 0.139995 | 0.821503 | 0.411 | |
| Method-TelenosticManual | 0.072569 | 0.140155 | 0.517773 | 0.605 | |
| Replicate C.2 | 0.119264 | 0.122013 | 0.977475 | 0.328 | |
| Replicate C.3 | 0.106008 | 0.12206 | 0.868492 | 0.385 |
No significant differences were observed between the automated and manual estimation of FEC with the Telenostic device, with high levels of agreement. The machine learning is achieving an average of 1.7% for false negatives and approximately 10% for false positives.
Discussion
GIP in grazing livestock tends to be overdispersed, with a few animals in the herd carrying the majority of the parasites. This is most likely a function of the differences both in the grazing behaviour of the hosts as well as in the ability of the parasites to become established and to survive in the hosts. FEC, therefore, should be an essential and integral part of every livestock management system, as one of the decision tools to identify if and when anthelmintic treatments should be applied, and to monitor the efficacy of such treatment. However, the currently used diagnostics tests have some limitations: they require technical expertise to identify parasite eggs; therefore they cannot be done on site and the transport of samples to a centralized laboratory makes the test time consuming and relatively expensive. For these reasons, livestock owners often choose not to test their animals before treatment, a practice which has resulted in the widespread appearance of anthelmintic resistance on many farms (Rose et al., 2015). It is evident that we need new approaches for diagnostics in clinical parasitology.
To overcome some of these difficulties, we have developed an automated device (Telenostic) to identify and quantify parasite elements in a fecal sample. This study compared the performance between the newly developed Telenostic device with the McMaster and Mini-FLOTAC for the counting of strongyle eggs within a fecal sample. Telenostic device compared very favourably to the FEC results from Mini-FLOTAC. In the case of sample B the variability in FEC between aliquots and sub-samples seems to be more pronounced. This can be explained by the fact that nematode eggs are randomly distributed within a fecal sample and will conform to a Poisson process and thus repeat calculations of eggs per gram from the same fecal sample will be subject to Poisson errors (Torgerson et al., 2012).
For critical tests such as the FECRT (measuring drug efficacy) the detection sensitivity (i.e. the lowest FEC that can be measured using the method) is important (Levecke et al., 2018). Levecke et al. (2011) undertook a study comparing variations of the McMaster technique and the FLOTAC technique and showed that precision increases when analytical sensitivity increases. Generally, it is recommended that the technique used should have a low ‘multiplication factor’ to improve the diagnostic sensitivity in order that animals with zero EPG be better identified, and to improve the selection of animals for targeted selected treatments. In this respect the Telenostic system has a detection sensitivity similar to the Mini-FLOTAC (approximately 7.8 epg).
In efforts to overcome the dependency on having an experienced operator to examine slides, several studies have employed image analysis tools to diagnose parasite elements in fecal samples (Sommer, 1996, 1998; Daugschies et al., 1999; Joachim et al., 1999). Automated tools that rely on pattern recognition may significantly enhance egg identification by facilitating reliable identification. In the Telenostic system, automated image analysis has been developed to analyse and recognize parasite elements within a sample using pre-trained image analysis algorithms (https://arxiv.org/abs/1804.02767). This study showed that there are no significant differences between the automated and manual systems of FEC, with a high level of agreement. The machine learning is achieving an average of 1.7% for false negatives and approximately 10% for false positives. The machine learning system was based on a ‘off the shelf’ model architecture and trained using a minimal set of images (approximately 1000 sample images). As the dataset increases and adjustments are made to the weighting of parameters, the false positive rate will also decrease.
The goal of this study was the development of an automated examination system to identify and quantify parasite elements within a fecal sample. The results confirm that the Telenostic-automated test is comparable to currently used benchmark FEC methods in providing accurate and repeatable egg counts. The Telenostic device takes about 30 min to automatically acquire the set of 340 images from the 2 mL sample and approximately 12 min to analyse these which is done in parallel while capturing the images. The system has also been designed to remove any necessity for trained staff or a centralized laboratory and only requires some basic steps to operate. This will allow the use of the device in remote settings, where the samples are collected, with results being available within a short time thereby reducing the total time-to-result and will deliver consistency of result capture regardless of device operator. Further development is ongoing in validating the Telenostic device for counting and identification of a variety of parasite elements in other animal species including oocysts of coccidia.
Acknowledgements
We would like to acknowledge Marta Capolei and Amanda Lawlor for their technical assistance and useful discussions.
Financial support
This study was supported in part by Enterprise Ireland, Innovation Partnership Programme (grant number IP 2015 0370) co-funded by the European Regional Development Fund under Ireland's European Structural and Investment Funds Programmes 2014–2020.
Ethical standards
Not applicable.
Supplementary material
For supplementary material accompanying this paper visit https://doi.org/10.1017/S0031182020001031.
click here to view supplementary material
Conflict of interest
RE, MK, VL, TM, WO'C, DS and TdW are all patent holders for the Telenostic device and NE, TM and EP are employees of the company (Telenostic Limited) that is commercializing the device. The other authors have no conflict of interest to declare.
References
- Castañón CAB, Fraga JS, Fernandez S, Gruber A and Costa L da F (2007) Biological shape characterization for automatic image recognition and diagnosis of protozoan parasites of the genus Eimeria. Pattern Recognition 40, 1899–1910. [Google Scholar]
- Charlier J, Morgan ER, Rinaldi L, van Dijk J, Demeler J, Hoglund J, Hertzberg H, Van Ranst B, Hendrickx G, Vercruysse J and Kenyon F (2014a) Practices to optimise gastrointestinal nematode control on sheep, goat and cattle farms in Europe using targeted (selective) treatments. Veterinary Record 175, 250–255. [DOI] [PubMed] [Google Scholar]
- Charlier J, Voort M, Kenyon F, Skuce P and Vercruysse J (2014b) Chasing helminths and their economic impact on farmed ruminants. Trends in Parasitology 30, 361–367. [DOI] [PubMed] [Google Scholar]
- Cringoli G, Rinaldi L, Veneziano V, Capelli G and Scala A (2004) The influence of flotation solution, sample dilution and the choice of McMaster slide area (volume) on the reliability of the McMaster technique in estimating the faecal egg counts of gastrointestinal strongyles and Dicrocoelium dendriticum in sheep. Veterinary Parasitology 123, 121–131. [DOI] [PubMed] [Google Scholar]
- Cringoli G, Rinaldi L, Maurelli MP and Utzinger J (2010) FLOTAC: new multivalent techniques for qualitative and quantitative copromicroscopic diagnosis of parasites in animals and humans. Nature Protocols 5, 503–515. [DOI] [PubMed] [Google Scholar]
- Cringoli G, Maurelli MP, Levecke B, Bosco A, Vercruysse J, Utzinger J and Rinaldi L (2017) The Mini-FLOTAC technique for the diagnosis of helminth and protozoan infections in humans and animals. Nature Protocols 12, 1723. [DOI] [PubMed] [Google Scholar]
- Daugschies A, Imarom S and Bollwahn W (1999) Differentiation of porcine Eimeria spp. by morphologic algorithms. Veterinary Parasitology 81, 201–210. [DOI] [PubMed] [Google Scholar]
- Dogantekin E, Yilmaz M, Dogantekin A, Avci E and Sengur A (2008) A robust technique based on invariant moments – ANFIS for recognition of human parasite eggs in microscopic images. Expert Systems with Applications 35, 728–738. [Google Scholar]
- Ghazali KH, Hadi RS and Mohamed Z (2013) Automated system for diagnosis intestinal parasites by computerized image analysis. Modern Applied Science 7, 98–114. [Google Scholar]
- Joachim A, Dulmer N and Daugschies A (1999) Differentiation of two Oesophagostomum spp. from pigs, O. dentatum and O. quadrispinulatum, by computer-assisted image analysis of fourth-stage larvae. Parasitology International 48, 63–71. [DOI] [PubMed] [Google Scholar]
- Kaplan RM (2004) Drug resistance in nematodes of veterinary importance: a status report. Trends in Parasitology 20, 477–481. [DOI] [PubMed] [Google Scholar]
- Kaplan RM (2020) Biology, epidemiology, diagnosis, and management of anthelmintic resistance in gastrointestinal nematodes of livestock. Veterinary Clinics of North America: Food Animal Practice 36, 17–30. [DOI] [PubMed] [Google Scholar]
- Kenyon F and Jackson F (2012) Targeted flock/herd and individual ruminant treatment approaches. Veterinary Parasitology 186, 10–17. [DOI] [PubMed] [Google Scholar]
- Levecke B, Rinaldi L, Charlier J, Maurelli MP, Morgoglione ME, Vercruysse J and Cringoli G (2011) Monitoring drug efficacy against gastrointestinal nematodes when faecal egg counts are low: do the analytic sensitivity and the formula matter? Parasitology Research 109, 953–957. [DOI] [PubMed] [Google Scholar]
- Levecke B, Rinaldi L, Charlier J, Maurelli MP, Bosco A, Vercruysse J and Cringoli G (2012) The bias, accuracy and precision of faecal egg count reduction test results in cattle using McMaster, Cornell-Wisconsin and FLOTAC egg counting methods. Veterinary Parasitology, 188, 194–199. [DOI] [PubMed] [Google Scholar]
- Levecke B, Kaplan RM, Thamsborg SM, Torgerson PR, Vercruysse, J. and Dobson RJ (2018) How to improve the standardization and the diagnostic performance of the fecal egg count reduction test? Veterinary Parasitology 253, 71–78. [DOI] [PubMed] [Google Scholar]
- MAFF (1986) Manual of Veterinary Parasitology Laboratory Techniques. Reference Book 418, 3rd Edn. London: Her Majesty's Stationary Office. [Google Scholar]
- Mes TH, Eysker M and Ploeger HW (2007) A simple, robust and semi-automated parasite egg isolation protocol. Nature Protocols 2, 486–489. [DOI] [PubMed] [Google Scholar]
- Rinaldi L, Coles GC, Maurelli MP, Musella V and Cringoli G (2011) Calibration and diagnostic accuracy of simple flotation, McMaster and FLOTAC for parasite egg counts in sheep. Veterinary Parasitology 177, 345–352. [DOI] [PubMed] [Google Scholar]
- Rose H, Rinaldi L, Bosco A, Mavrot F, de Waal T, Skuce P, Charlier J, Torgerson PR, Hertzberg H, Hendrickx G, Vercruysse J and Morgan ER (2015) Widespread anthelmintic resistance in European farmed ruminants: a systematic review. Veterinary Record 176, 546. [DOI] [PubMed] [Google Scholar]
- Sawitz W (1942) The buoyancy of certain nematode eggs. The Journal of Parasitology 28, 95–102. [Google Scholar]
- Sommer C (1996) Digital image analysis and identification of eggs from bovine parasitic nematodes. Journal of Helminthology 70, 143–151. [DOI] [PubMed] [Google Scholar]
- Sommer C (1998) Quantitative characterization of texture used for identification of eggs of bovine parasitic nematodes. Journal of Helminthology 72, 179–182. [DOI] [PubMed] [Google Scholar]
- Stoll NR (1930) On methods of counting nematode ova in sheep dung. Parasitology 22, 116–136. [Google Scholar]
- Suzuki CT, Gomes JF, Falcao AX, Papa JP and Hoshino-Shimizu S (2013) Automatic segmentation and classification of human intestinal parasites from microscopy images. IEEE Transactions on Biomedical Engineering 60, 803–812. [DOI] [PubMed] [Google Scholar]
- Torgerson PR, Paul M and Lewis FI (2012) The contribution of simple random sampling to observed variations in faecal egg counts. Veterinary Parasitology 188, 397–401. [DOI] [PubMed] [Google Scholar]
- Yang YS, Park DK, Kim HC, Choi MH and Chai JY (2001) Automatic identification of human helminth eggs on microscopic fecal specimens using digital image processing and an artificial neural network. IEEE Transactions on Biomedical Engineering 48, 718–730. [DOI] [PubMed] [Google Scholar]
Associated Data
This section collects any data citations, data availability statements, or supplementary materials included in this article.
Supplementary Materials
For supplementary material accompanying this paper visit https://doi.org/10.1017/S0031182020001031.
click here to view supplementary material


