Abstract
Background and aims
Non-alcoholic fatty liver disease (NAFLD) is closely associated with gut microbiota and has become the most common chronic liver disease worldwide, but the relationship between specific strains and NAFLD has not been fully elucidated. We aimed to investigate whether Akkermansia muciniphila and Bifidobacterium bifidum could prevent NAFLD, the effects of their action alone or in combination, possible mechanisms, and modulation of the gut microbiota.
Methods
Mice were fed with high-fat diets (HFD) for 20 weeks, in which experimental groups were pretreated with quadruple antibiotics and then given the corresponding bacterial solution or PBS. The expression of the glycolipid metabolism indicators, liver, and intestinal farnesol X receptors (FXR), and intestinal mucosal tight junction proteins were detected. We also analyzed the alterations of inflammatory and immune status and the gut microbiota of mice.
Results
Both strains were able to attenuate mass gain (p<0.001), insulin resistance (p<0.001), and liver lipid deposition (p<0.001). They also reduced the levels of the pro-inflammatory factors (p<0.05) and the proportion of Th17 (p<0.001), while elevating the proportion of Treg (p<0.01). Both strains activated hepatic FXR while suppressing intestinal FXR (p<0.05), and elevating tight junction protein expression (p<0.05). We also perceived changes in the gut microbiota and found both strains were able to synergize beneficial microbiota to function.
Conclusions
Administration of A. muciniphila or B. bifidum alone or in combination was protective against HFD-induced NAFLD formation and could be used as alternative treatment strategy for NAFLD after further exploration.
Keywords: Non-alcoholic fatty liver disease, Farnesoid X receptor, Probiotics, Akkermansia muciniphila, Bifidobacterium bifidum
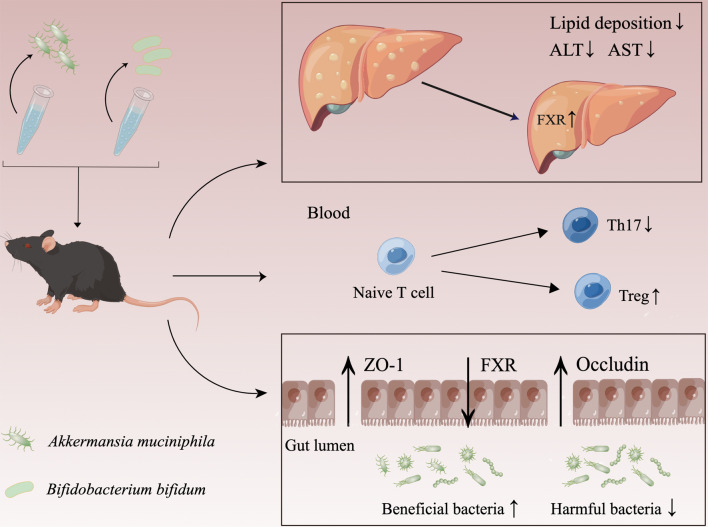
Graphical abstract
Introduction
Non-alcoholic fatty liver disease (NAFLD) is a metabolic stress liver injury closely related to insulin resistance (IR) and genetic susceptibility,1 with histopathological features ranging from simple steatosis to non-alcoholic steatohepatitis (NASH), to advanced fibrosis and liver cirrhosis.2 According to epidemiological data, NAFLD has become the most common liver disease worldwide, and it is also the fastest-growing cause of hepatocellular carcinoma among liver transplant recipients and awaiting transplant candidates in the United States, imposing a heavy burden on society.3,4 The gut microbiota is a pathogenic factor in NAFLD development and is also involved in regulating the pathological process of NAFLD. The gut microbiota interacts with bile acids, an important component of bile that regulates NAFLD and NASH development by binding to the farnesoid X receptor (FXR) of nuclear receptors affects a range of metabolic processes,5 but the role of FXR expression levels of different tissues in glucolipid metabolism disorders is inconclusive and the relationship with specific strains remains to be investigated. The FXR signaling pathway was inhibited in NAFLD patients and NAFLD rats induced by high-fat diets (HFD).6 However, hyocholic acid promoted glucagon-like peptide-1 (GLP-1) secretion and improved glucose homeostasis by inhibiting intestinal FXR expression.7 The intestinal mucosal barrier is the first line of defense against pathogens, of which the mechanical barrier is the most critical, with the structural basis of intact intestinal mucosal epithelial cells and tight junctions between epithelial cells.8 Once the intestinal barrier is disrupted, lipopolysaccharide (LPS), a metabolite of the gut microbiota, enters the liver after intestinal absorption, inducing hepatic oxidative stress, generating metabolism-related products, and facilitating the formation of NAFLD.
Furthermore, immune system imbalance drives NAFLD development. Gut-derived pathogenic microbial products promote Th17 differentiation,9 and excessive activation of Th17 also furthers gut microbiota dysbiosis and inflammatory levels imbalance, leading to hyperglycemia and IR.10 Prospective research found the Th17/Treg ratio was positively correlated with NASH progression and the increased peripheral blood Th17/Treg ratio in NASH patients could be normalized one year after bariatric surgery,11 suggesting Th17/Treg could be a valid indicator to assess NAFLD progression. Treg can directly inhibit the proliferation and function of CD4+T and CD8+T cells and suppress excessive inflammatory responses. Treg-depleted mice were observed with severe steatohepatitis, and transferring Treg successively alleviated liver inflammation and injury,12 suggesting a direct role for Treg in preventing NAFLD progression. Thus, Th17 and Treg are deeply involved in immune system regulation and can reflect the immune status and NAFLD progression.
Akkermansia muciniphila is an anaerobic, mucin-degrading bacteria that function in metabolism, inflammation, and immunity.13 It has been found the HFD-feeding NAFLD mouse model was accompanied by decreased abundance of A. muciniphila.14 In addition, A. muciniphila also promotes the expression of bile acid synthesis and excretion genes in the liver.15 In a randomized double-blind trial in overweight or obese IR volunteers, administration of A. muciniphila for 3 months was found to improve insulin sensitivity and decrease plasma total cholesterol (TC).16 The outer membrane protein, Amuc_100, has also been shown to regulate intestinal permeability through tight junction proteins.17 All of which demonstrates its relevance to NAFLD. Bifidobacterium bifidum is the classic anaerobic probiotic, with a tendency to decline with age. B. bifidum could modulate lipid metabolism and intestinal permeability, and ultimately suppress liver inflammation and fat accumulation.18 It could also target the Toll-like receptor 2 (TLR2) pathway, enhance the intestinal epithelial tight junction barrier, and protect against intestinal inflammation.19 Furthermore, B. bifidum also ameliorated gut microbiota disorders and contributed to an increased abundance of A. muciniphila and Verrucomicrobiota from mice feces.20 Similarly, our previous study also found a decreased abundance of A. muciniphila from NAFLD mice feces. However, due to the complexity of NAFLD, the question of whether these two strains could alleviate NAFLD has not been well investigated. Therefore, by constructing the NAFLD mice model and intragastric administration of A. muciniphila and B. bifidum alone or in combination, we aimed to explore whether both strains could prevent the occurrence of NAFLD and the strength of the effect, the association between both strains, FXR expression in different tissues, and NAFLD, alterations of intestinal mucosal permeability and inflammatory immune status and the changes in the gut microbiota after interventions, to provide experimental evidence for better understanding of the pathogenesis of NAFLD and possible future therapeutic approaches.
Methods
Preparation of bacterial strain
A. muciniphila and B. bifidum were obtained from the Center of Industrial Culture and the BeNa Culture Collection of China, respectively. After resuscitation, A. muciniphila and B. bifidum were cultured in chocolate-colored blood medium and BBL liquid medium respectively. Both strains were incubated at 37°C on the anaerobic table, centrifuged at 4°C for 5 minutes at 18,000×g, and washed twice with sterile phosphate-buffered saline (PBS) to prepare a bacterial solution with a concentration of 109 CFU/ml, which will be used in the next step.
Animal Experiments
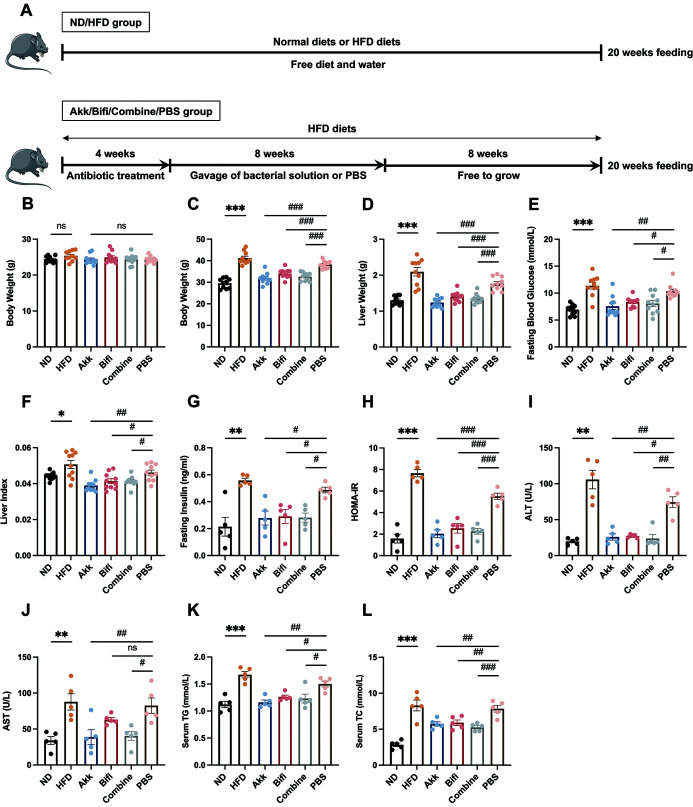
60 SPF male C57BL/6 mice were purchased from Shanghai Slac Laboratory Animal Co., Ltd. The animals were kept at constant temperature and humidity in the SPF animal room, where were allowed food and water freely. After 7 days of adaptive feeding, the animals were divided into 6 groups of 10 mice each. The groups were the ND group (normal diet), HFD group (high-fat diet), Akk group (antibiotic + HFD + A. muciniphila), Bifi group (antibiotic + HFD + B. bifidum), Combine group (antibiotic + HFD + A. muciniphila + B. bifidum) and PBS group (antibiotic + HFD + PBS). HFD is a 40% high-fat experimental feed. The Akk group, Bifi group, Combine group, and PBS group were treated with quadruple antibiotics first to construct a pseudo-sterile model before the administration of the bacterial solution. The specific methods were as follows: Ampicillin Na (Aladdin, A105483, China) 1g/L, Vancomycin HCL (Aladdin, V105495, China) 500mg/L, Neomycin sulfate (Aladdin, N109017, China) 1g/L, Metronidazole (Aladdin, M109874, China) 1g/L (AVNM) were mixed into the daily drinking water and changed every two days for 4 weeks.21,22 After 4 weeks of application, the Akk group, Bifi group, Combine group, and PBS group were started to give intragastric administration of corresponding bacterial solution or PBS at a concentration of 109 CFU/ml and a dose of 0.2ml per mouse each time, 3 times per week for 8 weeks.23,24 In the Combine group, A. muciniphila and B. bifidum bacterial solution were 0.1ml each. All mice were continuously fed for 20 weeks until the NAFLD models were successfully established in the PBS group. The animal procedure schematic diagram can be viewed in Figure 1A. The mice underwent a 12-hour fast and isoflurane anesthesia before organ and blood collection. Blood from five mice in each group was used for serological analysis, and additional blood from the other five mice was used for flow cytometry. All experimental protocols were approved by the Institutional Animal Care and Use Committee of SHRM (Approval No.20210308(22)).
Fig. 1. Effect of administration of A. muciniphila or B. bifidum on glycolipid metabolism indicators.
(A) The animal procedure schematic diagram. (B) The body weight after quadruple antibiotics administration. (C) Final body weight of mice before sacrifice after 20 weeks of HFD feeding. (D) Liver weight. (E) Fasting blood glucose. (F) Calculated liver index. Liver index=liver weight/body weight. (G) Fasting insulin levels. (H) Calculated HOMA-IR. HOMA-IR=fasting blood glucose × fasting insulin /22.5. (I) Serum ALT levels. (J) Serum AST levels. (K) Serum TG levels. (L) Serum TC levels. Data were expressed as mean± SEM. N=10 per group in (B) (C) (D) (E) (F). N=5 per group in (G) (H) (I) (J) (K) (L). *p<0.05, **p<0.01, ***p<0.001 vs. ND group. #p<0.05, ##p<0.01, ###p<0.001 vs. PBS group. ALT, alanine aminotransferase; AST, aspartate aminotransferase; TC, total cholesterol; TG, triglycerides.
Serological Analysis
Serum liver enzymes and lipid indicators were detected by alanine aminotransferase (ALT) (C009-2-1), aspartate aminotransferase (AST) (C010-2-1), triglyceride (TG) (A110-1-1), and TC (A111-1-1) kits, all from Nanjing Jiancheng Bioengineering Institute. Fasting insulin (FINS) levels were detected by the Insulin Elisa kit (Solarbio, SEKM-0141, China) to calculate the insulin resistance index (HOMA-IR). Tumor necrosis factor-α (TNF-α) Elisa kit (KE10002), Interleukin-6 (IL-6) Elisa kit (KE10007), IL-17A Elisa kit (KE10020), and IL-10 Elisa kit (KE00170) were used to detect inflammatory factors levels, which were purchased from Proteintech Group, Inc.
Histology
After excision, liver and ileal tissues were fixed with 10% formalin for 48 hours. After the processing, they were stained with hematoxylin and eosin and photographed by microscope. Frozen liver tissue sections were prepared and stained in the modified Oil Red O (Solarbio, G1261, China) and hematoxylin staining solution and finally sealed. The liver tissues were accurately weighed and added with anhydrous ethanol in the ratio of 1:9, and mechanically homogenized under ice-water bath conditions, and the supernatant was collected for detection after centrifugation.
RNA Extraction and Real-Time Quantitative PCR (qRT-PCR)
Total RNA was extracted from liver tissue using Trizol (Invitrogen, 1596-026, USA), and the first strand of cDNA was synthesized using RevertAid First Strand cDNA Synthesis Kit (Thermo Scientific, K1622, USA), followed by amplification using SYBR Green PCR kit (Thermo Scientific, K0223, USA) to add the corresponding template and primers, configure the PCR amplification system, and perform amplification on a Real-time detector (ABI, 7300, USA). The relevant primer sequences are shown in Supplementary Table 1.
Western Blot analysis
After adding samples and electrophoresis buffers in appropriate amounts according to the protein quantification results, electrophoresis was performed, after which the proteins were transferred to nitrocellulose membranes. The membranes were blocked with 5% skimmed milk at room temperature for one hour and incubated overnight with different dilutions of primary antibodies. After washing the membrane, it was incubated with diluted secondary antibodies. Finally, the luminescent solution (Millipore, WBKLS0100) was prepared and put into the imaging system to detect the immune complexes. Densitometry of immunoblot analysis was performed using Image J software. Relevant antibody information is shown in Supplementary Table 2.
Flow Cytometry
For Th17 proportion detection, serum-free medium, PMA, and BFA were added to the tubes while setting up the control tubes. Subsequently, Anti-Mouse CD3ε, Anti-Mouse CD4, fix & perm medium A, flow cytometry staining buffer, Fix & perm medium B, and Anti-Mouse IL-17A were added by steps and resuspended for detection. For Treg proportion detection, Anti-Mouse CD4 and Anti-Mouse CD25 were added to the tubes followed by FCM lysing solution, the supernatant was discarded after centrifugation. Then Anti-Mouse CD16/CD32, Anti-Mouse FoxP3, permeabilization buffer, and flow cytometry staining buffer were added and resuspended according to the steps. Each antibody was set up with an isotype IgG control and used the fluorescent signal of the isotype IgG control as the negative threshold. All related reagents were purchased from Multi Sciences Biotech Co., LTD of China.
Bacterial DNA extraction and 16S rDNA sequencing
Total genomic DNA was extracted using DNA Extraction Kit. The genome DNA was used as the template for PCR amplification with the barcoded primers and Tks Gflex DNA Polymerase (Takara, Japan). For bacterial diversity analysis, V3-V4 variable regions of 16S rRNA genes were amplified with universal primers. Amplicon quality was visualized using gel electrophoresis, purified with AMPure XP beads (Agencourt, U.S.A), and amplified for another round of PCR. After being purified with the AMPure XP beads again, the final amplicon was quantified using the Qubit dsDNA assay kit. Equal amounts of purified amplicon were pooled for subsequent sequencing. Library sequencing and data processing were conducted by OE Biotech Co., Ltd.
Statistical analysis
Data were analyzed and plotted using GraphPad Prism 9.0 Software (GraphPad Software Inc., USA), and results were expressed as mean ± SEM. Data conforming to normal distribution and homogeneity of variance were analyzed using Student’s t-test. Welch’s t-test was used if the homogeneity of variance was inconsistent. Comparisons between multiple groups were analyzed using one-way ANOVA. Multivariate statistical analysis of microorganisms between multiple groups was performed, and the Kruskal Wallis algorithm was used to analyze differential species for data that did not satisfy normal distribution and statistical aggregation. Spearman’s correlation analysis was adopted for the joint analysis of gut microbiota and related indicators. Differences were considered statistically significant at p<0.05.
Results
A. muciniphila or B. bifidum improved glycolipid metabolism and liver function
At the end of AVNM antibiotic administration, no statistically significant weight was found in any of the groups (Fig. 1B). After a total of 20 weeks of continuous HFD-feeding, the body weight, liver weight, fasting blood glucose and liver index of mice were already significantly higher in the HFD group than in the ND group, and similar performance was observed in the PBS group. Compared to the PBS group, the Akk group, Bifi group, and Combine group showed statistically significant improvements in these indicators (Fig. 1C–F). We then determined the serum FINS levels and calculated the HOMA-IR index. The results showed FINS levels were significantly higher in the HFD group and PBS group, which had developed severe IR status. While administration of A. muciniphila or B. bifidum improved IR status compared to the PBS group (Fig. 1G, H). Furthermore, by analyzing ALT and AST levels, mice in the HFD group and PBS group had shown more obvious hepatocellular damage and decreased liver function (Fig. 1I, J), and the serum TG and TC levels also demonstrated elevated lipid levels in both groups, whereas A. muciniphila or B. bifidum down-regulated these indicators (Fig. 2K, L). However, administration of B. bifidum did not show statistical significance although it reduced AST levels, which may be related to the small sample size, and increasing the sample size may be capable of showing more significant differences.
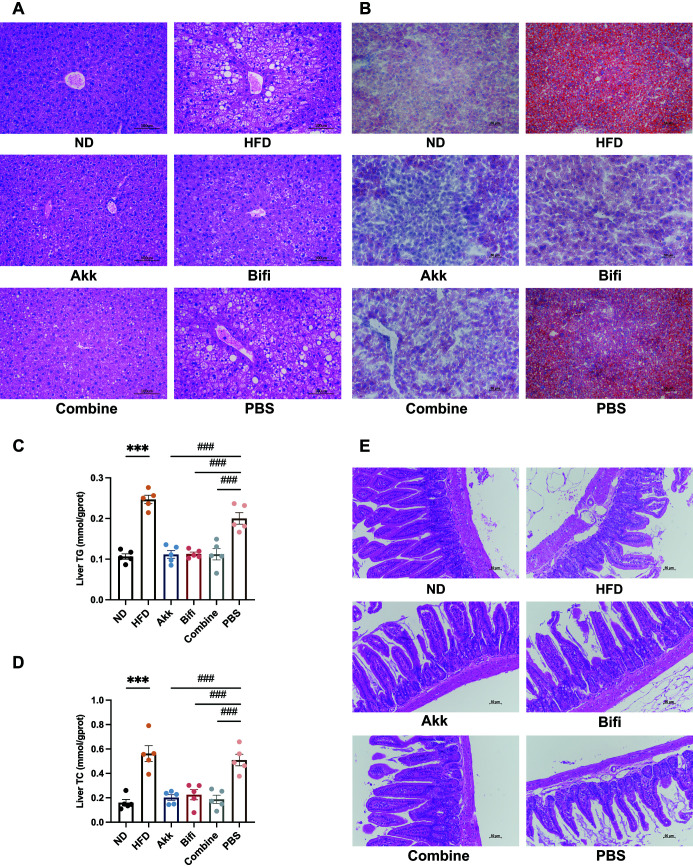
Fig. 2. Effect of administration of A. muciniphila or B. bifidum on hepatic steatosis and intestinal barrier function in mice.
(A) Representative micrographs of HE staining of mouse livers, 200x. (B) Representative micrographs of Oil Red O staining of mouse livers, 200x. (C) TG and (D) TC levels of liver tissue. (E) Representative micrographs of HE staining of mouse ilea tissue, 200x. Data were expressed as mean± SEM. N=5 per group in (C) (D). *p<0.05, **p<0.01, ***p<0.001 vs. ND group. #p<0.05, ##p<0.01, ###p<0.001 vs. PBS group. TC, Total cholesterol;TG, Triglycerides.
A. muciniphila or B. bifidum alleviated HFD-induced hepatic steatosis and improved intestinal mucosal barrier damage
HE staining results showed hepatic lobules of the ND group mice had normal structure and neatly arranged hepatocytes, and no hepatic steatosis was found. In the HFD group and PBS group, the liver structure was disordered, the nuclei were squeezed and degenerated, and hepatocytes were obviously swollen, with diffuse round lipid droplets of different sizes and balloon-like changes in some cells, which were consistent with the HE staining results of NAFLD and proved the successful modeling of NAFLD. The hepatocytes of the mice in the Akk group, Bifi group and Combine group were less swollen and more neatly arranged. The number of lipid droplets was significantly reduced, and the degree of steatosis was also diminished (Fig. 2A). The results of Oil Red O staining showed no obvious red-stained lipid droplets were seen in the ND group, while red lipid droplets were visible in the hepatocytes of both the HFD group and PBS group, with different sizes and diffuse distribution, indicating the existence of lipid deposition in the hepatocytes. The number of red-stained lipid droplets in the Akk group, Bifi group, and Combine group was reduced and the volume of lipid droplets was smaller, which was close to the staining results of the ND group (Fig. 2B). The results of TG and TC levels in liver tissues were also consistent with the pathological findings that A. muciniphila or B. bifidum successfully alleviated hepatic steatosis and lipid deposition (Fig. 2C, D). Besides, HE staining of ileal tissues showed the intestinal villus of mice in the ND group was well aligned and structurally intact, and no inflammation with lamina propria hyperemia was observed. In contrast, mice in the HFD group and PBS group showed disorganized intestinal villus arrangement, obvious mucosal destruction, and dilated and congested capillaries in the lamina propria. After administration of A. muciniphila or B. bifidum, the disorganized intestinal villus arrangement was improved with few defects and normalization of the lamina propria structure (Fig. 2E). The above results demonstrate A. muciniphila or B. bifidum could alleviate HFD-induced hepatic steatosis, reduce lipid deposition and improve intestinal mucosal barrier damage.
A. muciniphila or B. bifidum decreased inflammatory cytokine secretion and induced the transformation of T cells to Treg
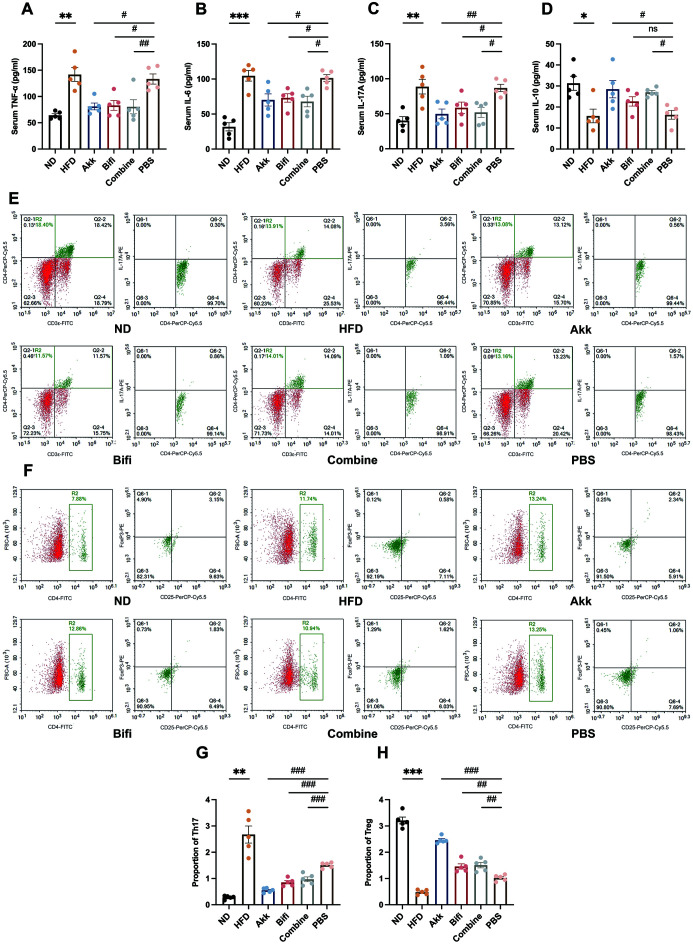
Compared with the ND group, the serum TNF-α, IL-6, and IL-17A levels were increased to different degrees in the HFD group and PBS group of mice, while the IL-10 level was decreased. This is also consistent with the characterization of NAFLD models in previous studies. Compared with the PBS group, the Akk group, Bifi group and Combine group showed a reduction in serum pro-inflammatory factor levels and an elevation in the level of IL-10 (Fig. 3A–D). Meanwhile, the HFD group showed a significant increase in the proportion of Th17 and a significant decrease in Treg, while the PBS group also showed similar but weaker results. In contrast, a varying decrease in the proportion of Th17 and an increase of Treg was observed after administration of A. muciniphila or B. bifidum (Fig. 3E–H), suggesting both strains improved the immune status of mice and induced the transformation of T cells to Treg, with the Akk group having the most marked effect of regulating the immune status.
Fig. 3. Effect of administration of A. muciniphila or B. bifidum on inflammation and immune status in mice.
(A) Serum TNF-α levels. (B) Serum IL-6 levels. (C) Serum IL-17A levels. (D) Serum IL-10 levels. Flow cytometry results of representative (E) Th17 and (F) Treg. (G) The proportion of Th17. (H) The proportion of Treg. Data were expressed as mean± SEM. N=5 per group. *p<0.05, **p<0.01, ***p<0.001 vs. ND group. #p<0.05, ##p<0.01, ###p<0.001 vs. PBS group. TNF-α, tumor necrosis factor-α; IL-6, interleukin-6; IL-17A, interleukin-17A; IL-10, interleukin-10; Th17, T help cell 17; Treg, regulatory T cells.
A. muciniphila or B. bifidum activated hepatic FXR, suppressed intestinal FXR, and increased tight junction protein expression
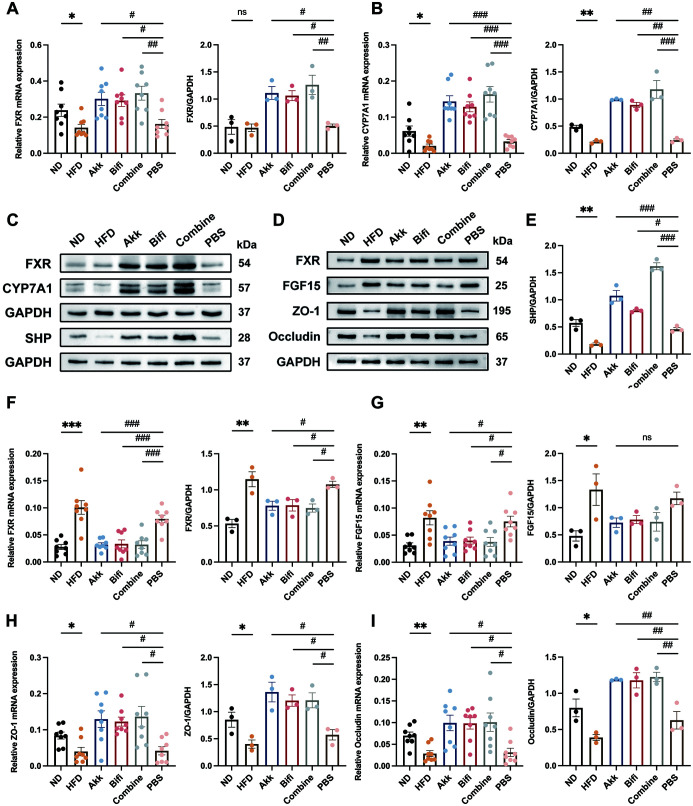
FXR is a transcription factor with bile acid as a natural ligand, which is abundantly expressed in the liver and intestine and plays an important role in bile acid metabolism, and glucolipid metabolism. Many studies have shown imbalance of bile acids and FXR is one of the metabolic features of NAFLD patients.25,26 Through qRT-PCR and WB technique, hepatic FXR expression was suppressed in the HFD group compared to the ND group, as was the expression of its direct target small heterodimer partner (SHP) and downstream cytochrome P450 family7 subfamily a member-1 (CYP7A1). Compared with the PBS group, hepatic FXR expression increased after administration of A. muciniphila or B. bifidum, with the strongest effect of activating FXR expression in the Combine group (Fig. 4A–C, E). However, intestinal FXR expression was significantly higher in the HFD group, and the same trend was observed in the PBS group, where the downstream product fibroblast growth factor 15 (FGF15) was also activated and increased in expression. In the Akk group, Bifi group, and Combine group, we found intestinal FXR expression was suppressed, and statistically significant; the FGF15 expression was also decreased but did not show statistical significance (Fig. 4D, F, G). In parallel, ZO-1 and Occludin are important proteins between intestinal epithelial cells and play important roles in maintaining intestinal mucosal barriers. The mRNA and protein expression of ZO-1 and Occludin were significantly decreased in the HFD group and PBS group, suggesting a more severe intestinal mucosal barrier damage and disruption (Fig. 4D, H, I). In contrast, their expression increased significantly after the intervention of A. muciniphila or B. bifidum was given. Combined with the above results, we hold the opinion that A. muciniphila and B. bifidum exerted their effects by activating hepatic FXR and suppressing intestinal FXR expression while improving intestinal mucosal permeability.
Fig. 4. Effect of administration of A. muciniphila or B. bifidum on hepatic and intestinal FXR and intestinal tight junction protein expression.
The mRNA and protein expression levels of hepatic (A) FXR and (B) CYP7A1. (C) Hepatic western blot images. (D) Ileal western blot images. (E) The protein expression levels of hepatic SHP. The mRNA and protein expression levels of ileal (F) FXR, (G) FGF15, (H) ZO-1, and (I) Occludin. Data were expressed as mean± SEM. N=8 per group when mRNA was measured. N=3 when protein expression was measured. *p<0.05, **p<0.01, ***p<0.001 vs. ND group. #p<0.05, ##p<0.01, ###p<0.001 vs. PBS group. FXR, farnesol X receptors; CYP7A1, cytochrome P450 family 7 subfamily A member-1; FGF15, fibroblast growth factor 15; GAPDH, glyceraldehyde-3-phosphate dehydrogenase; SHP, small heterodimer partner; ZO-1, tight junction protein-1.
Changes in gut microbiota after the administration of A. muciniphila or B. bifidum
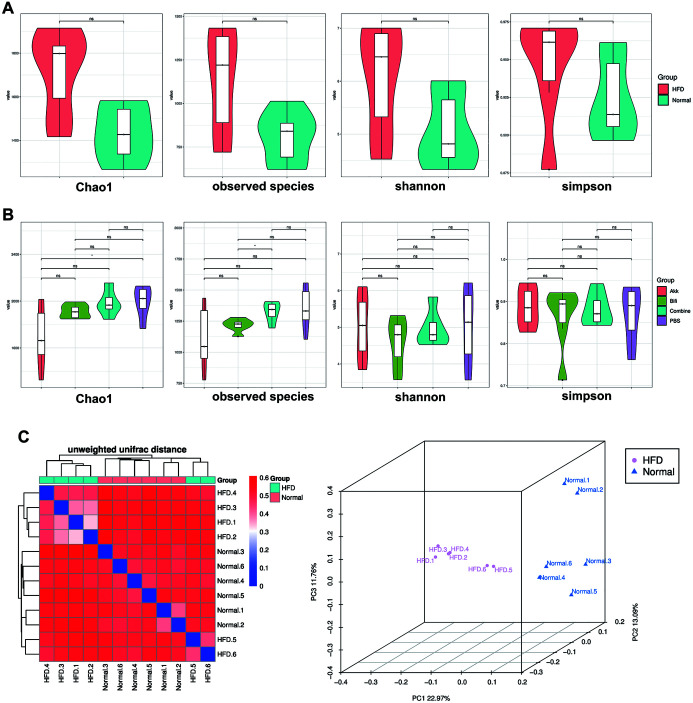
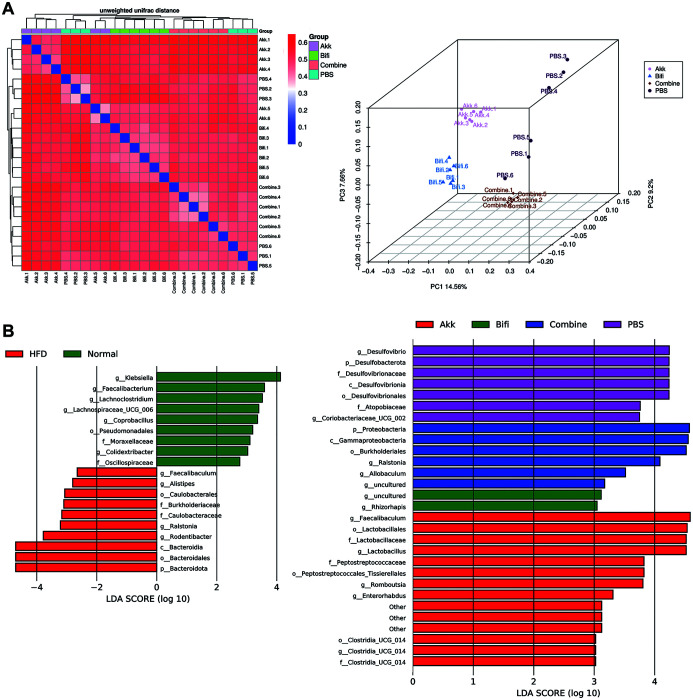
Alpha diversity is an indicator to evaluate the differences in gut microbiota diversity. In this study, Chao1, the observed species index, and Shannon and Simpson’s index were used for evaluation. Separate comparisons revealed no significant differences in the alpha diversity of the gut microbiota between the ND group and HFD group (Fig. 5A), the Akk group and PBS group had statistically significant differences in the Chao1 index, the Bifi group and the Combine group had statistically significant differences in observed species index (Fig. 5B). The above results indicated there were differences between the Akk group and PBS group in terms of community richness and between the Bifi group and Combine group in terms of the number of species, but as a whole, there were no more significant differences between the experimental groups in terms of the alpha diversity of the gut microbiota. Unlike alpha diversity, beta diversity was used to reflect whether there were differences in microbial community composition between groups. Firstly, comparing the ND group and HFD group through the unweighted unifrac distance heatmap, although there was also some similarity in the samples between different groups, the overall observation was presented as two clusters, with the bluer the color indicating the closer the samples were to each other and the higher the similarity, the redder the opposite. The principal coordinates analysis (PCoA) plot, on the other hand, shows more directly the differences between the two groups after data transformation (Fig. 5C). Similarly, comparing the PBS group with the three experimental groups, although different samples of the PBS group had similarities with the different experimental group samples, respectively, it was observed different clustering between the four groups remained. In the PCoA plot, a close sample distance and better clustering within the three experimental groups were observed, with a significant distance between them and the PBS group (Fig. 6A). Furthermore, adonis analysis was used to assess whether the grouping of the samples was reasonable. As shown in Table 1, the p-values for each group comparison were less than 0.05, indicating the between-group differences were greater than the within-group differences and the overall experimental grouping was reasonable and valid.
Fig. 5. Alpha and beta diversity of the gut microbiota.
(A) Comparison of alpha diversity between ND group and HFD group. (B) Comparison of alpha diversity in Akk group, Bifi group, Combine group, and PBS group. (C) Comparison of beta diversity based on unweighted unifrac distance heatmap and PCoA plots between ND group and HFD group. N=6 per group. PCoA, principal coordinates analysis.
Fig. 6. Beta diversity of the gut microbiota and LEfSe plots.
(A) Comparison of beta diversity based on unweighted unifrac distance heatmap and PCoA plots in Akk group, Bifi group, Combine group, and PBS group. (B) LEfSe analysis plots between groups. N=6 per group. LDA, linear discriminant analysis; PCoA, principal coordinates analysis.
Table 1. Adonis analysis of the gut microbiota.
| Vs_group | SumsOfSqs | MeanSqs | F.Model | R2 | p-value(>F) |
|---|---|---|---|---|---|
| ND-HFD | 0.28843 (1.26611) | 0.28843 (0.12661) | 2.2781 | 0.18554 (0.81446) | 0.006 |
| Akk-PBS | 0.3255 (1.2721) | 0.3255 (0.12721) | 2.5588 | 0.20375 (0.79625) | 0.003 |
| Bifi-PBS | 0.30843 (1.10826) | 0.30843 (0.11083) | 2.783 | 0.21771 (0.78229) | 0.005 |
| Com-PBS | 0.20243 (1.12925) | 0.20243 (0.11292) | 1.7926 | 0.15201 (0.84799) | 0.002 |
MeanSqs, mean of squares; SumsofSqs, sum of squares.
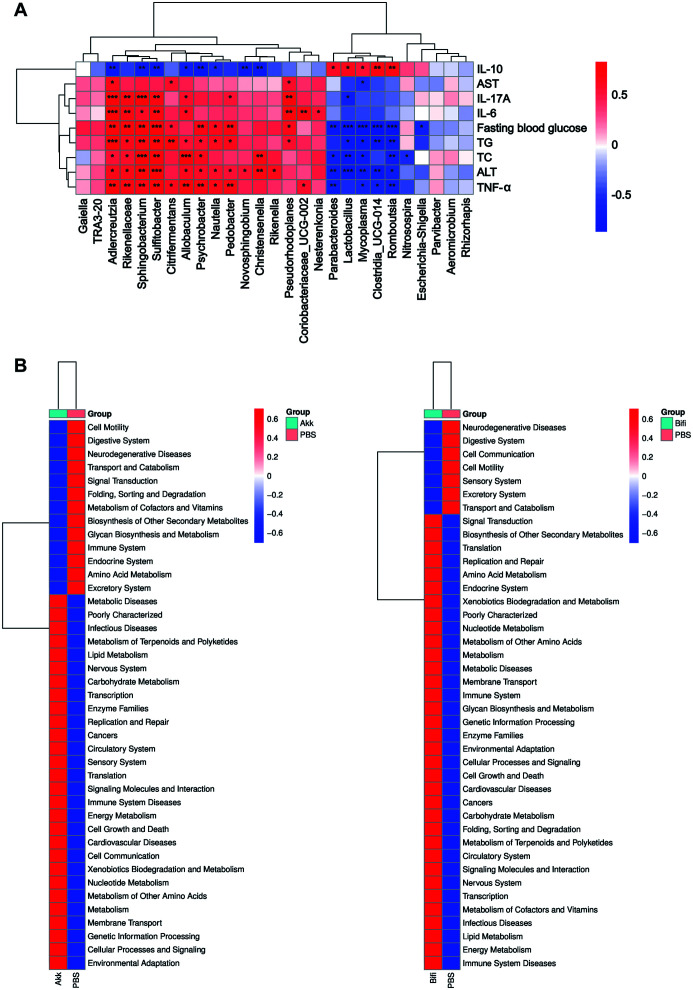
We then explored the relative abundance of species and the analysis of differences between different groups. We used linear discriminant analysis effect size (LEfSe) plots to further analyze the species with significant differences in abundance among different groups, and the length of the bar graph represents the influence value of significantly different species (Fig. 6B). From the figure, the more influential species in the Akk group were Faecalibaculum and Lactobacillales. The more influential specie in the Bifi group was Rhizorhapis, in the Combine group was Proteobacteria, and in the PBS group was Desulfovibrio. The histogram of the relative abundance of the gut microbiota at the phylum, genus, and species levels for each group is shown (Supplementary Fig. 1). From our above results, we found the Akk group had a more prominent effect compared to the Bifi group, so we screened the Akk group, Bifi group, and PBS group for differences in genus-level bacteria and performed correlation analysis in combination with the indexes (Fig. 7A). The results revealed that Adlercreutzia, Rikenellaceae, Sphingobacterium, Sulfitobacter, and Allobaculum were positively correlated with elevation of glucose and lipids, the decrease of liver function and the inflammatory status of NAFLD mice, while Parabacteroides, Lactobacillus, Mvcoplasma, Romboutsia, and Clostridia UCG-014 were negatively correlated with these indicators and positively correlated with the protective factor IL-10. The abundance of Adlercreutzia was sequentially higher in the Akk group, Bifi group, and PBS group, suggesting it plays a negative role in NAFLD formation, which may be one of the reasons for the superior effect of the Akk group over the Bifi group. In contrast, the abundance of Romboutsia, Lactobacillus, and Parabacteroides decreased sequentially in the Akk group, Bifi group, and PBS group, contributing to a protective effect on NAFLD formation, which may also be the reason for the superior effect of the Akk group over the Bifi group. Finally, according to the Kyoto encyclopedia of genes and genomes (KEGG) predicted functional plots, A. muciniphila was found to be mainly enriched in multiple metabolic processes, including metabolic diseases, lipid metabolism, carbohydrate metabolism, and energy metabolism. B. bifidum, on the other hand, was enriched in signal transduction, secondary metabolite biosynthesis, and translation(Fig. 7B).
Fig. 7. Correlation analysis and KEGG predicted functional plots.
(A) The Spearman correlation analysis of the differential genus with detected indicators. (B) KEGG predicted functional plots. ALT, alanine aminotransferase; AST, aspartate aminotransferase; IL-6, interleukin-6; IL-10, interleukin-10; IL-17A, interleukin-17A; TC, total cholesterol; TG, triglycerides; TNF-α, tumor necrosis factor-α;
Discussion
The gut microbiota directly or indirectly affects a variety of diseases, such as the role of the brain-gut axis and the liver-gut axis in various diseases. A study identified HiAlc Kpn, an intestinal bacterium capable of high alcohol production, and successfully induced the NAFLD mice model through fecal transplantation,23 which further demonstrated the intimate link between the gut microbiota and NAFLD. Inflammatory and immune responses play key roles in liver inflammation initiation, progression, and regression. Some scholars believe the combination of LPS and TLR4 is the earliest and most important link in the progression of NAFLD.27 LPS could induce the release of inflammatory factors in vivo and recruit macrophages to adipose tissue. While macrophages residing in adipocytes are regarded as culprits of obesity, both promoting lipid droplet synthesis in white adipose tissue and inhibiting thermogenesis in brown adipose tissue to reduce consumption.28 As a complex metabolism-related disease, the pathogenesis of NAFLD involves multiple different types and functional cell populations, and the cross-linkage network and feedback system between innate and adaptive immunity is an important influence in the pathogenesis of NAFLD/NASH. The successive transfer of inflammatory hepatic CXCR3 + Th17 is capable of accelerating the exacerbation of NAFLD.29 Conversely, Treg levels are lower in NAFLD patients than in healthy individuals, and the reduction is more pronounced in peripheral blood mononuclear cells from NASH patients.11,30 Transplantation of intestinal flora from NAFLD patients into mice also promotes NASH liver inflammation and fibrosis through the activation of intrahepatic B-cell aggregates.31 Therefore, regulation of the gut microbiota can enhance intestinal barrier function, reduce hepatic steatosis, improve inflammatory response and immune damage, and function actively in NAFLD.
All three experimental groups showed promising results in improving disorders of glucolipid metabolism and impaired liver function. Both the Akk group and Combine group significantly reduced AST levels, however, there was no statistically significant decrease in the Bifi group compared with the PBS group, although there was an obvious downward trend, the difference could be more significant if the sample size was enlarged, which could also suggest the effect of B. bifidum on improving severe hepatocyte necrosis was relatively weak. Combined with pathological results, we can observe A. muciniphila was the most effective in improving hepatic steatosis and reducing lipid deposition. All three experimental groups positively alleviated the inflammatory state of mice, but the Bifi group did not show a statistically significant increase in serum IL-10 levels, though the trend was clear. Surprisingly, a decrease in peripheral blood Th17 and an increase in Treg were observed after the application of the probiotic solution, with A. muciniphila having the most pronounced tendency. The positive effect of both strains in regulating the immune status of HFD-feeding mice is one of the highlights of the research and supports the relationship between gut microbiota and T-cell response in the NAFLD process.
We then explored possible mechanisms by which A. muciniphila and B. bifidum alleviate NAFLD. Based on previous studies, it is clear that the imbalance of FXR is one of the important mechanisms in the development of NAFLD, but its relationship with different strains is not elucidated, its expression and role in different tissues are not clear, and the function in metabolic diseases has not been identified. After a rational design with controlled variables, we were surprised to find all three experimental groups upregulated hepatic FXR pathway product expressions and downregulated intestinal FXR pathway product expressions, compared to the PBS group, suggesting both strains play different roles towards FXR at different sites, whereas the overall results are positive. Our results revealed differences in FXR expression at different sites, which were not much addressed in the previous study. As to the reasons for this performance, we speculate that one of the possible mechanisms is the regulatory proteins of FXR are differentially expressed in the liver or intestine and perform different effects, which may result in diverse changes when we intervene accordingly. Of course, we cannot exclude other underlying alterations that may occur when shifting the experimental settings and background, which require more detailed exploration. Damage to the intestinal barrier is also an early core event and an essential mechanism for NAFLD development. Under physiological conditions, the intestinal mucosal barrier controls the absorption of nutrients from the paracellular pathway and also blocks harmful substances.32 However, under pathological conditions such as inflammatory stimulation, hypoxia, and dysbiosis of the gut microbiota, intestinal mucosal permeability is increased, bacterial translocation can occur and LPS is absorbed into the bloodstream, activating the inflammatory cascade response. By detecting two tight junction proteins, ZO-1 and Occludin, all experimental groups were able to increase their expression, which verifies that both strains could indeed contribute positively to NAFLD by improving intestinal permeability. Finally, we investigated the changes in the gut microbiota and found no significant differences in alpha diversity, while beta diversity was significantly different. A. muciniphila acts by colonizing the intestine, while B. bifidum may act by increasing the abundance of other kinds of Bifidobacteria or probiotics. Lactobacillus was negatively correlated with the number of bowel movements in irritable bowel syndrome patients and was able to improve NAFLD progression by lowering cholesterol and modulating gut microbiota and inflammatory pathways.33,34 Parabacteroides could reduce intestinal inflammation, improve IR, and restore abnormal host amino acid metabolism, which was negatively associated with obesity.35,36 Increased abundance of Lactobacillus and Parabacteroides was observed in all experimental groups and both were significantly negatively correlated with the glycolipid metabolism indicators of NAFLD and positively correlated with IL-10 levels, indicating A. muciniphila and B. bifidum could promote the growth and colonization of both genera, which also suggesting Lactobacillus and Parabacteroides play central roles in NAFLD formation and maybe one of the reasons for the superior effect of the Akk group over the Bifi group.
Based on the results, we observe differences in the trend of modulating effects between the different experimental groups. In our research, we gave the Akk group and Bifi group every 0.2 ml bacterial solution by gavage, while in the Combine group we reduced the doses of A. muciniphila and B. bifidum by half each, with the same concentration. We tried to investigate the effect of the two strains individually and the interaction between the two strains with the same total volume of bacterial solution and the total number of bacteria. In terms of regulating FXR protein expression, the Combine group was more effective than the Akk group or Bifi group. Based on the consistency of the total number of bacteria and the volume of the bacterial solution, we believe A. muciniphila and B. bifidum are synergistic in regulating FXR expression, as the effect is strongest even if the dose of both is reduced by half. As for the reasons for not showing the same trend in other metrics as in the regulation of FXR protein expression, we consider that on the one hand, the involvement of other pathways led to differences in most downstream detection indicators. On the other hand, we speculate the positive regulation of A. muciniphila was superior to that of B. bifidum in these indicators, however, the results occurred due to the halving of the dose of A. muciniphila. In addition, A. muciniphila and B. bifidum belong to different bacterial taxonomic levels and have different metabolic processes and metabolites produced, so the alteration of metabolites may also be one of the important reasons for the difference in effect, which is the next step we would like to work with. Therefore, taking the results of our experiment as a starting point, we need to think more and deeper about the combined application of probiotics. The dose, concentration, and duration of the combined strains need to be optimized according to the characteristics of different strains and the level of bacterial classification to which they belong. Interactions between strains are not completely synergistic or antagonistic, and the aspect in which they act may be one of the important factors in producing different outcomes. The environment of the gut microbiota, the specificity of the disease, and the context of the research need to be more important considerations in the field of gut microbiota.
Conclusion
A. muciniphila or B. bifidum could prevent HFD-induced NAFLD formation and exert hypolipidemic, anti-inflammatory, immunomodulatory, and IR-improving effects. Both strains protected against NAFLD by activating hepatic FXR, suppressing intestinal FXR expression, modulating the gut microbiota, and improving intestinal mucosal permeability. We also found the combination of probiotics did not necessarily generate better outcomes. After further exploration A. muciniphila or B. bifidum can be used as alternative treatment strategies for NAFLD.
Supporting information
Histogram of relative abundance at the (D) phylum level (E) genus level (F) species level for Akk group, Bifi group, Combine group, and PBS group. N=6 per group.
Acknowledgments
Graphical abstract was drawn by Figdraw.
Abbreviations
- ALT
alanine aminotransferase
- AST
aspartate aminotransferase
- AVNM
ampicillin Na, vancomycin HCL, neomycin sulfate, and metronidazole
- CYP7A1
cytochrome P450 family7 subfamily a member-1
- FGF15
fibroblast growth factor 15
- FINS
fasting insulin
- FXR
farnesol X receptors
- GAPDH
glyceraldehyde-3-phosphate dehydrogenase
- GLP-1
glucagon-like peptide-1
- HFD
high-fat diets
- HOMA-IR
insulin resistance index
- IL-6
interleukin-6
- IR
insulin resistance
- KEGG
Kyoto encyclopedia of genes and genomes
- LEfSe
linear discriminant analysis effect size
- LPS
lipopolysaccharide
- NAFLD
non-alcoholic fatty liver disease
- NASH
non-alcoholic steatohepatitis
- ND
normal diets
- PBS
phosphate-buffered saline
- PCoA
principal coordinates analysis
- SHP
small heterodimer partner
- TC
total cholesterol
- TG
triglyceride
- Th17
T help cell 17
- TLR2
toll-like receptor 2
- TNF-α
tumor necrosis factor-α
- Treg
regulatory T cells
Ethical statement
All experimental protocols were approved by the Institutional Animal Care and Use Committee of SHRM (Approval No.20210308(22)).
Data sharing statement
The sequence data used to support the findings of this study have been deposited in the NCBI Sequence Read Archive (PRJNA867305). Other data are available from the corresponding author at xiaolan_lu@163.com upon request.
References
- 1.Stefan N, Häring HU, Cusi K. Non-alcoholic fatty liver disease: causes, diagnosis, cardiometabolic consequences, and treatment strategies. Lancet Diabetes Endocrinol. 2019;7(4):313–324. doi: 10.1016/s2213-8587(18)30154-2. [DOI] [PubMed] [Google Scholar]
- 2.Diehl AM, Day C. Cause, Pathogenesis, and Treatment of Nonalcoholic Steatohepatitis. N Engl J Med. 2017;377(21):2063–2072. doi: 10.1056/NEJMra1503519. [DOI] [PubMed] [Google Scholar]
- 3.Younossi ZM. Non-alcoholic fatty liver disease - A global public health perspective. J Hepatol. 2019;70(3):531–544. doi: 10.1016/j.jhep.2018.10.033. [DOI] [PubMed] [Google Scholar]
- 4.Younossi Z, Stepanova M, Ong JP, Jacobson IM, Bugianesi E, Duseja A, et al. Nonalcoholic Steatohepatitis Is the Fastest Growing Cause of Hepatocellular Carcinoma in Liver Transplant Candidates. Clin Gastroenterol Hepatol. 2019;17(4):748–755.e3. doi: 10.1016/j.cgh.2018.05.057. [DOI] [PubMed] [Google Scholar]
- 5.Chu H, Duan Y, Yang L, Schnabl B. Small metabolites, possible big changes: a microbiota-centered view of non-alcoholic fatty liver disease. Gut. 2019;68(2):359–370. doi: 10.1136/gutjnl-2018-316307. [DOI] [PubMed] [Google Scholar]
- 6.Jiao N, Baker SS, Chapa-Rodriguez A, Liu W, Nugent CA, Tsompana M, et al. Suppressed hepatic bile acid signalling despite elevated production of primary and secondary bile acids in NAFLD. Gut. 2018;67(10):1881–1891. doi: 10.1136/gutjnl-2017-314307. [DOI] [PubMed] [Google Scholar]
- 7.Zheng X, Chen T, Zhao A, Ning Z, Kuang J, Wang S, et al. Hyocholic acid species as novel biomarkers for metabolic disorders. Nat Commun. 2021;12(1):1487. doi: 10.1038/s41467-021-21744-w. [DOI] [PMC free article] [PubMed] [Google Scholar]
- 8.Lee Y, Kamada N, Moon JJ. Oral nanomedicine for modulating immunity, intestinal barrier functions, and gut microbiome. Adv Drug Deliv Rev. 2021;179:114021. doi: 10.1016/j.addr.2021.114021. [DOI] [PMC free article] [PubMed] [Google Scholar]
- 9.Alam C, Bittoun E, Bhagwat D, Valkonen S, Saari A, Jaakkola U, et al. Effects of a germ-free environment on gut immune regulation and diabetes progression in non-obese diabetic (NOD) mice. Diabetologia. 2011;54(6):1398–1406. doi: 10.1007/s00125-011-2097-5. [DOI] [PubMed] [Google Scholar]
- 10.Garidou L, Pomié C, Klopp P, Waget A, Charpentier J, Aloulou M, et al. The Gut Microbiota Regulates Intestinal CD4 T Cells Expressing RORγt and Controls Metabolic Disease. Cell Metab. 2015;22(1):100–112. doi: 10.1016/j.cmet.2015.06.001. [DOI] [PubMed] [Google Scholar]
- 11.Rau M, Schilling AK, Meertens J, Hering I, Weiss J, Jurowich C, et al. Progression from Nonalcoholic Fatty Liver to Nonalcoholic Steatohepatitis Is Marked by a Higher Frequency of Th17 Cells in the Liver and an Increased Th17/Resting Regulatory T Cell Ratio in Peripheral Blood and in the Liver. J Immunol. 2016;196(1):97–105. doi: 10.4049/jimmunol.1501175. [DOI] [PubMed] [Google Scholar]
- 12.Ma X, Hua J, Mohamood AR, Hamad AR, Ravi R, Li Z. A high-fat diet and regulatory T cells influence susceptibility to endotoxin-induced liver injury. Hepatology. 2007;46(5):1519–1529. doi: 10.1002/hep.21823. [DOI] [PubMed] [Google Scholar]
- 13.Derrien M, Vaughan EE, Plugge CM, de Vos WM. Akkermansia muciniphila gen. nov., sp. nov., a human intestinal mucin-degrading bacterium. Int J Syst Evol Microbiol. 2004;54(Pt 5):1469–1476. doi: 10.1099/ijs.0.02873-0. [DOI] [PubMed] [Google Scholar]
- 14.Schneeberger M, Everard A, Gómez-Valadés AG, Matamoros S, Ramírez S, Delzenne NM, et al. Akkermansia muciniphila inversely correlates with the onset of inflammation, altered adipose tissue metabolism and metabolic disorders during obesity in mice. Sci Rep. 2015;5:16643. doi: 10.1038/srep16643. [DOI] [PMC free article] [PubMed] [Google Scholar]
- 15.Rao Y, Kuang Z, Li C, Guo S, Xu Y, Zhao D, et al. Gut Akkermansia muciniphila ameliorates metabolic dysfunction-associated fatty liver disease by regulating the metabolism of L-aspartate via gut-liver axis. Gut Microbes. 2021;13(1):1–19. doi: 10.1080/19490976.2021.1927633. [DOI] [PMC free article] [PubMed] [Google Scholar]
- 16.Depommier C, Everard A, Druart C, Plovier H, Van Hul M, Vieira-Silva S, et al. Supplementation with Akkermansia muciniphila in overweight and obese human volunteers: a proof-of-concept exploratory study. Nat Med. 2019;25(7):1096–1103. doi: 10.1038/s41591-019-0495-2. [DOI] [PMC free article] [PubMed] [Google Scholar]
- 17.Ottman N, Reunanen J, Meijerink M, Pietilä TE, Kainulainen V, Klievink J, et al. Pili-like proteins of Akkermansia muciniphila modulate host immune responses and gut barrier function. PLoS One. 2017;12(3):e0173004. doi: 10.1371/journal.pone.0173004. [DOI] [PMC free article] [PubMed] [Google Scholar]
- 18.Wang L, Jiao T, Yu Q, Wang J, Wang L, Wang G, et al. Bifidobacterium bifidum Shows More Diversified Ways of Relieving Non-Alcoholic Fatty Liver Compared with Bifidobacterium adolescentis. Biomedicines. 2021;10(1):84. doi: 10.3390/biomedicines10010084. [DOI] [PMC free article] [PubMed] [Google Scholar]
- 19.Al-Sadi R, Dharmaprakash V, Nighot P, Guo S, Nighot M, Do T, et al. Bifidobacterium bifidum Enhances the Intestinal Epithelial Tight Junction Barrier and Protects against Intestinal Inflammation by Targeting the Toll-like Receptor-2 Pathway in an NF-κB-Independent Manner. Int J Mol Sci. 2021;22(15):8070. doi: 10.3390/ijms22158070. [DOI] [PMC free article] [PubMed] [Google Scholar]
- 20.Wang Q, Wang K, Wu W, Lv L, Bian X, Yang L, et al. Administration of Bifidobacterium bifidum CGMCC 15068 modulates gut microbiota and metabolome in azoxymethane (AOM)/dextran sulphate sodium (DSS)-induced colitis-associated colon cancer (CAC) in mice. Appl Microbiol Biotechnol. 2020;104(13):5915–5928. doi: 10.1007/s00253-020-10621-z. [DOI] [PubMed] [Google Scholar]
- 21.Wang Y, Xie Q, Zhang Y, Ma W, Ning K, Xiang JY, et al. Combination of probiotics with different functions alleviate DSS-induced colitis by regulating intestinal microbiota, IL-10, and barrier function. Appl Microbiol Biotechnol. 2020;104(1):335–349. doi: 10.1007/s00253-019-10259-6. [DOI] [PubMed] [Google Scholar]
- 22.Huang S, Hu S, Liu S, Tang B, Liu Y, Tang L, et al. Lithium carbonate alleviates colon inflammation through modulating gut microbiota and Treg cells in a GPR43-dependent manner. Pharmacol Res. 2022;175:105992. doi: 10.1016/j.phrs.2021.105992. [DOI] [PubMed] [Google Scholar]
- 23.Yuan J, Chen C, Cui J, Lu J, Yan C, Wei X, et al. Fatty Liver Disease Caused by High-Alcohol-Producing Klebsiella pneumoniae. Cell Metab. 2019;30(4):675–688.e7. doi: 10.1016/j.cmet.2019.08.018. [DOI] [PubMed] [Google Scholar]
- 24.Petrella C, Strimpakos G, Torcinaro A, Middei S, Ricci V, Gargari G, et al. Proneurogenic and neuroprotective effect of a multi strain probiotic mixture in a mouse model of acute inflammation: Involvement of the gut-brain axis. Pharmacol Res. 2021;172:105795. doi: 10.1016/j.phrs.2021.105795. [DOI] [PubMed] [Google Scholar]
- 25.Yan N, Yan T, Xia Y, Hao H, Wang G, Gonzalez FJ. The pathophysiological function of non-gastrointestinal farnesoid X receptor. Pharmacol Ther. 2021;226:107867. doi: 10.1016/j.pharmthera.2021.107867. [DOI] [PubMed] [Google Scholar]
- 26.Clifford BL, Sedgeman LR, Williams KJ, Morand P, Cheng A, Jarrett KE, et al. FXR activation protects against NAFLD via bile-acid-dependent reductions in lipid absorption. Cell Metab. 2021;33(8):1671–1684.e4. doi: 10.1016/j.cmet.2021.06.012. [DOI] [PMC free article] [PubMed] [Google Scholar]
- 27.Fei N, Bruneau A, Zhang X, Wang R, Wang J, Rabot S, et al. Endotoxin Producers Overgrowing in Human Gut Microbiota as the Causative Agents for Nonalcoholic Fatty Liver Disease. mBio. 2020;11(1):e03263-19. doi: 10.1128/mBio.03263-19. [DOI] [PMC free article] [PubMed] [Google Scholar]
- 28.Cox N, Crozet L, Holtman IR, Loyher PL, Lazarov T, White JB, et al. Diet-regulated production of PDGFcc by macrophages controls energy storage. Science. 2021;373(6550):eabe9383. doi: 10.1126/science.abe9383. [DOI] [PMC free article] [PubMed] [Google Scholar]
- 29.Moreno-Fernandez ME, Giles DA, Oates JR, Chan CC, Damen MSMA, Doll JR, et al. PKM2-dependent metabolic skewing of hepatic Th17 cells regulates pathogenesis of non-alcoholic fatty liver disease. Cell Metab. 2021;33(6):1187–1204.e9. doi: 10.1016/j.cmet.2021.04.018. [DOI] [PMC free article] [PubMed] [Google Scholar]
- 30.Li L, Xia Y, Ji X, Wang H, Zhang Z, Lu P, et al. MIG/CXCL9 exacerbates the progression of metabolic-associated fatty liver disease by disrupting Treg/Th17 balance. Exp Cell Res. 2021;407(2):112801. doi: 10.1016/j.yexcr.2021.112801. [DOI] [PubMed] [Google Scholar]
- 31.Barrow F, Khan S, Fredrickson G, Wang H, Dietsche K, Parthiban P, et al. Microbiota-Driven Activation of Intrahepatic B Cells Aggravates NASH Through Innate and Adaptive Signaling. Hepatology. 2021;74(2):704–722. doi: 10.1002/hep.31755. [DOI] [PMC free article] [PubMed] [Google Scholar]
- 32.Aron-Wisnewsky J, Gaborit B, Dutour A, Clement K. Gut microbiota and non-alcoholic fatty liver disease: new insights. Clin Microbiol Infect. 2013;19(4):338–348. doi: 10.1111/1469-0691.12140. [DOI] [PubMed] [Google Scholar]
- 33.Lee NY, Shin MJ, Youn GS, Yoon SJ, Choi YR, Kim HS, et al. Lactobacillus attenuates progression of nonalcoholic fatty liver disease by lowering cholesterol and steatosis. Clin Mol Hepatol. 2021;27(1):110–124. doi: 10.3350/cmh.2020.0125. [DOI] [PMC free article] [PubMed] [Google Scholar]
- 34.Zhong W, Lu X, Shi H, Zhao G, Song Y, Wang Y, et al. Distinct Microbial Populations Exist in the Mucosa-associated Microbiota of Diarrhea Predominant Irritable Bowel Syndrome and Ulcerative Colitis. J Clin Gastroenterol. 2019;53(9):660–672. doi: 10.1097/mcg.0000000000000961. [DOI] [PubMed] [Google Scholar]
- 35.Wu TR, Lin CS, Chang CJ, Lin TL, Martel J, Ko YF, et al. Gut commensal Parabacteroides goldsteinii plays a predominant role in the anti-obesity effects of polysaccharides isolated from Hirsutella sinensis. Gut. 2019;68(2):248–262. doi: 10.1136/gutjnl-2017-315458. [DOI] [PubMed] [Google Scholar]
- 36.Lai HC, Lin TL, Chen TW, Kuo YL, Chang CJ, Wu TR, et al. Gut microbiota modulates COPD pathogenesis: role of anti-inflammatory Parabacteroides goldsteinii lipopolysaccharide. Gut. 2022;71(2):309–321. doi: 10.1136/gutjnl-2020-322599. [DOI] [PubMed] [Google Scholar]
Associated Data
This section collects any data citations, data availability statements, or supplementary materials included in this article.
Supplementary Materials
Histogram of relative abundance at the (D) phylum level (E) genus level (F) species level for Akk group, Bifi group, Combine group, and PBS group. N=6 per group.


