

Summary
Living species vary significantly in phenotype and genomic content. Sophisticated statistical methods linking genes with phenotypes within a species have led to breakthroughs in complex genetic diseases and genetic breeding. Despite the abundance of genomic and phenotypic data available for thousands of species, finding genotype-phenotype associations across species is challenging due to the non-independence of species data resulting from common ancestry. To address this, we present CALANGO (comparative analysis with annotation-based genomic components), a phylogeny-aware comparative genomics tool to find homologous regions and biological roles associated with quantitative phenotypes across species. In two case studies, CALANGO identified both known and previously unidentified genotype-phenotype associations. The first study revealed unknown aspects of the ecological interaction between Escherichia coli, its integrated bacteriophages, and the pathogenicity phenotype. The second identified an association between maximum height in angiosperms and the expansion of a reproductive mechanism that prevents inbreeding and increases genetic diversity, with implications for conservation biology and agriculture.
Keywords: species data, comparative genomics, evolution of quantitative phenotypes, genotype-phenotype association, comparative methods, molecular functional convergence, quantitative trait
Graphical abstract
Highlights
-
•
Searches for genome-wide quantitative genotype-phenotype associations
-
•
Uses phylogeny-aware models to account for non-independence of species data
-
•
Detects associations of homologous regions and molecular functional convergences
-
•
Tested and documented open-source package
The bigger picture
Life is a complex and varied phenomenon with a wide range of phenotypic and genotypic variations. The search for the putative genetic mechanisms associated with—and eventually playing causal roles in—the phenotypic differences between species remains a key question in biology. We introduce CALANGO, a comparative genomics tool to search for genome-wide genotype-phenotype associations across species, taking advantage of the large amounts of phenotypic data available for species with complete genomes. Our tool uses phylogeny-aware linear models to account for the non-independence of species data and can be used to detect both homologous regions and molecular functional convergences associated with phenotypes. Through two case studies, we show how CALANGO can be used to investigate the genomic and functional evolution of distinct complex phenotypes and to select targets for experimental characterization.
CALANGO is a comparative genomics tool that identifies genotype-phenotype associations across species. It accounts for the non-independence of species data and can detect homologous regions and molecular functional convergences linked to phenotypes. Using phylogeny-aware linear models, CALANGO can investigate the genomic and functional evolution of complex quantitative phenotypes across species and select targets for experimental characterization. This tool can help answer key questions about the genetic mechanisms underlying phenotypic differences between species.
Introduction
Living species exhibit a remarkable range of quantitative variation across both their phenotypes and genomic contents. Cellular organisms, for example, vary from unicellular species to complex multicellular lineages with hundreds of cell types.1 Land plants cover a spectrum from annual, small herbs to some of the tallest and longest-living organisms on Earth, including trees with lifespans spanning thousands of years.2 The genomic content of living organisms is equally diverse in terms of length and composition.3 A key challenge of contemporary biology is to understand the genomic mechanisms associated with the evolution of phenotypic differences between species.4 Advanced statistical methods are available for linking genes with phenotypes of interest within a given species, leading to significant breakthroughs in fields as diverse as complex genetic diseases and genetic breeding.5,6,7
Numerous databases and other data sources now offer unparalleled access to vast amounts of high-quality genome sequences and phenotypic variation data for thousands of species.8,9 Despite the vast phenotypic and genomic diversity observed across species, there is a surprising dearth of computational tools available for comparing genomes of distinct species and identifying quantitative associations between genotypes and phenotypes, in stark contrast to the sophisticated statistical tools that exist for intraspecific genotype-phenotype association studies.
The main bottleneck for the extraction of biologically meaningful knowledge from the joint analysis of phenotypic and genomic variation across species, therefore, no longer lies in obtaining such data. Instead, the biggest obstacle is now the integration and analysis of these heterogeneous data types in a biologically meaningful manner and under a comparative and evolutionary framework to survey genomic-scale data.4 Developing data-modeling schemas and statistical workflows to investigate genotype-phenotype associations in species sharing a common ancestor is a significant challenge since it is essential to account for the non-independence of species data due to common ancestry. Species that share a more recent common ancestor tend to exhibit greater phenotypic and genomic similarities compared with those sharing an ancestor further back in time. This fact creates dependencies on species data that limit the application of traditional association statistics in exploring genotype-phenotype associations.4,10
Furthermore, most comparative genomics strategies rely exclusively on the patterns of variation of shared homologous genes across genomes as the basic unit of comparison. However, this approach fails to capture molecular functional convergences of non-homologous genes fulfilling the same biological function in distinct genomes and contributing to the emergence of complex phenotypes.11,12 From computational and statistical perspectives, genomic-scale searches for genotype-phenotype associations require a tool capable of not only correcting for multiple hypothesis testing13 but also mitigating frequent biases in genomic data arising from usual bioinformatics procedures such as genome assembly, gene prediction, and annotation.14
Various approaches have been developed to compare genomes across species and explore the association between homologous regions and phenotypic traits.4 These methods have been effective in discovering associations between the presence/absence of homologous regions shared by distinct species and binary traits while also considering phylogenetic information. However, these tools do not currently offer ways to perform genome-wide searches for associations between quantitative phenotypic and genotypic variables or to identify molecular functional convergences linked to quantitative traits.
In this article we present CALANGO (comparative analysis with annotation-based genomic components), a general comparative genomics tool designed to address the aforementioned issues while searching for associations between quantitative phenotypes in distinct species or lineages and the abundance of annotation terms associated with sets of genomic components in the genomes of the same species. These annotations may reflect both distinct groups of homologous regions, as in traditional comparative genomics studies, or molecular convergences, where non-homologous regions fulfill the same biological roles contributing to the evolution of the same phenotype in distinct lineages.
We validated CALANGO using two case studies that differ in major aspects, such as evolutionary time, taxonomy, and biological phenomena under analysis. The first one comprises the analysis of the biological interaction of the bacteriophages genomes integrated into host genomes (prophages) in distinct Escherichia coli lineages, using the density of prophages as a proxy variable. The second evaluates the variation of a complex phenotype in a major group of eukaryotes, namely the evolution of plant height in angiosperms, a key trait for the ecology, physiology, and evolution of this group.15,16 We also compare the proposed approach with other comparative genomic tools that perform phylogeny-aware analyses to highlight the strengths, limitations, unique features, and capabilities of CALANGO.
CALANGO is provided as an open-source R package, which can be installed directly from The Comprehensive R Archive Network (CRAN) as well as from the project website (https://labpackages.github.io/CALANGO/), where usage examples and long-format documentation can also be found. CALANGO outputs interactive web documents and R objects, which facilitate sharing and fast communication of results and integration with existing bioinformatics pipelines.
Results
CALANGO: A brief overview
Genomes can be divided into different classes of functionally distinct elements, referred to henceforward as genomic components. At the highest level, genomes are made up of distinct types of genomic components such as coding and non-coding genes, together with their regulatory sequences (Figure 1A, “genomic annotation,” two genomic components observed in distinct genes from genome GEN_1 depicted as the brown and orange boxes). The decades-long effort to functionally characterize the distinct classes genomic components, together with the extensive usage of computational tools and databases, provides several possibilities to associate distinct genomic components with the biological functions carried out by them.18,19
Figure 1.

General structure of CALANGO
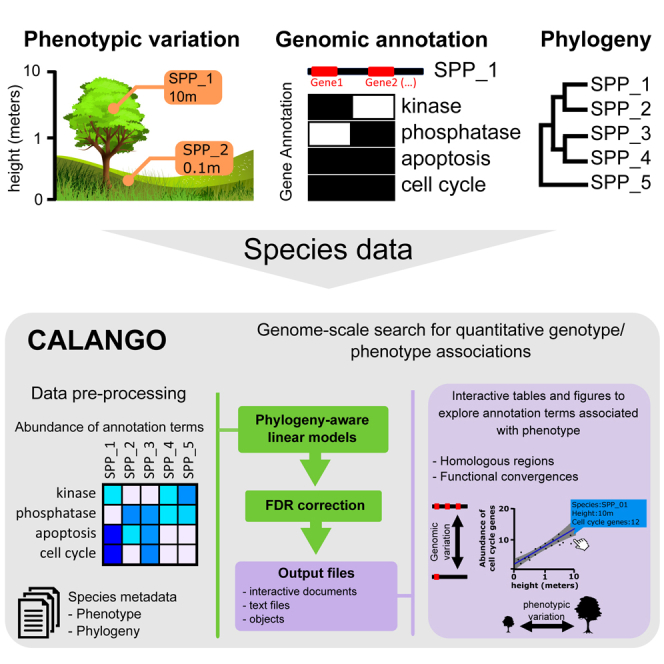
(A) Species-centered input data types needed to run CALANGO. To search for associations between the abundance of annotated genomic components across species and a quantitative phenotype of interest (quantitative values across lineages [QVALs]), CALANGO requires the following data types: (1) a set of genomic elements from distinct species and their associated annotation data (“genomic annotation,” represented in purple); (2) phylogenetic relationships across the same species to compute phylogeny-aware linear models and to cluster output heatmaps of associated terms (“phylogeny,” represented in black); and (3) a species metadata file describing groups for heatmap and boxplot construction, normalizing factors, and the QVAL vector to be surveyed for associations with annotation terms (“metadata”; phenotypic and normalization data represented in blue and red, respectively).
(B) CALANGO execution starts by reading the genome annotation data (“genome annotations”) and building raw annotation vectors for each species, defined as the number of occurrences of each annotation term per genome (“building of annotation vectors,” top purple arrow). CALANGO can perform optional data normalization to account for relevant variations in genomic content, such as genomes with vastly distinct numbers of protein-coding genes (“normalization,” red arrow). The matrix with the raw or relative abundances of annotation terms across species is then used, together with the quantitative phenotype vector (QVAL) and the phylogenetic data, to build phylogeny-aware statistical models for each annotation term by computing phylogenetically independent contrasts (PICs) as provided by the pic() function from the ape17 R package (“building of linear models from annotation terms,” green arrow and green box). The genome-wide search for genotype-phenotype associations is followed by multiple hypothesis correction. At this point, CALANGO integrates the domain-specific genome annotation that represents current biological knowledge (dictionary file) to produce output files containing the description of each annotation term (“production of output files,” bottom purple arrow).
(C) CALANGO outputs dynamical webpage reports, which can be accessed using any modern web browser and contain graphical and interactive data representations and summaries, including tables, heatmaps, scatterplots, and boxplots highlighting specific aspects of the associations detected. Our tool also produces a list object that can be integrated in other bioinformatics pipelines (data not shown). For a more detailed description of the annotation schemas, please refer to Figure S1.
This annotation procedure provides standardized biological knowledge readily available as dictionaries of biologically meaningful terms, referred to as annotation terms hereafter (Figure 1A, “genome annotation,” purple boxes denote distinct annotation schemas). These dictionaries commonly reflect shared evolutionary origins, such as the several conserved gene families found in distinct organisms (Figure 1A, purple box, “homology annotation”).20 Other dictionaries are built to reflect the functional similarities of genomic components by annotating non-homologous regions that fulfill the same functional roles or belong to the same biological pathways to the same annotation IDs (Figure 1A, purple box, “functional annotation”). The Gene Ontology (GO) annotation consortium provides an annotation dictionary intended to specify a universal, curated description of gene functions across species.21 GO annotation provides a conceptual scaffold of biologically meaningful terms and their relationships that can be used to perform comparative genomics at the function level.11,12
CALANGO provides a flexible platform for investigating the association of the variation in quantitative phenotypes across species/lineages in a phylogeny and the sets of genomic elements of these species when annotated using controlled dictionaries that reflect domain-specific biological knowledge. By dissociating genomic components from their annotation schemas, our tool allows comparative genomics analyses to survey distinct classes of genomic components, such as promoters, domains, or genes (Figure S1A). Additionally, by using distinct annotation schemas, CALANGO enables the search for associations of both homologous regions and functional molecular convergences as provided by the GO-based annotation (see supplemental experimental procedures, section “genomic data modeling,” for a full description of how genomic information is represented in CALANGO).
Our tool uses a set of species-centered data types as input: one annotation file per species containing pairs of genomic components IDs and their annotation term IDs; one dictionary file defining all annotation terms IDs; one fully dichotomous species tree with branch lengths proportional to the divergence times to compute phylogeny-aware linear models that take into account the dependencies on species data; and one metadata file describing species-centered data, including the quantitative phenotype/genotype vector to be used to search for associations (this vector is from now on referred to as quantitative values across lineages [QVALs]) (Figure 1A; for a more detailed description of our tool, please refer to the “analyzing data using CALANGO” section in the experimental procedures). CALANGO processes the genome annotation files and calculates annotation vectors that record the raw abundance (counts) of each annotation term in the full set of annotated genomic components of each species (Figure 1B, “building of annotation vectors”). At this point, it is possible to normalize the vectors containing the counts of annotation terms in different genomes (raw abundances) to account for variations in genome size and content, for example by normalizing the vector of annotation terms of each species by the total number of protein-coding genes of the same species (Figure 1B, “normalization”). This procedure generates normalized annotation vectors with the relative abundances of each annotation term in each species.
CALANGO proceeds by searching for associations between the abundance of each annotation term across all species and the QVAL vector (Figure 1B, green box, “building of linear models for annotation terms”). Our tool computes phylogeny-aware linear models that use the phylogenetic information to compute a set of two vectors of standardized and phylogenetically independent contrasts from the annotation vector and the QVAL vector.17 The output vectors are then used to build linear models and search for genotype-phenotype associations. Traditional association statistics are also available. At this point, our tool gathers individual p values for each model class, producing vectors of p values. These are corrected for multiple hypothesis using the Benjamini-Hochberg (BH) method.22 CALANGO outputs a dynamic webpage report compatible with modern browsers containing graphical elements and tables with association statistics and other useful quantities, intended to instigate users to interact and actively interpret the results. The full set of user-defined input parameters is also returned alongside all computed results as a list object, which can be easily integrated into other bioinformatics pipelines (Figures 1B, “production of output files,” and 1C).
We tested CALANGO with two case studies that differed in their evolutionary time, taxonomical ranges, and biological phenomena. The first studied the interaction between bacterial viruses (bacteriophages) and the bacterial species E. coli using the density of integrated viral genomes in bacterial genomes (prophages) as a proxy variable for this biological interaction. The second studied the evolution of plant height in angiosperms, a key trait for their ecology, physiology, and evolution. All data files needed to fully reproduce these results are distributed with CALANGO.
Case study 1: Coevolution of E. coli lineages and their integrated bacteriophages
E. coli have a remarkable genomic variability, with a considerable fraction of this variation comprising horizontally transferred genes through integrated bacteriophage genomes (prophages).23 This genomic diversity is reflected in the distinct ecological niches occupied by this bacterium, which is found in several body niches of animal hosts as a commensal or pathogen. Bacteriophage infections are not always deleterious to their bacterial hosts. While obligate lytic phages represent agents of cell death and population control, persistent lysogenic phages are responsible for gene transfer and mutualism. In a microbial population, the lysis-lysogeny events are dynamic and extremes of a continuum comprising antagonistic and beneficial biological interactions.24
Virulence factors are an archetypal example of bacteriophage-mediated horizontal gene transfer that can result in fitness increase for both new bacterial hosts and prophages, including pathogenic E. coli.25 Although this represents a well-known phenomenon, we are not aware of any systematic evaluation of the association between prophage occurrence and the abundance of non-homologous virulence factors. Since prophages are themselves genomic elements with specific coordinates, this case study also allows us to selectively remove the effect of viral genes on CALANGO’s results, enabling the potential investigation of associations of causal origin. Therefore, we consider this as an interesting scenario to evaluate our tool, as it has expected causal associations while also representing a complex biological interaction likely to contain previously undescribed biological phenomena.
We performed a thorough literature review to select 80 E. coli lineages with both gapless genomes (plus plasmids, when available) and reliable information regarding its pathogenicity status (Data S126 contains all genomes, together with their phenotypes and genes used for phylogenetic tree reconstruction; see also the supplemental experimental procedures, section “Escherichia coli data”). We proceeded by extracting the protein sequence for each protein-coding genes and performing a de novo annotation using InterProScan.20 At this point, we performed a domain-level representation of genomes where each non-overlapping conserved region as predicted by the Protein Families database (Pfam)27 was considered a distinct genomic element (Figure S1A, “domain-centered annotation”).
To assess the usefulness of GO in detecting molecular functional convergences, we annotated the same set of genomic components—the full set of protein domains identified in each bacterial genome by Pfam—using either their Pfam IDs (Pfam2domain) or the GO terms associated with them by InterProScan (Pfam2GO) (Figure S1B describes the annotation schemas). We used two metrics to compare different annotation schemas: (1) the abundance of each annotation term, defined as the sum of occurrences of an annotation term across all genomes, and (2) the prevalence of each annotation term, defined as the fraction of genomes where an annotation term was observed.
The annotation of non-homologous domains that fulfill the same biological function are expected to produce annotation terms that are both more abundant and more prevalent across genomes, as non-homologous regions are annotated to their shared biological roles (Figure 1A, “genomic annotation”). Therefore, these two metrics cand be used to assess whether GO annotation captures molecular convergences when compared with Pfam-based annotation. The annotation terms from Pfam2GO were significantly more abundant and prevalent than the terms from Pfam2domain annotation, indicating that GO annotation integrates the functional information of non-homologous elements and is suitable to represent molecular functional convergences of non-homologous regions that fulfill the same biological roles (p < 0.01, Wilcoxon test; see Note S1 for a more in-depth exploration of our findings).
Prophage density is associated with pathogenicity in E. coli
We first calculated the number of prophages in the chromosomal genome of each E. coli lineage using PHASTER.28 Pathogenic E. coli were found to have a significantly higher number of prophages, even after controlling for phylogenetic relationships (Figure 2, “prophage count,” Wilcoxon test [W] and phylogeny-aware model [PAM], cutoff for significance p < 0.01; see supplemental experimental procedures, section “statistical analysis of prophage abundance in pathogenic and non-pathogenic E. coli”).
Figure 2.

Associations between the number of prophages, genome length, prophage density, and pathogenicity in E. coli
Pathogenicity status: pathogenic, blue; non-pathogenic, red. p values computed using the Wilcoxon test (W) or a phylogeny-aware model (PAM); cutoff for significance: p < 0.01. Pathogenic E. coli have a significantly higher number of prophages (prophage count). We also found pathogenic lineages to have significantly larger genomes (genome size). To account for this variation in genome length, we computed prophage densities (prophage counts divided by genome sizes), which are also significantly greater in pathogenic E. coli (prophage density). These findings, together with the absence of significance between the two groups when considering only the fraction of the genome lengths after excluding the prophage contributions to genome size (genome size less prophages), strongly suggests that (1) pathogenic E. coli have a significantly higher number of prophages, (2) a large fraction of the genome variation in E. coli is caused by differences in prophage content, and (3) prophage density is arguably a good proxy to represent the prophage-bacteria biological interaction.
Pathogenic lineages also have significantly larger genomes (Figure 2, “genome size"). This fact could potentially explain the differences detected in prophage counts, as larger bacterial genomes may simply have a proportionally larger number of integrated viral genomes. To address this potential bias, we calculated prophage densities, defined as the ratio between number of prophages to genome size. We found that this variable was also significantly greater in pathogenic E. coli (Figure 2, “prophage density”). Furthermore, when we removed the contribution of regions predicted as prophages, the genome lengths were no longer significantly different between pathogenic and non-pathogenic E. coli, suggesting that the prophages make up a significant portion of the difference in the total genome lengths of our dataset (Figure 2, “genome size less prophages”).
We found a significant correlation between the numbers and the densities of prophages across genomes, as well as between these metrics and the total genome lengths (see Note S2). However, these associations were no longer present when prophage regions were removed from the analysis of genome length. We used the Pfam2domain dataset as input to CALANGO to examine the protein domains associated with the four variables analyzed in Figure 2 (see supplemental experimental procedures, section “experimental design,” for the full description of parameters). The list of protein domains associated with prophage density and prophage count are highly similar and, importantly, share almost no intersection with the domains found to be associated with genome length variation after excluding prophages (see Note S2). This finding suggests that these variables are measuring distinct types of associations. From these results, we conclude that (1) prophages are a major contributor to genome size variation in E. coli and (2) pathogenic E. coli strains have a significantly higher abundance of prophages in their genomes, even after accounting for their larger genome sizes. Prophage density may therefore be a suitable proxy for further studying the biological interactions between prophages and their hosts and was used as the QVAL in the subsequent analyses.
Homologous regions and biological roles associated with prophage density in E. coli
We found 230 out of the 3,729 (6.2%) Pfam domains observed in at least one genome from our E. coli dataset to be significantly associated with prophage density when using the raw count data of annotation terms. Since CALANGO allows the normalization of annotation term abundances by genome, we used the total number of genomic elements to compute the relative frequencies of annotation terms while searching for associations to further evaluate our tool. We found a high degree of concordance for the positive associations using both abundance metrics (Note S3). Although all the negative associations identified using raw counts are also detected using relative frequencies, a considerable number of the negative associations are exclusively identified through the use of relative frequencies. This phenomenon is an artifact caused by the non-independence of relative frequencies since they must sum to one. Specifically, the expansion of annotation terms that are truly associated with a phenotype (i.e., positive associations) creates the appearance of negative correlations among annotation terms that have little or no variation in their raw count data (Note S3). As this bias is caused when using frequency data alone, we proceed by using the raw count data of annotation terms hereafter.
Of the 230 associated domains, 207 presented positive correlation (from 0.28 to 0.85) and 23 showed negative correlation (from −0.26 to −0.47) (Data S2, sheet “domain2PfamCount”).29 Figure 3 is a heatmap of the associated terms as produced by CALANGO (rows), together with our manual annotation of the larger clusters of domains associated with prophage density (columns). This graphical output integrates phylogenetic information (the species are clustered based on the user-provided phylogenetic tree), together with the user-defined classes (pathogenic versus non-pathogenic in this case), allowing the visual detection of interesting clustering patterns.
Figure 3.

Heatmap as produced by CALANGO integrates phylogenetic, phenotypic, and annotation data
Species clustering is based on user-provided phylogeny. Each cell of the heatmap contains additional information that can be accessed through “on mouseover” events in the heatmap output as produced by CALANGO (also available as a vignette with the R package). Pathogenic and non-pathogenic lineages are distributed with no clear broader grouping pattern, suggesting that both phenotypes emerged and/or were lost several times during the evolution of these lineages. Two pathogenic E. coli groups have the highest count of several of the associated domains (clusters 1 and 2, highlighted at the bottom), including virulence factors known to be horizontally transferred by bacteriophages and components of the viral life cycle. These lineages comprise enterohemorrhagic (EHEC) and enteropathogenic (EPEC) pathotypes, including all O157:H7 lineages, a Shiga-like toxin-producing serotype, and an important source of foodborne disease.
Most positively associated domains (125/207 domains, 60.4%) have clear roles in the viral life cycle, such as lysozymes and integrases (see Data S2, sheet “domain2PfamCount,” for the manual curation of all associated homologous domains).29 Figure 4A illustrates a typical output of the CALANGO package for one of these domains (additional examples available in Note S4). The second largest category of positive associations encompasses several classes of virulence factors (58/207 domains, 28%) (Figures 3 and 4B). Some of these virulence factors, including Shiga-like toxins and effectors of the type III secretion system, are frequently horizontally transferred by bacteriophages in specific E. coli pathotypes,25,30 an association also detected by CALANGO (Figure 3, species clusters “1” and “2”; see also Note S4). The association of domains from the viral life cycle and virulence factors with prophage densities provides a sound example of how CALANGO can uncover known associations of causal origin.
Figure 4.

Homologous regions and GO terms associated with prophage density in E. coli
From left to right: linear models (QVALs and annotation term counts, q values as provided by CALANGO), phylogeny-aware linear models (PIC values for QVALs and for annotation term counts, q values as provided by CALANGO) and boxplots with count data values of annotation terms in the user-defined groups (p values computed using a PAM as described in the supplemental experimental procedures, section “statistical analysis of prophage abundance in pathogenic and non-pathogenic E. coli”). For boxplots, the statistical test surveys possible differences in the abundance of annotation terms when comparing the pathogenic and the non-pathogenic groups using the PAM test (supplemental experimental procedures, section “statistical analysis of prophage abundance in pathogenic and non-pathogenic E. coli”; test executed using the annotation term abundance instead of prophage abundance). From top to bottom: examples of annotation terms (distinct protein domains as defined in Pfam and annotated using either Pfam IDs or GO IDs) playing roles in (A) viral life cycle (PF00959, phage lysozyme); (B) virulence mechanisms (PF06416, effector protein NleG); (C) viral process (GO: 0019058, viral life cycle); (D) pathogenicity (GO: 0009405, pathogenesis); and (E) stress response mechanisms (GO: 0006950, response to stress).
Some domains of unknown function (DUFs) have a distribution pattern similar to that of virulence factors, potentially suggesting uncharacterized pathogenicity domains and demonstrating how CALANGO can be used to prioritize targets for experimental investigation. CALANGO also highlighted positive associations that unveil previously unknown biological interactions between immune genes found in bacterial genomes, prophages, and other classes of mobile elements, such as transposases and plasmids. Several of these homologous regions are located outside prophage regions, which may suggest a complex interplay of symbiosis and competition between them (Figure 3; see also Note S4).
The 23 negative associations suggest that E. coli lineages with fewer integrated prophages—which are also less likely to be non-pathogenic—have a set of genes enabling a greater diversity of lifestyles at several levels, ranging from metabolic pathways and membrane transport to community-level processes, such as biofilm formation (Figure 3; see also Note S5 for the examples of negative associations). Interestingly, we observed negative associations of prophage density and components of the cell wall and of the lipopolysaccharide (LPS) biosynthesis pathway. Both classes of molecules are receptors of bacteriophages for cellular infection but are also major activators of the vertebrate immune system.31,32,33 These undocumented negative associations may be a consequence of the selective pressure against prophage infection resulting in the loss of these components. However, these losses can also confer an advantage to pathogenic bacteria when infecting vertebrate hosts, as they may be less likely to trigger the host’s immune responses and could represent a previously unknown aspect of the emergence of a virulence phenotype in this species.
The results provided by the domain2GO schema largely support the same conclusions found by our manual curation of the domain2Pfam results for both positive and negative associations, highlighting how GO annotation provides an interpretability that appears to be qualitatively equivalent to human curation (Figure 4C; Data S2, sheet “domain2GOCount”; see also Note S6 for additional examples).29 Additionally, several of these biological roles associated with prophage density are performed by non-homologous domains. For example, a total of 23 non-homologous virulence factors in our dataset are automatically annotated by InterProScan to the GO term GO: 0009405 (pathogenesis), which was found to be associated with prophage density (Figure 4D). These results further demonstrate how CALANGO, together with a GO-based annotation, allows comparative genomics analysis at the function level suitable for the detection of molecular functional convergences.
Interestingly, we found a positive association of the term GO: 0006950 (response to stress), which may represent a previously unknown example of virus-mediated transfer of non-homologous fitness genes that fulfill a common biological role, such as was seen for the non-homologous virulence factors (Figure 4E; see Data S2, sheet “stress_response_genes,” for the full list of domains annotated to this GO).29 Among the domains annotated to this GO, we observed components of restriction-modification systems, DNA repair pathways, colicins, toxin-antitoxin systems, tellurite resistance, and transcription factors. We hypothesize that integrated prophages could also contribute to fitness increase of bacteria specifically under conditions of stress, such as the host’s immune response against pathogenic bacterial lineages.34 This finding comprises yet another dimension of this complex biological interaction and provides evidence of how the functional annotation provided by GO terms can support the detection of previously unknown associations of functional molecular convergences associated with QVALs.
Since prophages are genomic elements with defined genomic coordinates within bacterial genomes, this case study allows us to perform a controlled in silico experiment to evaluate the ability of CALANGO to support the investigation of a potential causal relationship (see supplemental experimental procedures, section “removal of genes of viral origin in E. coli genomes”). A considerable number of the annotation terms are associated with the prophage density because they annotate protein-coding genes of viral origin that are located within prophage coordinates. This experiment consisted of reexecuting CALANGO holding the QVALs fixed (i.e., as calculated previously) while removing all genes of viral origin. This effectively blocks out possible effects of prophage genes on the output of CALANGO, allowing us to test whether the significant associations detected earlier between the annotation terms and the QVALs are indeed due to genes of viral origin.
As expected, most protein domains manually annotated by us as being of viral origin were no longer significantly associated with prophage density after the removal of genes of viral origin (123/125, 98.4%). A similar pattern was found for the associated GO terms (Data S2, sheets “domain2PfamCountLessPhages” and “domain2GOCountLessPhages”; see also Note S7).29 Interestingly, several classes of virulence factor domains were still significantly associated with prophage density after the removal of genes of viral origin, a scenario compatible with bacteriophage-mediated horizontal gene transfer followed by prophage degeneration (Data S2, sheet “virulence_factors,” columns “sum,” and “sum_less_phages”).29 However, other homologous groups of virulence factors were totally or mostly located within detectable prophage genomes and consequently were not found to be associated after blocking the effect of viral genes. This observation suggests a synergistic interaction between virulence factors acquired from different evolutionary origins.
This in silico manipulative experiment exemplifies the ability of CALANGO to support the investigation of basic causal relationships by enabling a level of counterfactual investigation of observed associations in the data. While this is still short of a fully developed causal inference package for genomic data, the ability to uncover some causal relationships from data by in silico isolation and testing of the influence of putative confounders can provide valuable insights into biologically meaningful phenomena, as illustrated in this case study.
Case study 2: Homologous regions associated with maximum height in angiosperms
Maximum height is a key trait in the ecology, physiology, and evolution of land plants, and the understanding of the molecular mechanisms associated with the emergence of this complex phenotype has impactful consequences for fields as diverse as conservation biology and agriculture.35,36 Angiosperms, or the flowering plants, are the largest and most diverse group of land plants, displaying a remarkable phenotypic variation, including in plant height. Artificial selection experiments within single species supports the notion that plant height is a trait strongly controlled by genes that can evolve fast under phenotypic selection.16,37
The relationship between height and reproductive success has been suggested to be a result of several factors, such as increased pollination, improved seed dispersal mechanisms, and better access to light. As a result, tall species that evolved from short ancestors likely experienced positive selection for height, a trait that is potentially under selection in natural populations.16 Importantly, shorter plants have smaller generation times and, consequently, higher rates of evolution, which provides a greater capacity of phenotypical adaptation in distinct environments. In contrast, taller species typically exhibit lower evolutionary rates due to their longer generation times, which presents a significant concern for the long-term sustainability of ecosystems that depend on them.38 Despite the importance of understanding the evolutionary trajectory of this phenotype across different species from a comparative genomics perspective, such studies are currently lacking.
The evolution of a complex phenotype like height is likely coupled with many other plants traits, such as rates of mitosis in meristematic tissues, cell expansion, development of leaves and reproductive organs, pollination syndrome, longevity, and community composition, among others, and plays important roles in the success of establishment of distinct species.15,35 As such, the evolution of height in angiosperms represents a compelling case study to further evaluate CALANGO and demonstrate its usefulness to reveal biological knowledge.
Protein domains associated with maximum height in angiosperms unveil independent expansions of reproductive processes in taller species
We surveyed the specialized literature and sequence databases, together with our in-house annotation pipeline, to gather the annotation, phylogenetic, and QVAL information for the 54 angiosperm species with high-quality, non-redundant proteomes available (Data S339; see also supplemental experimental procedures, section “angiosperms data”). Our dataset has species with maximum height varying from 20 cm (the wild strawberry Fragaria vesca, Rosaceae) to 55 meters (the tree Eucalyptus grandis, Myrtaceae), more than two orders of magnitude (Figures 5A and S2A). We found the ancestor states of height in angiosperms to be highly uniform, with internal nodes having mostly average values and phenotypic extremes occurring multiple times, a pattern compatible with independent emergence of this trait (Figure S2B).
Figure 5.

Evolution of maximum height in angiosperms
(A) Maximum height variation across the phylogeny of 54 angiosperms species with high-quality proteomes available suggests multiple independent increases and decreases in maximum length in this group. Species names are as follows: Aco, Ananas comosus; Aha, Arabidopsis halleri; Ane, Arabis nemorensis; Ath, Arabidopsis thaliana; Ati, Amborella trichopoda; Aya, Acer yangbiense; Bdi, Brachypodium distachyon; Bst, Boechera stricta; Bsy, Brachypodium sylvaticum; Bvu, Beta vulgaris; Can, Capsicum annuum; Cba, Capsicum baccatum; Cca, Cajanus cajan; Cch, Capsicum chinense; Ccl, Citrus clementina; Cka, Cinnamomum kanehirae; Cli, Carex littledalei; Cmi, Cinnamomum micranthum; Cmo, Castanea mollissima; Csa, Cannabis sativa; Csi, Citrus sinensis; Cun, Citrus unshiu; Cvi, Cleome violacea; Dso, Descurainia sophioides; Egr, Eucalyptus grandis; Egt, Erythranthe guttata; Fve, Fragaria vesca; Jcu, Jatropha curcas; Lsa, Lactuca saligna; Mba, Musa balbisiana; Mco, Macleaya cordata; Mno, Morus notabilis; Nco, Nymphaea colorata; Obr, Oryza brachyantha; Ome, Oryza meyeriana; Osj, Oryza sativa; Pav, Prunus avium; Pdu, Prunus dulcis; Pgr, Punica granatum; Plu, Phaseolus lunatus; Pmu, Prunus mume; Ppr, Prunus persica; Pvu, Phaseolus vulgaris; Rco, Ricinus communis; Rru, Rhamnella rubrinervis; Sbi, Sorghum bicolor; Soe, Syzygium oleosum; Sol, Spinacia oleracea; Stu, Solanum tuberosum; Tca, Theobroma cacao; Tor, Trema orientale; Tth, Thalictrum thalictroides; Van, Vigna angularis.
(B) Examples of protein domains significantly expanded in taller plants fulfilling different biological roles. From top to bottom: (1) increase of genetic diversity through cross-pollination (SI system) (PF00954, S-locus glycoprotein domain), (2) cell wall biology (PF11721, Malectin domain), and (3) immunity and stress response mechanisms (PF13855, leucine-rich repeat). From left to right: phylogeny-aware linear models using relative frequency data of annotation terms (q values computed from linear model statistics as reported by CALANGO) and boxplots with relative frequencies of annotation terms (p values computed using PAMs as described in the supplemental experimental procedures, section “statistical analysis of prophage abundance in pathogenic and non-pathogenic E. coli,” replacing count values and phenotypic classes by angiosperm data for the corresponding domains). In the boxplots, we searched for differences in plants in three groups of plants based on their heights: less than one meter, 1–10 meters, and more than 10 meters.
(C) Biological processes significantly enriched in protein-coding genes from A. thaliana containing the domains associated with maximum height in angiosperms suggests that the expanded domains found in taller plants are enriched in biological processes also needed for increased lifespan.
We again used the domain2Pfam and domain2GO annotation schemes to search for homologous regions and biological roles associated with maximum height (log10 transformed values used as QVALs). Angiosperm is a lineage where whole-genome duplication events are relatively common.40,41,42 This phenomenon may bias association studies that consider only the raw counts of abundance terms and is an example where the normalization of the raw abundance values of annotation terms may be desirable. However, using relative frequencies to correct for distinct proteome sizes may introduce other biases, as we demonstrated in the first case study (Note S3). For these reasons, in this case study, we considered associated annotation terms only the ones found as associated when considering both their raw counts and relative frequencies (see supplemental experimental procedures, section “experimental design for case studies”).
From a total of 5,381 domains with at least one copy across the non-redundant proteomes of all angiosperm species, we identified seven that displayed a significant positive association with the maximum heigh (see Data S4, sheet “associated_domains”43; see also Note S8). Even though a considerable fraction of the genes coding for these domains are hypothetical sequences with no known biological roles, the experimentally validated genes in Arabidopsis thaliana have roles in embryogenesis, cell wall signaling, immunity, and reproductive processes (Figure 5B; Note S8; see also Data S4, sheet “Arabidopsis_genes”).39
Self-incompatibility (SI) systems are non-homologous molecular mechanisms that prevent inbreeding and promote outcrossing in flowering plants.44 Three of the domains associated with maximum height in angiosperms are components of the most well-characterized SI system (e.g., Figure 5B, “PF00954 – S-locus glycoprotein domain”). We found 37 copies of PF00954—a signature domain of the most well-studied SI system—in A. thaliana (maximum height of 0.30 meters, the eighth smallest plant in our dataset), while Eucalyptus grandis (maximum height of 55 meters, the tallest plant in our dataset) has 210 copies of this domain (a 5.68-fold increase). The remaining two components of the SI system have similar expansion profiles (Data S4, sheet “associated_domains”).39
The SI system found by CALANGO (from now on referred simply as “SI”) has been described in exquisite molecular details in the Brassicaceae family, even though it is widely distributed in flowering plants, and is an archetypal example of natural (balancing) selection maintaining genetic variation over long evolutionary times through inbreeding avoidance and rare-allele advantage.44 The SI system is a mating barrier controlled by a single highly polymorphic locus (S-locus), which codes for two closely linked genes. One gene codes for the S-locus receptor kinase (SRK), a glycoprotein with kinase activity that allows stigma cells to discriminate between pollen from the same organism or from genetically related individuals. The three associated domains that are also components of the SI system are observed in SRK genes. The second gene codes for the S-locus cysteine-rich protein (SCR), expressed in pollen coat and the ligand of SRK.45 In the case of self-fertilization, the SCR protein in pollen is structurally complementary to the SRK protein found in the same S-locus haplotype, activating a signaling pathway that inhibits pollen tube development.
Individuals in a population that share a recent common ancestor are more likely to share a considerable fraction of their alleles, including the alleles observed in the SI loci. Given this scenario, a higher percentage of the fertilization events of these individuals would be unsuccessful, as the common shared alleles would activate the SCR-SRK signaling pathway and prevent fertilization. Unrelated individuals that share no recent common ancestors, in contrast, are more likely to be more genetically diverse. This includes a potentially greater diversity of alleles observed in the SI loci, therefore increasing their rates of successful fertilization. These successful events are also likely to increase the genetic diversity of the offspring. This is because the seeds that result from such events would have been produced by the reproduction of unrelated individuals that are genetically dissimilar. Not surprisingly, the S-locus is highly polymorphic and has been extensively characterized in several populations across multiple species and in distinct ecological contexts.44
The independent expansion of the number of genes coding for the S-locus in taller species increases the total number of alleles potentially hosted in the genome of a single organism of these species. This would increase the chance of related individuals from the same population sharing S-locus alleles, therefore increasing the fraction of possible incompatible individuals in these populations. Under these circumstances, successful fertilization events would have a greater chance of outcrossing in species where individuals can potentially host a greater number of S-locus haplotypes, therefore allowing taller plants to increase their evolutionary rates through successful cross-pollination events between more unrelated individuals.
Taller plants have lower rates of molecular evolution, presumably due to their longer generation times and slower long-term rates of mitosis in their apical meristems. The lower evolutionary rate in these species is a concern for their long-term survival and for the various ecosystems where they play critical roles.38 CALANGO revealed a molecular mechanism that can promote outcrossing in taller species with longer generation times and may counterbalance their lower evolutionary rates. The unexpected association of a major reproductive mechanism that increases genetic diversity and height variation in angiosperms can have significant implications, as the evolutionary future of taller species relies on their adaptation to changing environments, which fundamentally relies on their underlying mutation rates.46
Even though no GO term was found to be significantly associated with the maximum height, an enrichment analysis using the 457 A. thaliana genes annotated to these seven Pfam domains found an overrepresentation of genes belonging to reproduction and embryogenesis pathways, as well as of genes involved in secondary growth, immune system, and stress response mechanisms (Figure 5C; see also supplemental experimental procedures, section “enrichment analysis of A. thaliana genes”’). The increase in the number of genes coding for some of these processes, such as immunity and wood tissue development, has already been reported for Populus trichocarpa—a model organism for tree biology—when compared with A. thaliana.47 The expansions of immune and stress response genes families are likely to represent adaptations required for the longer lifespan of taller species, which results in the exposure to long-term infections and to a myriad of stress sources. Importantly, P. trichocarpa has not been included in our analysis due to a large amount of gene duplication events detected by our pre-processing pipeline. Therefore, CALANGO provides independent evidence supporting the previous report of the association between genes fulfilling these biological roles and the emergence of taller species. As several of the genes containing these domains are hypothetical, they also comprise interesting targets for downstream characterization to search for new components of plant immunity and developmental processes.
Comparison of CALANGO with conceptually similar software
As recently reviewed by Lázló et al., some tools are currently available to search for associations between the patterns of occurrence of homologous genomic components (mostly single-copy genes) and a binary phenotype of interest across species while considering phylogenetic dependency.4 One important distinction between CALANGO and these tools is the class of phenotypic and genotypic data accepted by them. Most methods can only be used to investigate secondary gene losses associated with categorical phenotypes (presence/absence). While useful to describe several types of biological variation, these methods cannot be used to survey quantitative phenotypic data without the usage of ad hoc thresholds to define classes. In this aspect, the proposed tool considerably expands the strategies currently available to search for associations between genomic components and phenotypic data across species, as CALANGO is intended to search for quantitative genotype-phenotype associations by considering the copy-number variation of genomic components across genomes. By dissociating the genomic components from their functional annotation, CALANGO also provides the unique flexibility to survey the distribution of several classes of genomic components, such as protein domains or entire genes.
Furthermore, despite being successful in detecting homologous regions associated with the emergence of complex phenotypes, at the time of writing, none of these methods incorporate current genomic knowledge at the function level as provided by GO annotation. Instead, they exclusively evaluate associations between sets of homologous elements across genomes and phenotypic data. GO terms have been shown to capture patterns of functional convergence and to provide a deeper biological comprehension of the genomic evolution of complex phenotypes, such as parasitism and sociality, and can provide a functional landscape for comparative genomics at the molecular function level.11,12
The distinct annotation schemas supported by CALANGO allow both the emulation of classic comparative genomics analysis (by using a homology-based annotation dictionary) and of pathway- or function-based comparison (by using a GO-based dictionary). As illustrated in our first case study, the combination of both strategies delivers a richer, more biologically meaningful interpretation of the results, including the detection of functional molecular convergences that could not be discovered using homology-based annotation. Also, in contrast to virtually all the tools reviewed by Lázló, most of which provide text files as the main output, the CALANGO package produces a rich set of dynamical output result files that can be visualized in any modern browser. These files contain statistical summaries and other useful quantities, together with their visual representations. For advanced users, CALANGO provides all results as a list of standard R objects, therefore allowing easy integration with other computational pipelines.
Discussion
The post-genomic era has brought a plethora of high-quality sequenced genomes, ranging from previously underrepresented early branching lineages of cellular organisms to thousands of genomes of a single bacterial species. In contrast to this abundance of genomic data, there are currently a deficiency of methods in computational statistics for extracting genomic properties associated with a quantitative phenotype of interest across genomes while considering the non-independence of species data.4 CALANGO addresses this gap in the comparative genomics field by integrating phylogenetic, genomic, annotation, and phenotypic data together in order to perform this task.
Our two case studies comprise datasets that are highly contrasting in terms of evolutionary time, taxonomic diversity, and the nature of the quantitative phenotype/genotype under analysis. The first evaluated the biological roles associated with the change of a complex genotype (the density of prophages) in a single bacterial species when used as a proxy for the virus-bacteria biological interaction. We found, as expected, a considerable association with genes of viral origin. By removing these genes and blocking their effect from the analysis, this case study allowed us to demonstrate how CALANGO can support the investigation of causal associations. We also observed several unknown associations at the function level that point to a much richer scenario of the biological interaction between bacteria, their prophages, and other classes of mobile elements. We emphasize how the horizontal acquisition of adaptive genes, such as virulence factors and stress response genes, may allow bacteria to thrive in distinct environments.
The second case study detected domain expansions associated with a complex phenotype (maximum height) in the flowering plants, a major group of multicellular eukaryotes. Tall plants have morphological and physiological adaptations to the challenges of growing vertically36 and concomitantly harbor several advantages in dispersal and establishment success rates.15 Our case study described several mechanisms that improve our understanding of the genomic regions and molecular mechanisms associated with the emergence and maintenance of this complex phenotype. Of special interest, we described a reproductive strategy that may allow taller plants to increase their genetical diversity through the independent expansion of the S-locus in these species and the allocation of more resources to cross-pollination, a fact with long-reaching consequences for fields as diverse as agriculture and conservation biology. More importantly, we demonstrated how our tool produces testable hypotheses in both case studies, indicating how it can be used to prioritize downstream targets for experimental characterization.
For future improvements, we intend to incorporate statistical methods that allow the detection of associations between the abundance of annotation terms and discrete phenotypes. While our tool is capable of detecting causal associations, we acknowledge that CALANGO is not designed for causal inference. Developing comparative genomics tools that can explicitly model causal relationships while searching for genotype-phenotype associations across species is a key question in biology and an area of future research.
CALANGO represents a considerable step toward the establishment of an annotation-based, phylogeny-aware comparative genomics framework to survey genomic data beyond the sequence level and to search for associations between quantitative phenotypes across lineages sharing a common ancestor and the multiple layers of biological knowledge coded in their genomes.
Experimental procedures
Resource availability
Lead contact
Request for further information will be fulfilled by Francisco Pereira Lobo (franciscolobo@ufmg.br, franciscolobo@gmail.com).
Materials availability
This study did not generate new unique materials other than the code and data as described below.
Analyzing data using CALANGO
Input data
The genomic features, annotation, and dictionary files’ input data are simple tabular text files containing textual information used to describe genomic elements and their annotations (Figures S1A and 1A; see the supplemental experimental procedures, section “genomic data modeling”, CALANGO’s documentation, and example files for a deeper explanation on data files and formats).
-
-Annotation/dictionary data: we provide a Perl script (calanguize_genomes.pl) that parses GenBank files into high-quality genomic annotation data compatible with CALANGO input data (Figure 1A, “genomic annotation”). This de novo annotation is intended to both allow non-model organisms to be analyzed using CALANGO and also to remove potential biases found in data from model organisms arising from an excess of annotation information.49 The script performs the following steps:
-
(1)Downloads genomic data for the species/individual to be analyzed.
-
(2)Extracts the protein-coding genes described.
-
(3)Provides a single coding sequence per locus, reporting only the longest coding sequence per locus to avoid possible biases introduced due to the larger number of isoforms described for model organisms.1
-
(4)Executes BUSCO for genome completeness evaluation.14
-
(5)Annotates de novo all valid protein sequences using InterProScan.20
-
(6)Generates CALANGO-compatible files for annotated genomes and dictionaries of annotation terms (Figure 1A, “genome annotation”).
-
(1)
-
-
Phylogenetic tree data: CALANGO currently supports fully dichotomous, ultrametric trees in the newick or nexus formats (Figure 1A, “phylogeny”). Trees with multichotomies are converted into a dichotomous tree with branches of length zero to be compatible with the pic() method from ape R package,17 used to create the phylogeny-aware linear models.
-
-
Metadata: CALANGO expects a metadata file containing a vector with a quantitative value to be used for genome-scale association searches (QVAL), groups for heatmap and boxplot visualization, normalization factors, and other information needed for proper execution (Figure 1A, “metadata”).
Initiating data analysis
CALANGO starts its analysis with (1) a set of genomic components from distinct genomes annotated using a common, controlled set of annotation terms; (2) a dictionary file defining each annotation term in a biologically meaningful way; and (3) a metadata file containing species-centered information, such as values for optional normalization of annotation count values in each species (e.g., total count of annotation terms per genome), and the QVAL information vector with the quantitative phenotypes in the search for genome-wide genotype-phenotype associations (Figure 1A). Users must also provide (4) an ultrametric phylogenetic tree containing all lineages in a given analysis, which allows CALANGO to correct for phylogeny-related dependencies in the values of abundance of annotation terms in distinct genomes and in the QVALs.50
The annotation and dictionary files can be generated for non-model organisms by using associated helper scripts distributed with our tool to generate and parse de novo annotation data from InterProScan20 to CALANGO-compatible input annotation files. As these input archives are simple tab-delimited text files, these can also be easily produced by in-house tools to represent user-defined annotation schemas.
Based on these input files, CALANGO proceeds by processing genome annotation data and computing an annotation vector for each species, defined as the total number of observations of each annotation term in the full set of genomic components of a species (Figure 1B, “building of annotation vectors, table “annotation vectors” contains the representation of all annotation vectors for the distinct species). As an example, if analyzing homologous regions as defined by the Pfam database, this vector would contain the number of times each Pfam domain—as defined in the dictionary file linking Pfam IDs to their definitions—was observed when considering all protein-coding genes in a genome. Importantly, even though we used only Pfam IDs and their associated GO IDs as annotation terms in our case studies, CALANGO can use any type of annotation schema that encompasses genomic elements and their annotation terms.
Each annotation vector can be optionally normalized to produce relative fractions of annotation terms using, for instance, the total number of protein-coding genes or the total number of annotated regions. This step is intended to provide a fair comparison in scenarios where distinct genomes have a considerable variation in their coded proteome size or annotation coverage. At the end of this step, CALANGO contains a vector containing the relative or absolute abundance of annotation terms for each genome (Figure 1B, “normalized annotation vectors”). If users provide a GO-based annotation, CALANGO computes count values for terminal GO terms and also for internal nodes of the GO graph using functionalities provided by the GO.db and AnnotationDbi R packages.
The next step of our algorithm performs a genome-scale search for annotation terms associated with the quantitative phenotype/genotype of interest, represented as the QVAL vector (Figure 1B, green box, “building of linear models for annotation terms”). Our tool computes different classes of association statistics between the QVAL vector and the abundance of each annotation term: three commonly used correlation statistics (Pearson, Spearman, and Kendall correlation values) and a phylogeny-aware linear model constructed using phylogenetic independent contrasts (PICs) as described in the classic article by Felsenstein and implemented in the ape R package through the pic() function.17,50
One key assumption of linear regression analysis is that the residual error in the model is independently and identically distributed. This premise is no longer true when analyzing data from species that descend from a common ancestor, as closely related species are commonly more phenotypically and genotypically similar than distant ones. The pic() function computes standardized differences in trait values for the internal nodes in a phylogeny, taking advantage of the fact that speciation events are independent. Standardization is performed by dividing the raw contrasts computed for each internal node in a phylogeny by a value proportional to its expected standard deviation under the Felsenstein50 model, which assumes trait changes over time following a Brownian motion with normal distribution, a mean of zero, and a variance of σ2. Under a Brownian motion model, these standardized contrasts are independent and identically distributed and can be used in a variety of statistical tests, including the phylogeny-aware linear models computed by CALANGO.
At this point, CALANGO access individual p values for each test (traditional association statistics and phylogeny-aware linear models) to produce lists of p values. To account for the multiple hypothesis scenario of simultaneously searching for associations between QVAL and thousands of annotation terms, CALANGO reports false discovery rate (FDR)-corrected q values for each list of p values from distinct association statistics (Benjamini-Hochberg [BH] method).
CALANGO additionally computes the variance and standard deviation of annotation term counts, together with two customized statistics that summarize how abundant an annotation term is and how frequently it is observed: the sum of annotation terms and their prevalence (fraction of genomes where an annotation term is observed). These statistics are intended to provide users with a useful set of tools to quickly identify interesting associations and also to detect potential spurious results (we provide post-analysis filtering examples in the example page containing the output data for the two case studies; https://labpackages.github.io/CALANGO/articles/examples-page.html). These metrics have also been used to demonstrate some properties of the domain2Pfam and domain2GO annotations.
Two main output structures are provided (Figure 1C). The first is a list-type R object containing all computed results, which can be used to survey specific downstream hypotheses and also to be integrated in other bioinformatics pipelines (data not shown). This object also contains all input parameters used to generate the results, therefore providing a simple and convenient way to share results as well as all necessary parameters required for full reproducibility. The second output is a fully interactive web document that can be easily shared, hosted online, or browsed locally using any modern web browser. The CALANGO outputs were designed to facilitate more transparent reporting of results and sharing of raw data and code. This user-friendly output facilitates the critical evaluation of all statistics provided by CALANGO in a dynamic tabular and graphical manner.
Four kinds of interactive results are provided by the tool. The first is a biclustered heatmap based on annotation terms (clustered based on their values) and species under analysis (clustered according to the user-provided phylogenetic tree), which allows easy inspection of annotation term distribution across phylogenetic groups and refinement of questions based on interactive exploration of the graph (Figures 1C and 3 contain examples of a typical output of CALANGO manually annotated for publication). The second comprises interactive scatterplots of annotation terms as distributed by their corrected q values arising from PAMs and from other association tests. Dot size and transparency are used to highlight interesting annotation terms (both highly frequent and variable across species).
The third type of output is a dynamical table where users may further explore and filter results. Each line contains several computed statistics related to a single annotation term (e.g., correlation values, q values for PIC linear model and other correlation tests, abundance, prevalence), as well as the raw counts of that annotation term in each genome. This table allows users to filter results based on any data column, selecting data slices for further inspection. The dynamic table also contains links to the fourth type of interactive output: individual plots with the distribution of associated annotation term, which includes scatterplots, linear model trend lines and confidence bands for actual data values, ranked data, and phylogenetic-aware linear models, together with violin plots with superimposed raw data, allowing users to visually inspect how the abundance of annotation terms is distributed in the distinct user-defined groups. The heatmap in Figure 3 and the association scatterplots in Figures 4 and 5B are examples of CALANGO’s graphical outputs.
Acknowledgments
We would like to express our appreciation toward the anonymous reviewers, whose constructive suggestions substantially improved the quality of the article. We would like to thank Prof. Daniel dos Santos Mansur and Prof. Glória Regina Franco for the insightful discussions during the elaboration of this research. We also would like to thank the artists that shared the images used in our graphical abstract and in Figure 1 (Creative Commons Zero 1.0 Public Domain License, original images available at https://openclipart.org/detail/315185/landscapetree120220192, https://openclipart.org/detail/319209/cat-and-mouse, and https://openclipart.org/detail/171806/elephant). This work was supported by the Coordenação de Aperfeiçoamento de Pessoal de Nível Superior (CAPES)/Brazil Finance Code 001, the Graduate Program in Genetics/UFMG, and the Graduate Program in Bioinformatics/UFMG.
Author contributions
Conceptualization, F.P.L.; methodology, J.A.H. and F.P.L.; software, J.A.H., G.M.d.C., T.T.M.d.S., E.L.I., L.M., F.C., and F.P.L.; validation, J.A.H., A.P.A.M., A.C.R.P., L.-E.D.-B., A.V.C., G.M.d.F.A., F.C., and F.P.L.; formal analysis, F.C. and F.P.L.; investigation, A.P.A.M., A.C.R.P., A.V.C., and F.P.L.; resources, L.M., F.C., and F.P.L.; data curation, A.P.A.M., A.C.R.P., L.-E.D.-B., F.C., and F.P.L.; writing – original draft, J.A.H., G.M.d.C., A.P.A.M., A.C.R.P., T.T.M.d.S., E.L.I., L.M., L.-E.D.-B., A.V.C., G.M.d.F.A., F.C., and F.P.L.; writing – review & editing, F.C. and F.P.L.; visualization, G.M.d.C., F.C., and F.P.L.; supervision, F.P.L.; project administration, F.P.L.; funding acquisition, F.P.L.
Declaration of interests
The authors declare no competing interests.
Inclusion and diversity
We support inclusive, diverse, and equitable conduct of research.
Published: April 14, 2023
Footnotes
Supplemental information can be found online at https://doi.org/10.1016/j.patter.2023.100728.
Supplemental information
Data and code availability
-
•
Original data have been deposited to Zenodo: Data S1 (https://doi.org/10.5281/zenodo.7647841),26 Data S2 (https://doi.org/10.5281/zenodo.7647874),29 Data S3 (https://doi.org/10.5281/zenodo.7647884),39 and Data S4 (https://doi.org/10.5281/zenodo.7647892).43 The IDs and URLs for the raw data used in the two case studies (genome IDs and sources of phenotypic/phylogenetic data) are available in Data S1 (case study 1: E. coli data) and Data S3 (case study 2: angiosperms data). All processed data needed to fully reproduce the two case studies (genome annotation files, phylogenetic tree, metadata file with phenotypic information, and CALANGO configuration files) are available at https://labpackages.github.io/CALANGO/.
-
•
Our tool is freely available as an R package in CRAN (https://cran.r-project.org/package=CALANGO). All original code and processed data needed to reproduce our results has been deposited at Zenodo as supplemental data (https://doi.org/10.5281/zenodo.7648987) and is publicly available as of the date of publication.48
-
•
Any additional information required to reanalyze the data reported in this descriptor is available from the lead contact upon request.
References
- 1.Vogel C., Chothia C. Protein family expansions and biological complexity. PLoS Comput. Biol. 2006;2:e48. doi: 10.1371/journal.pcbi.0020048. [DOI] [PMC free article] [PubMed] [Google Scholar]
- 2.Scott A.D., Zimin A.V., Puiu D., Workman R., Britton M., Zaman S., Caballero M., Read A.C., Bogdanove A.J., Burns E., et al. A reference genome sequence for giant sequoia. G3 (Bethesda) 2020;10:3907–3919. doi: 10.1534/g3.120.401612. [DOI] [PMC free article] [PubMed] [Google Scholar]
- 3.Ureta-Vidal A., Ettwiller L., Birney E. Comparative genomics: genome-wide analysis in metazoan eukaryotes. Nat. Rev. Genet. 2003;4:251–262. doi: 10.1038/nrg1043. [DOI] [PubMed] [Google Scholar]
- 4.Nagy L.G., Merényi Z., Hegedüs B., Bálint B. Novel phylogenetic methods are needed for understanding gene function in the era of mega-scale genome sequencing. Nucleic Acids Res. 2020;48:2209–2219. doi: 10.1093/nar/gkz1241. [DOI] [PMC free article] [PubMed] [Google Scholar]
- 5.Tam V., Patel N., Turcotte M., Bossé Y., Paré G., Meyre D. Benefits and limitations of genome-wide association studies. Nat. Rev. Genet. 2019;20:467–484. doi: 10.1038/s41576-019-0127-1. [DOI] [PubMed] [Google Scholar]
- 6.Bao F., Deng Y., Du M., Ren Z., Wan S., Liang K.Y., Liu S., Wang B., Xin J., Chen F., et al. Explaining the genetic causality for complex phenotype via deep association kernel learning. Patterns (N Y) 2020;1 doi: 10.1016/j.patter.2020.100057. [DOI] [PMC free article] [PubMed] [Google Scholar]
- 7.Huang X., Han B. Natural variations and genome-wide association studies in crop plants. Annu. Rev. Plant Biol. 2014;65:531–551. doi: 10.1146/annurev-arplant-050213-035715. [DOI] [PubMed] [Google Scholar]
- 8.Groth P., Pavlova N., Kalev I., Tonov S., Georgiev G., Pohlenz H.D., Weiss B. PhenomicDB: a new cross-species genotype/phenotype resource. Nucleic Acids Res. 2007;35:D696–D699. doi: 10.1093/nar/gkl662. [DOI] [PMC free article] [PubMed] [Google Scholar]
- 9.Liolios K., Chen I.M.A., Mavromatis K., Tavernarakis N., Hugenholtz P., Markowitz V.M., Kyrpides N.C. The Genomes on Line Database (GOLD) in 2009: status of genomic and metagenomic projects and their associated metadata. Nucleic Acids Res. 2010;38:D346–D354. doi: 10.1093/nar/gkp848. [DOI] [PMC free article] [PubMed] [Google Scholar]
- 10.Cornwell W., Nakagawa S. Phylogenetic comparative methods. Curr. Biol. 2017;27:R333–R336. doi: 10.1016/j.cub.2017.03.049. [DOI] [PubMed] [Google Scholar]
- 11.Tong C., Najm G.M., Pinter-Wollman N., Pruitt J.N., Linksvayer T.A. Comparative genomics identifies putative signatures of sociality in spiders. Genome Biol. Evol. 2020;12:122–133. doi: 10.1093/gbe/evaa007. [DOI] [PMC free article] [PubMed] [Google Scholar]
- 12.International Helminth Genomes Consortium Comparative genomics of the major parasitic worms. Nat. Genet. 2019;51:163–174. doi: 10.1038/s41588-018-0262-1. [DOI] [PMC free article] [PubMed] [Google Scholar]
- 13.Hung J.H., Yang T.H., Hu Z., Weng Z., Delisi C. Gene set enrichment analysis: performance evaluation and usage guidelines. Brief. Bioinform. 2012;13:281–291. doi: 10.1093/bib/bbr049. [DOI] [PMC free article] [PubMed] [Google Scholar]
- 14.Waterhouse R.M., Seppey M., Simão F.A., Manni M., Ioannidis P., Klioutchnikov G., Kriventseva E.V., Zdobnov E.M. BUSCO applications from quality assessments to gene prediction and phylogenomics. Mol. Biol. Evol. 2018;35:543–548. doi: 10.1093/molbev/msx319. [DOI] [PMC free article] [PubMed] [Google Scholar]
- 15.Mashau A.C., Hempson G.P., Lehmann C.E.R., Vorontsova M.S., Visser V., Archibald S. Plant height and lifespan predict range size in southern African grasses. J. Biogeogr. 2021;48:3047–3059. doi: 10.1111/jbi.14261. [DOI] [Google Scholar]
- 16.Zu P., Schiestl F.P. The effects of becoming taller: direct and pleiotropic effects of artificial selection on plant height in Brassica rapa. Plant J. 2017;89:1009–1019. doi: 10.1111/tpj.13440. [DOI] [PubMed] [Google Scholar]
- 17.Paradis E., Schliep K. Ape 5.0: an environment for modern phylogenetics and evolutionary analyses in R. Bioinformatics. 2019;35:526–528. doi: 10.1093/bioinformatics/bty633. [DOI] [PubMed] [Google Scholar]
- 18.Haft D.H., DiCuccio M., Badretdin A., Brover V., Chetvernin V., O'Neill K., Li W., Chitsaz F., Derbyshire M.K., Gonzales N.R., et al. RefSeq: an update on prokaryotic genome annotation and curation. Nucleic Acids Res. 2018;46:D851–D860. doi: 10.1093/nar/gkx1068. [DOI] [PMC free article] [PubMed] [Google Scholar]
- 19.Yandell M., Ence D. A beginner's guide to eukaryotic genome annotation. Nat. Rev. Genet. 2012;13:329–342. doi: 10.1038/nrg3174. [DOI] [PubMed] [Google Scholar]
- 20.Jones P., Binns D., Chang H.Y., Fraser M., Li W., McAnulla C., McWilliam H., Maslen J., Mitchell A., Nuka G., et al. InterProScan 5: genome-scale protein function classification. Bioinformatics. 2014;30:1236–1240. doi: 10.1093/bioinformatics/btu031. [DOI] [PMC free article] [PubMed] [Google Scholar]
- 21.The Gene Ontology Consortium The gene Ontology resource: 20 years and still GOing strong. Nucleic Acids Res. 2019;47:D330–D338. doi: 10.1093/nar/gky1055. [DOI] [PMC free article] [PubMed] [Google Scholar]
- 22.Dalmasso C., Broët P., Moreau T. A simple procedure for estimating the false discovery rate. Bioinformatics. 2005;21:660–668. doi: 10.1093/bioinformatics/bti063. [DOI] [PubMed] [Google Scholar]
- 23.Touchon M., Hoede C., Tenaillon O., Barbe V., Baeriswyl S., Bidet P., Bingen E., Bonacorsi S., Bouchier C., Bouvet O., et al. Organised genome dynamics in the Escherichia coli species results in highly diverse adaptive paths. PLoS Genet. 2009;5:e1000344. doi: 10.1371/journal.pgen.1000344. [DOI] [PMC free article] [PubMed] [Google Scholar]
- 24.Correa A.M.S., Howard-Varona C., Coy S.R., Buchan A., Sullivan M.B., Weitz J.S. Revisiting the rules of life for viruses of microorganisms. Nat. Rev. Microbiol. 2021;19:501–513. doi: 10.1038/s41579-021-00530-x. [DOI] [PubMed] [Google Scholar]
- 25.Steyert S.R., Kaper J.B. Contribution of urease to colonization by Shiga toxin-producing Escherichia coli. Infect. Immun. 2012;80:2589–2600. doi: 10.1128/IAI.00210-12. [DOI] [PMC free article] [PubMed] [Google Scholar]
- 26.Lobo F.P. 2023. Data S1 – Genomic and Phenotypic Data of Escherichia coli. [DOI] [Google Scholar]
- 27.Mistry J., Chuguransky S., Williams L., Qureshi M., Salazar G.A., Sonnhammer E.L.L., Tosatto S.C.E., Paladin L., Raj S., Richardson L.J., et al. Pfam: the protein families database in 2021. Nucleic Acids Res. 2021;49:D412–D419. doi: 10.1093/nar/gkaa913. [DOI] [PMC free article] [PubMed] [Google Scholar]
- 28.Arndt D., Grant J.R., Marcu A., Sajed T., Pon A., Liang Y., Wishart D.S. PHASTER: a better, faster version of the PHAST phage search tool. Nucleic Acids Res. 2016;44:W16–W21. doi: 10.1093/nar/gkw387. [DOI] [PMC free article] [PubMed] [Google Scholar]
- 29.Lobo F.P. 2023. Data S2 – Protein Domains and Gene Ontology Terms Associated with Prophage Density in the E. coli Dataset. [DOI] [Google Scholar]
- 30.Ehrbar K., Hardt W.D. Bacteriophage-encoded type III effectors in Salmonella enterica subspecies 1 serovar Typhimurium. Infect. Genet. Evol. 2005;5:1–9. doi: 10.1016/j.meegid.2004.07.004. [DOI] [PubMed] [Google Scholar]
- 31.Park B.S., Lee J.O. Recognition of lipopolysaccharide pattern by TLR4 complexes. Exp. Mol. Med. 2013;45:e66. doi: 10.1038/emm.2013.97. [DOI] [PMC free article] [PubMed] [Google Scholar]
- 32.Wolf A.J., Underhill D.M. Peptidoglycan recognition by the innate immune system. Nat. Rev. Immunol. 2018;18:243–254. doi: 10.1038/nri.2017.136. [DOI] [PubMed] [Google Scholar]
- 33.Bertozzi Silva J., Storms Z., Sauvageau D. Host receptors for bacteriophage adsorption. FEMS Microbiol. Lett. 2016;363 doi: 10.1093/femsle/fnw002. [DOI] [PubMed] [Google Scholar]
- 34.Wang X., Kim Y., Ma Q., Hong S.H., Pokusaeva K., Sturino J.M., Wood T.K. Cryptic prophages help bacteria cope with adverse environments. Nat. Commun. 2010;1:147. doi: 10.1038/ncomms1146. [DOI] [PMC free article] [PubMed] [Google Scholar]
- 35.Moles A.T., Warton D.I., Warman L., Swenson N.G., Laffan S.W., Zanne A.E., Pitman A., Hemmings F.A., Leishman M.R. Global patterns in plant height. J. Ecol. 2009;97:923–932. doi: 10.1111/j.1365-2745.2009.01526.x. [DOI] [Google Scholar]
- 36.Falster D.S., Westoby M. Plant height and evolutionary games. Trends Ecol. Evol. 2003;18:337–343. doi: 10.1016/S0169-5347(03)00061-2. [DOI] [Google Scholar]
- 37.Peiffer J.A., Romay M.C., Gore M.A., Flint-Garcia S.A., Zhang Z., Millard M.J., Gardner C.A.C., McMullen M.D., Holland J.B., Bradbury P.J., Buckler E.S. The genetic architecture of maize height. Genetics. 2014;196:1337–1356. doi: 10.1534/genetics.113.159152. [DOI] [PMC free article] [PubMed] [Google Scholar]
- 38.Lanfear R., Ho S.Y.W., Jonathan Davies T., Moles A.T., Aarssen L., Swenson N.G., Warman L., Zanne A.E., Allen A.P. Taller plants have lower rates of molecular evolution. Nat. Commun. 2013;4:1879. doi: 10.1038/ncomms2836. [DOI] [PubMed] [Google Scholar]
- 39.Lobo F.P. 2023. Data S3 – Genomic and Phenotypic Data of Angiosperms. [DOI] [Google Scholar]
- 40.Ren R., Wang H., Guo C., Zhang N., Zeng L., Chen Y., Ma H., Qi J. Widespread whole genome duplications contribute to genome complexity and species diversity in angiosperms. Mol. Plant. 2018;11:414–428. doi: 10.1016/j.molp.2018.01.002. [DOI] [PubMed] [Google Scholar]
- 41.Clark J.W., Donoghue P.C.J. Whole-genome duplication and plant macroevolution. Trends Plant Sci. 2018;23:933–945. doi: 10.1016/j.tplants.2018.07.006. [DOI] [PubMed] [Google Scholar]
- 42.Salman-Minkov A., Sabath N., Mayrose I. Whole-genome duplication as a key factor in crop domestication. Nat. Plants. 2016;2 doi: 10.1038/nplants.2016.115. [DOI] [PubMed] [Google Scholar]
- 43.Lobo F.P. 2023. Data S4 – Protein Domains and Genes of Arabidopsis thaliana Positively Associated with Maximum Height in Angiosperms. [DOI] [Google Scholar]
- 44.Durand E., Chantreau M., Le Veve A., Stetsenko R., Dubin M., Genete M., Llaurens V., Poux C., Roux C., Billiard S., et al. Evolution of self-incompatibility in the Brassicaceae: lessons from a textbook example of natural selection. Evol. Appl. 2020;13:1279–1297. doi: 10.1111/eva.12933. [DOI] [PMC free article] [PubMed] [Google Scholar]
- 45.Nasrallah J.B., Nasrallah M.E. S-locus receptor kinase signalling. Biochem. Soc. Trans. 2014;42:313–319. doi: 10.1042/BST20130222. [DOI] [PubMed] [Google Scholar]
- 46.Willi Y., Hoffmann A.A. Demographic factors and genetic variation influence population persistence under environmental change. J. Evol. Biol. 2009;22:124–133. doi: 10.1111/j.1420-9101.2008.01631.x. [DOI] [PubMed] [Google Scholar]
- 47.Tuskan G.A., Difazio S., Jansson S., Bohlmann J., Grigoriev I., Hellsten U., Putnam N., Ralph S., Rombauts S., Salamov A., et al. The genome of black cottonwood, Populus trichocarpa (Torr. & Gray) Science. 2006;313:1596–1604. doi: 10.1126/science.1128691. [DOI] [PubMed] [Google Scholar]
- 48.Campelo F. 2023. Data S5 - Archival Version of CALANGO. [DOI] [Google Scholar]
- 49.Haynes W.A., Tomczak A., Khatri P. Gene annotation bias impedes biomedical research. Sci. Rep. 2018;8:1362. doi: 10.1038/s41598-018-19333-x. [DOI] [PMC free article] [PubMed] [Google Scholar]
- 50.Felsenstein J. Phylogenies and the Comparative Method The American Naturalist. 1985;125:15. [Google Scholar]
Associated Data
This section collects any data citations, data availability statements, or supplementary materials included in this article.
Supplementary Materials
Data Availability Statement
-
•
Original data have been deposited to Zenodo: Data S1 (https://doi.org/10.5281/zenodo.7647841),26 Data S2 (https://doi.org/10.5281/zenodo.7647874),29 Data S3 (https://doi.org/10.5281/zenodo.7647884),39 and Data S4 (https://doi.org/10.5281/zenodo.7647892).43 The IDs and URLs for the raw data used in the two case studies (genome IDs and sources of phenotypic/phylogenetic data) are available in Data S1 (case study 1: E. coli data) and Data S3 (case study 2: angiosperms data). All processed data needed to fully reproduce the two case studies (genome annotation files, phylogenetic tree, metadata file with phenotypic information, and CALANGO configuration files) are available at https://labpackages.github.io/CALANGO/.
-
•
Our tool is freely available as an R package in CRAN (https://cran.r-project.org/package=CALANGO). All original code and processed data needed to reproduce our results has been deposited at Zenodo as supplemental data (https://doi.org/10.5281/zenodo.7648987) and is publicly available as of the date of publication.48
-
•
Any additional information required to reanalyze the data reported in this descriptor is available from the lead contact upon request.