

Key Points
Question
How does maternal mortality vary by state and race and ethnicity over time in the US?
Findings
Long-term trends in maternal mortality ratios from vital registration and census data were estimated. Increases in maternal mortality ratios in specific states were identified and showed previously unmeasured inequities for specific subpopulations.
Meaning
Previous research has focused on trends at the national level or in selected states. Comprehensive reporting of disparities in maternal mortality provides evidence to guide intervention policies and benchmark progress for the prevention of maternal deaths.
Abstract
Importance
Evidence suggests that maternal mortality has been increasing in the US. Comprehensive estimates do not exist. Long-term trends in maternal mortality ratios (MMRs) for all states by racial and ethnic groups were estimated.
Objective
To quantify trends in MMRs (maternal deaths per 100 000 live births) by state for 5 mutually exclusive racial and ethnic groups using a bayesian extension of the generalized linear model network.
Design, Setting, and Participants
Observational study using vital registration and census data from 1999 to 2019 in the US. Pregnant or recently pregnant individuals aged 10 to 54 years were included.
Main Outcomes and Measures
MMRs.
Results
In 2019, MMRs in most states were higher among American Indian and Alaska Native and Black populations than among Asian, Native Hawaiian, or Other Pacific Islander; Hispanic; and White populations. Between 1999 and 2019, observed median state MMRs increased from 14.0 (IQR, 5.7-23.9) to 49.2 (IQR, 14.4-88.0) among the American Indian and Alaska Native population, 26.7 (IQR, 18.3-32.9) to 55.4 (IQR, 31.6-74.5) among the Black population, 9.6 (IQR, 5.7-12.6) to 20.9 (IQR, 12.1-32.8) among the Asian, Native Hawaiian, or Other Pacific Islander population, 9.6 (IQR, 6.9-11.6) to 19.1 (IQR, 11.6-24.9) among the Hispanic population, and 9.4 (IQR, 7.4-11.4) to 26.3 (IQR, 20.3-33.3) among the White population. In each year between 1999 and 2019, the Black population had the highest median state MMR. The American Indian and Alaska Native population had the largest increases in median state MMRs between 1999 and 2019. Since 1999, the median of state MMRs has increased for all racial and ethnic groups in the US and the American Indian and Alaska Native; Asian, Native Hawaiian, or Other Pacific Islander; and Black populations each observed their highest median state MMRs in 2019.
Conclusion and Relevance
While maternal mortality remains unacceptably high among all racial and ethnic groups in the US, American Indian and Alaska Native and Black individuals are at increased risk, particularly in several states where these inequities had not been previously highlighted. Median state MMRs for the American Indian and Alaska Native and Asian, Native Hawaiian, or Other Pacific Islander populations continue to increase, even after the adoption of a pregnancy checkbox on death certificates. Median state MMR for the Black population remains the highest in the US. Comprehensive mortality surveillance for all states via vital registration identifies states and racial and ethnic groups with the greatest potential to improve maternal mortality. Maternal mortality persists as a source of worsening disparities in many US states and prevention efforts during this study period appear to have had a limited impact in addressing this health crisis.
This study uses vital registration and census data from 1999 to 2019 to quantify trends in maternal mortality ratios (maternal deaths per 100 000 live births) by state for 5 mutually exclusive racial and ethnic groups in the US using a bayesian extension of the generalized linear model network.
Introduction
The US has a high rate of maternal mortality, compared with other high-income countries, despite spending more per person on health care.1,2 Over the past 2 decades, maternal mortality in other high-income countries has decreased while in the US it has increased.2 The Global Burden of Disease (GBD) Study estimated that national maternal mortality ratios (MMRs) for high-income countries in 2019 ranged from 4 deaths/100 000 live births to 44 deaths/100 000 live births.3 At the national level, US MMRs (or maternal deaths per 100 000 live births) are 2 to 4 times higher in the non-Hispanic Black (hereafter referred to as Black) population than in the non-Hispanic White (hereafter referred to as White) population.2 These elevated risks hold true even when controlling for maternal comorbidities and education.2,4 A broad range of causes have been identified to explain inequities in US maternal mortality, including structural and interpersonal racism.5 While there has been substantial focus on disparities between Black and White populations, MMRs are also higher for non-Hispanic American Indian and Alaska Native (hereafter referred to as American Indian and Alaska Native) compared with White populations.6 Although it is known that maternal mortality differs by racial and ethnic groups nationally, there is little understanding of state-level trends. This is particularly true for smaller states with lower death counts, where the reporting of deaths by race and ethnicity can threaten anonymity and where drawing meaningful statistical comparisons can be challenging.7
Long-term trends for MMRs have only been reported for a small subset of states. Efforts to understand US maternal mortality trends over the past 20 years have been limited by inconsistent use of terminology, differences between states in how maternal death has been defined, and states’ differential timing of the addition of a US standard pregnancy question (the “pregnancy checkbox”) to their death certificates.8 Some states, citing concerns for data integrity, have recently delayed release of their data, hampering policy and improvement efforts.9
Experts in maternal mortality have called for improvements in and augmentation of data.8 State- and race and ethnicity–specific maternal mortality data serve as important evidence for communities, clinicians, public health professionals, policymakers, and other stakeholders who are making efforts to prevent maternal deaths and reduce inequities. To support the development of maternal mortality surveillance reporting for every state, statistical methods were applied in a comprehensive way to provide estimates of MMRs at the state level by race and ethnicity using data from vital registration and the US Census.
Methods
Overview
We estimated MMRs by state and racial and ethnic groups for each year from 1999 to 2019 and for 2 aggregate periods: 1999-2009 and 2010-2019 (eFigure 1 in Supplement 1). Smoothing mortality data over time with bayesian modeling allowed for the estimation of mean maternal death risk for each racial and ethnic group in each state. While there may have been zero deaths in a single year for a particular population in a given location, the risk of maternal death during that time was not absent. This study is GATHER compliant (eTable 1 in Supplement 1). Estimates are available at https://ghdx.healthdata.org/record/ihme-data/united-states-maternal-mortality-by-state-race-ethnicity-1999-2019. This study was reviewed by the University of Washington institutional review board and deemed non–human subjects research.
Statistical Racial and Ethnic Groups
Statistical racial and ethnic groups are socially derived categories, defined by the report of an individual or perception of an individual completing a death certificate. These data are then reported by the government and other institutions, usually for the purpose of achieving social or policy goals. In this article, we report on 5 mutually exclusive and collectively exhaustive statistical racial and ethnic groups as defined by the US Office of Management and Budget: (1) Hispanic and any race (hereafter referred to as Hispanic); (2) non-Hispanic and American Indian or Alaska Native; (3) non-Hispanic and Asian, Native Hawaiian, or Other Pacific Islander (hereafter referred to as Asian, Native Hawaiian, or Other Pacific Islander); (4) non-Hispanic and Black; and (5) non-Hispanic and White.10
Births and Deaths
Input data were obtained from the National Vital Statistics System. Data were aggregated by year and racial and ethnic group for each state. Births were modeled using counts of live births among individuals aged 10 to 54 years between 1999 and 2019. Deaths were modeled from death certificate data for pregnant or recently pregnant individuals aged 10 to 54 years. We defined maternal deaths as deaths that occurred up to 1 year after the end of pregnancy and were coded with the use of the US standard pregnancy question and/or 1 of the following International Statistical Classification of Diseases and Related Health Problems, Tenth Revision (ICD-10) codes: C58-C58.0, N96, N98-N98.9, O00-O07.9, O09-O16.9, O20-O26.9, O28-O36.9, O40-O48.1, O60-O77.9, O80-O92.7, O96-O98.6, and O98.8-O99.9 (eTable 2 in Supplement 1).11 Deaths caused by unintentional injuries, homicides, and suicides are excluded from the definition of maternal death following standard death certification practice. To improve comparability across state and time, we followed the GBD Study’s method for correction of mortality data.12 This approach reclassified as maternal a small proportion of deaths for which the underlying cause was initially coded to an implausible or nonmaternal intermediate or immediate cause of death, but which should have been coded as a maternal cause of death, based on analysis of death certificates reporting the entire chain of events (eMethods in Supplement 1).
Population
We used bridged race and ethnicity data from the US Census (https://www.cdc.gov/nchs/nvss/bridged_race.htm) to construct a time series of population by age, sex, and state-level racial and ethnic groups from 1999 to 2019. To increase consistency, the time series was then adjusted to state-level estimates from the GBD Study, such that the sum of the 5 racial and ethnic groups for any age, sex, year, and state combination equaled the GBD Study’s state-level estimate for that age, sex, and year combination. Population estimates for self-identifying females were aggregated by year, state, and racial and ethnic group prior to modeling.
Statistical Methods
We used the RegMod package, a bayesian extension of the generalized linear modeling framework, to create hierarchical models for births and deaths separately in each US state and racial and ethnic group over time (1999-2019). A general description of the approach follows; detailed information can be found in the Statistical Modeling section of the eMethods in Supplement 1. Model parameters for births and deaths can be found in the Settings and Parameters sections in the eMethods in Supplement 1. RegMod allows for a user-defined hierarchical cascade, in which estimates at higher levels of the cascade are passed down as priors for subsequent levels. The cascade used for this analysis was: (1) US national, (2) US Census regions (Northeast, Midwest, South, and West), (3) racial and ethnic group by Census region, and (4) state-level racial and ethnic group. For both births and deaths, we specified a Poisson distribution, with population as an offset. Year was modeled using a spline for the individual year models and using dummy variables for the grouped year models. In-sample and out-of-sample root mean square error values were calculated for 5 sets of parameters for both the birth and death models to assess model performance, along with visual inspection of model fit.
After modeling, state-level race and ethnicity estimates for births and deaths were adjusted and scaled to national estimates in order to maintain internal consistency between the most-detailed estimates and the US national estimates for each year. For each state, racial and ethnic group, and year, the modeled death estimates were divided by the modeled birth estimates and multiplied by 100 000 to obtain MMR values.
To generate uncertainty intervals, we took 1000 draws from the posterior distribution of the model. The reported 95% uncertainty intervals (UIs) were the 2.5th and 97.5th percentiles of 1000 samples drawn from the posterior distribution. To carry through uncertainty from the birth and death models, the calculation of MMRs was performed at the draw level. Analyses were completed using Python 3.8.8 and R 4.05.13,14
Results
MMRs by State and Racial and Ethnic Group in 2019
There were 1210 maternal deaths estimated in 2019, an increase from 505 maternal deaths estimated in 1999. Estimated deaths by racial and ethnic group and Census region are shown in the Table. Figure 1 maps maternal mortality by state in 2019 for each racial and ethnic group (panels A-E) and for all racial and ethnic groups combined (panel F). For the American Indian and Alaska Native population (Figure 1A), the higher MMR values were generally observed in the West. For the Asian, Native Hawaiian, or Other Pacific Islander population (Figure 1B), MMR values were notably lower across the Northeast and Midwest. For the Black population (Figure 1C), the states in the South had high MMR values, as did several states in other regions including Arizona (122.9 [95% UI, 60.3-235.3]) and New Jersey (119.6 [95% UI, 91.8-158.7]). For the Hispanic population (Figure 1D), few states had high MMR values relative to the other racial and ethnic groups. For the White population (Figure 1E), MMRs generally followed the trend for all racial and ethnic groups combined (Figure 1F) and were higher in the South. eTable 3 in Supplement 2 reports values shown in Figure 1. eFigure 2 in Supplement 1 shows maternal mortality by state and racial and ethnic group in 1999.
Table. Maternal Death, Live Birth, and MMR Estimates by US Census Region and Racial and Ethnic Groups, 1999 and 2019a.
| Census region | Maternal death estimates, No. (95% UI) | Age at death, median (IQR), y | No. (95% UI) | |||||
|---|---|---|---|---|---|---|---|---|
| Live birth estimatesb | Estimated MMR (deaths/100 000 live births) | |||||||
| 1999 | 2019 | 1999 | 2019 | 1999 | 2019 | 1999 | 2019 | |
| American Indian and Alaska Native | ||||||||
| US | 7 (5-11) | 23 (16-35) | 32 (12-32) | 32 (12-32) | 37.8 (32.0-44.5) | 33.3 (29.9-37.4) | 19.0 (12.2-31.3) | 69.3 (45.5-108.1) |
| Midwest | 1 (1-3) | 6 (3-12) | 37 (17-37) | 37 (22-37) | 7 (5.2-9.4) | 6.5 (4.8-8.8) | 19.6 (9.2-38.7) | 94.2 (45.4-193.4) |
| Northeast | 0 (0-1) | 0 (0-2) | 27 (22-27) | 22 (17-22) | 1.6 (1.2-2.1) | 1.1 (0.9-1.3) | 10.0 (2.9-32.3) | 33.6 (5.8-206.0) |
| South | 1 (1-3) | 3 (2-6) | 27 (22-27) | 27 (12-27) | 9.6 (7.8-12.0) | 9.8 (7.4-12.8) | 14.6 (7.7-27.6) | 34.1 (15.8-68.2) |
| West | 4 (2-8) | 13 (7-24) | 32 (12-32) | 32 (17-32) | 19.6 (14.6-25.8) | 15.9 (14.1-18.0) | 21.6 (10.5-45.2) | 83.3 (42.4-149.7) |
| Asian, Native Hawaiian, or Other Pacific Islander | ||||||||
| US | 17 (12-23) | 56 (42-76) | 32 (12-32) | 32 (12-37) | 177.9 (161.7-198.3) | 268.6 (257.8-280) | 9.6 (6.9-13.5) | 20.8 (15.5-28.2) |
| Midwest | 2 (1-3) | 5 (3-10) | 32 (12-32) | 28 (17-28) | 23.2 (20.3-27) | 36.1 (32.6-40.3) | 7.4 (3.5-14.3) | 14.6 (7.4-28.7) |
| Northeast | 3 (1-6) | 6 (4-11) | 32 (12-32) | 32 (17-32) | 36.4 (32.0-40.9) | 53 (48.8-57.7) | 7.8 (3.5-15.7) | 11.7 (6.7-20.1) |
| South | 4 (2-6) | 17 (10-25) | 37 (12-37) | 37 (12-37) | 33.6 (29.2-38.5) | 64.9 (60.1-69.8) | 10.6 (5.6-19.0) | 25.5 (16.1-39.7) |
| West | 9 (5-14) | 28 (17-44) | 37 (12-37) | 37 (12-37) | 84.8 (68.6-103.9) | 114.6 (107.6-122.2) | 10.6 (6.2-18.1) | 24.4 (14.9-38.5) |
| Black | ||||||||
| US | 186 (152-225) | 393 (334-463) | 32 (12-27) | 32 (12-32) | 593.2 (543.2-648.3) | 581.4 (556.4-609.4) | 31.4 (25.3-38.2) | 67.6 (56.7-80.2) |
| Midwest | 30 (20-42) | 50 (32-73) | 27 (12-27) | 32 (12-32) | 116.4 (103.3-130.5) | 118 (106.6-131.8) | 25.6 (17.2-36.8) | 42.2 (26.9-63.0) |
| Northeast | 29 (18-45) | 73 (51-100) | 31 (12-31) | 32 (12-32) | 100.3 (88.7-112.7) | 81.2 (74.3-88.6) | 29.3 (17.5-45.5) | 89.5 (62.3-126.3) |
| South | 113 (87-143) | 245 (196-298) | 27 (12-27) | 32 (12-32) | 328.5 (291.8-371.1) | 332.1 (312.3-353.1) | 34.5 (25.4-44.5) | 73.7 (58.3-91.1) |
| West | 14 (9-20) | 26 (15-42) | 32 (12-32) | 32 (12-32) | 47.9 (39.1-58.8) | 50 (43.1-57.4) | 29.0 (18.0-44.7) | 51.6 (30.0-85.7) |
| Hispanic | ||||||||
| US | 74 (59-93) | 184 (151-230) | 32 (12-27) | 32 (12-32) | 764.1 (695.1-844.2) | 886.9 (847.1-930.3) | 9.6 (7.5-12.4) | 20.8 (167.0-26.2) |
| Midwest | 6 (3-10) | 13 (8-22) | 22 (12-22) | 32 (12-32) | 69.2 (60.7-79.1) | 84.8 (75.2-95.4) | 8.6 (4.5-14.93) | 15.4 (9.0-27.0) |
| Northeast | 12 (7-19) | 37 (24-55) | 32 (12-32) | 32 (12-32) | 99 (87.9-111.2) | 121.4 (111.9-132.6) | 12.1 (7.0-19.5) | 30.2 (20.0-45.0) |
| South | 25 (18-34) | 76 (54-99) | 27 (12-27) | 32 (12-32) | 246.4 (210.2-293.3) | 357.7 (326.9-388.9) | 10.2 (7.1-14.4) | 21.1 (15.3-28.3) |
| West | 31 (21-44) | 59 (39-91) | 32 (12-32) | 32 (12-32) | 349.5 (286.0-424.4) | 323 (299.8-345.3) | 8.8 (5.7-13.2) | 18.3 (11.9-28.3) |
| White | ||||||||
| US | 220 (181-264) | 551 (465-635) | 32 (12-32) | 32 (12-32) | 2392.2 (2225.1-2579.6) | 1979 (1918.7-2041.5) | 9.2 (7.4-11.2) | 27.9 (23.4-32.2) |
| Midwest | 62 (45-84) | 147 (109-190) | 32 (12-32) | 32 (12-32) | 667.6 (597.2-744.6) | 539.6 (511.1-572.1) | 9.3 (6.5-12.6) | 27.3 (20.3-36.1) |
| Northeast | 36 (22-55) | 80 (56-111) | 32 (12-32) | 32 (12-32) | 449.7 (399.2-502.5) | 341.3 (319.3-364.1) | 8.0 (5.0-12.4) | 23.3 (16.5-32.6) |
| South | 86 (64-110) | 237 (189-293) | 32 (12-32) | 32 (12-32) | 822 (732.2-920.6) | 715.2 (676.9-753.9) | 10.4 (7.8-13.8) | 33.2 (26.0-41.0) |
| West | 36 (25-52) | 87 (60-122) | 32 (12-32) | 32 (12-32) | 452.9 (369.3-552.2) | 382.9 (359.3-409.0) | 7.94 (5.2-11.9) | 22.7 (15.5-32.2) |
| All racial and ethnic groups | ||||||||
| US | 505 (424-593) | 1210 (1060-1370) | 32 (12-32) | 32 (12-32) | 3965.2 (3709.0-4267.2) | 3749.1 (3646.8-3854.9) | 12.7 (10.5-15.1) | 32.2 (28.1-36.6) |
Abbreviations: MMR, maternal mortality ratio; UI, uncertainty interval.
Deaths are reported in whole numbers. For the American Indian and Alaska Native population, estimates in the Northeast were 0.16 in 1999 and 0.37 in 2019, which are shown as zero due to rounding.
Live birth estimates are shown for region and/or racial and ethnic group in the 1000s.
Figure 1. Maternal Mortality Ratios (MMRs) by State for 5 Racial and Ethnic Groups and the Total US Population, 2019.
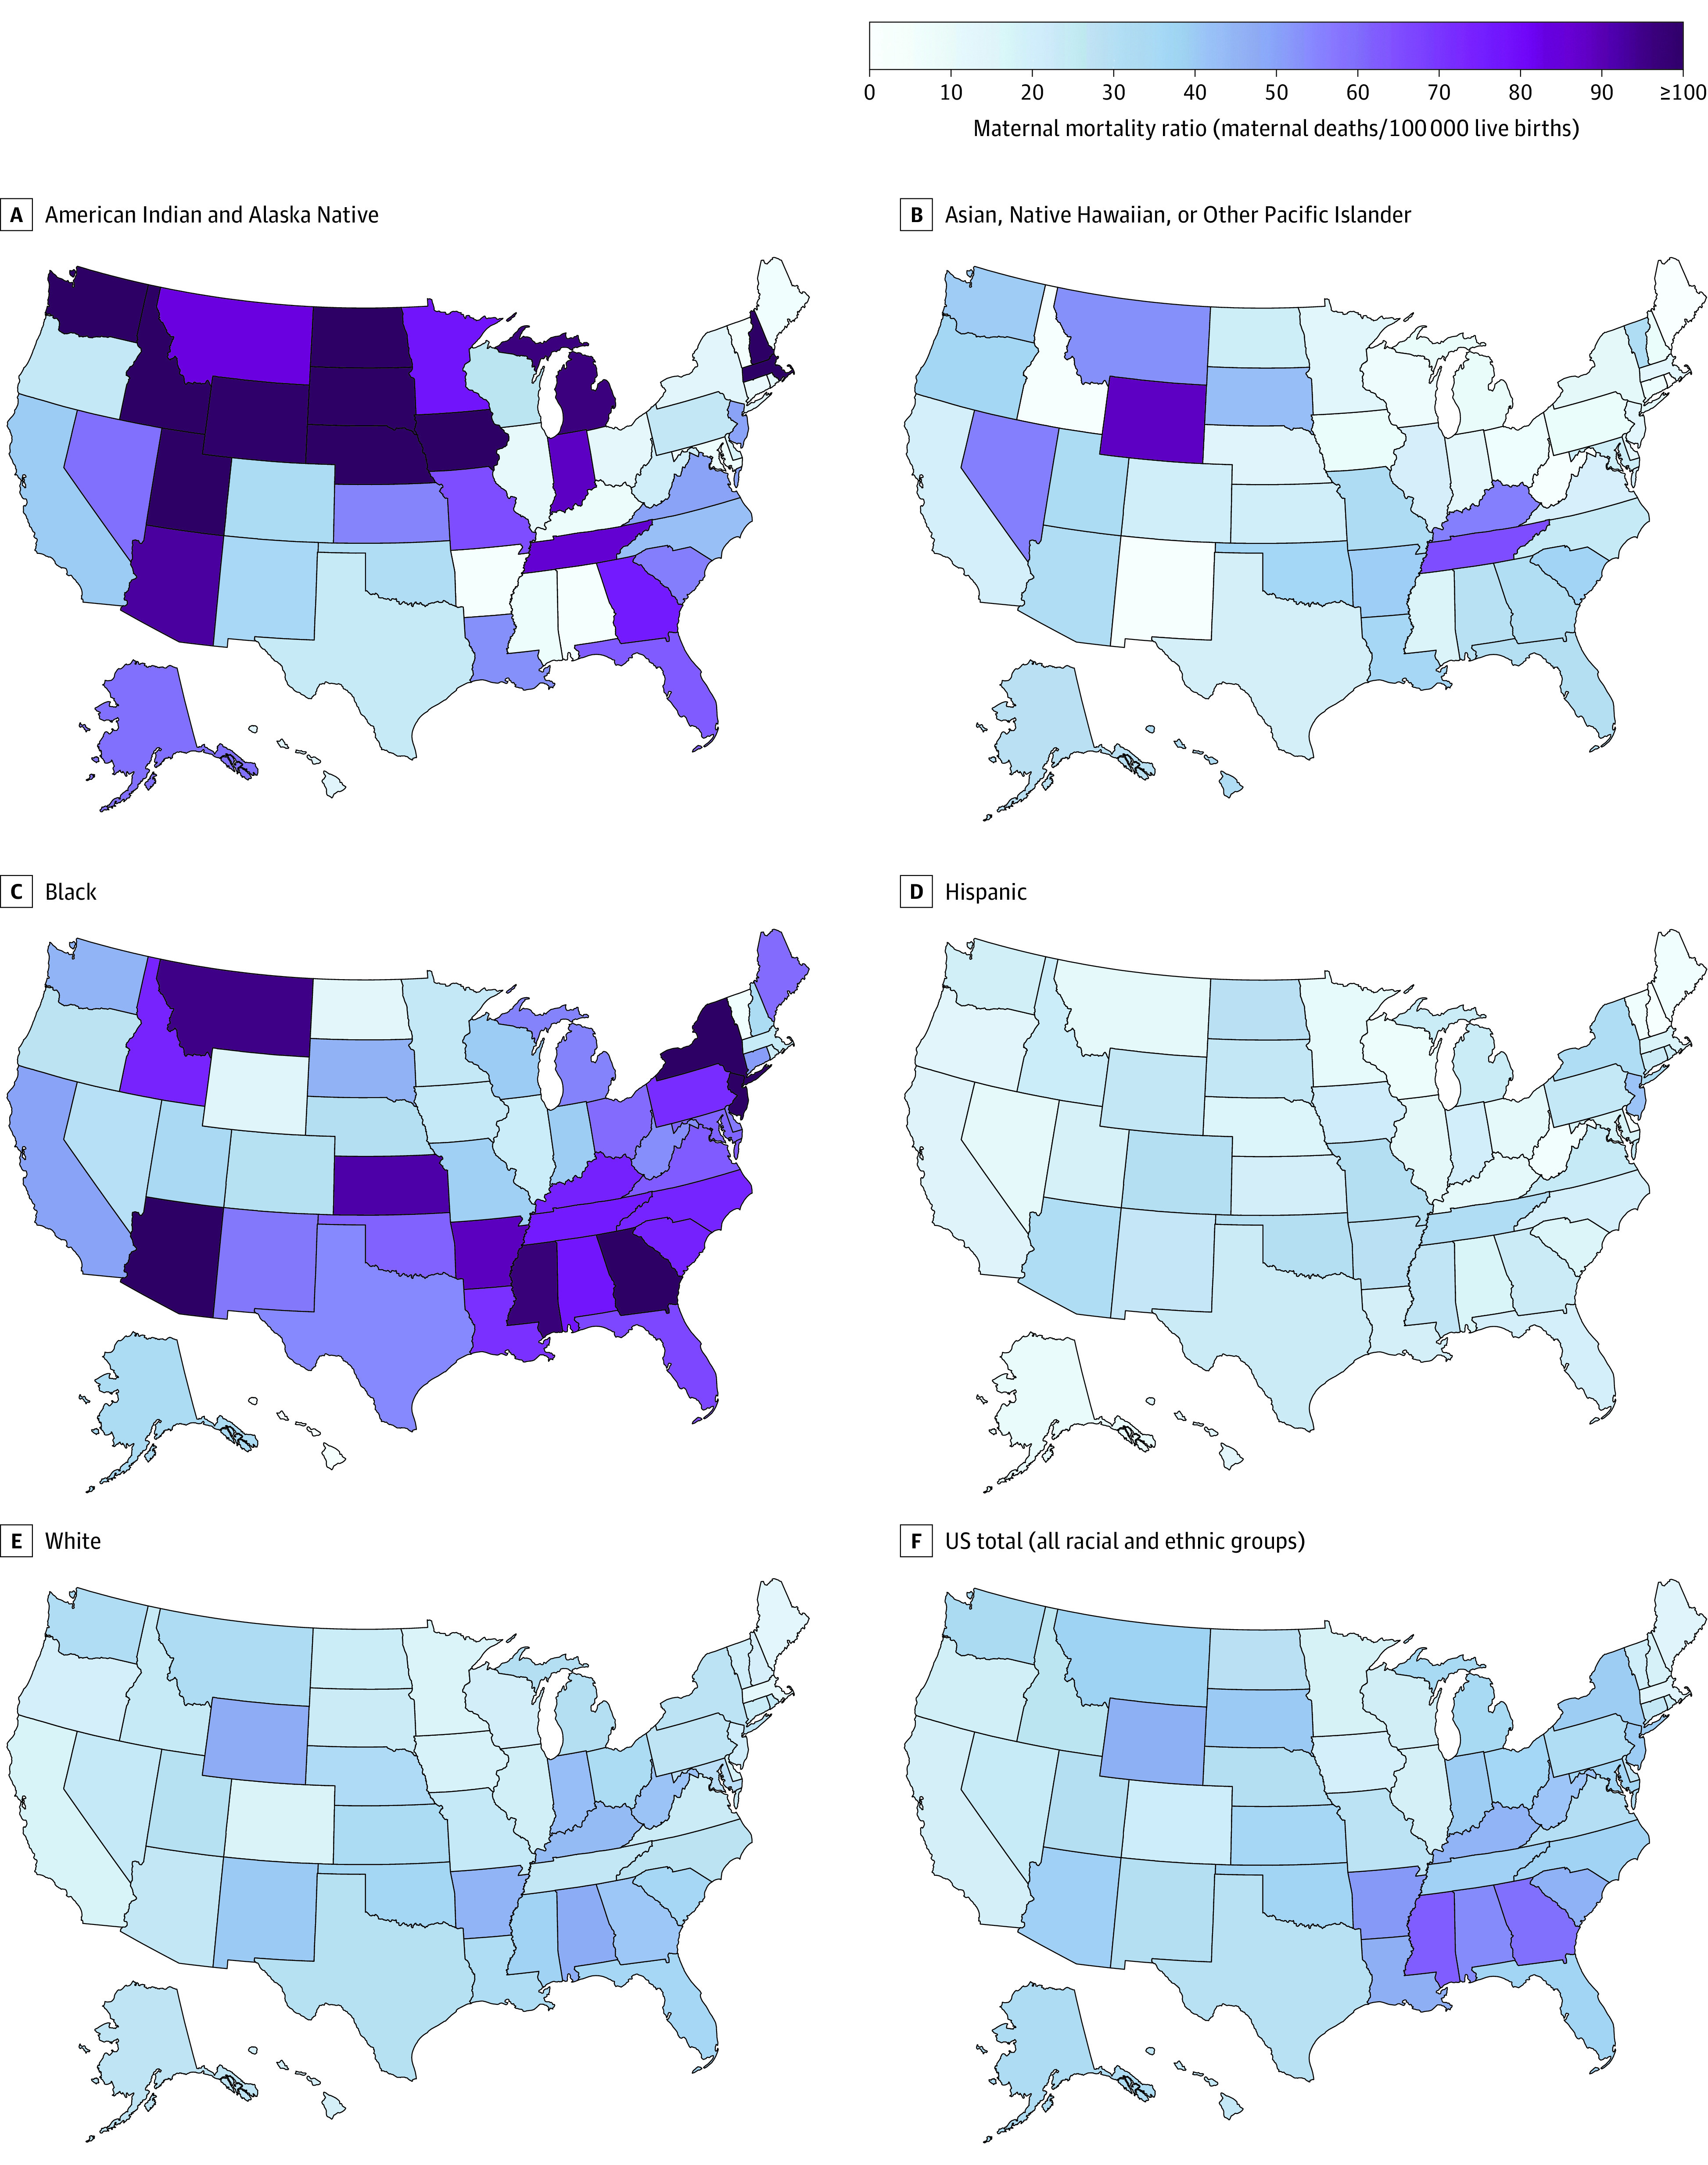
The color gradient shows MMRs by state in 2019 for 5 mutually exclusive, collectively exhaustive statistical racial and ethnic groups (A-E) and for the total US population (F). MMR values ranged from 0.5 to 300.8 and are in eTable 3 in Supplement 2. In 2019, there were an estimated 1210 total maternal deaths and 3 750 000 live births in the US. The number of maternal deaths and births by region and racial and ethnic groups are in the Table. State-level MMR estimates for 1999 are in eFigure 2 in Supplement 2. The map depicts geographic area; Alaska and Hawaii are not shown to scale.
Comparison of 1999-2009 and 2010-2019 MMRs by State and Racial and Ethnic Group
Disparities for the American Indian and Alaska Native and Black populations are particularly divergent from the other 3 racial and ethnic populations. To better understand these disparities, we also analyzed data aggregated across 2 groups of years (1999-2009 and 2010-2019) at the state and race and ethnicity levels. Figure 2 shows that MMRs increased in nearly all states and among all racial and ethnic groups between the first and second decades of this century. There were no state-level racial and ethnic groups for which there was a significant percentage decrease in MMRs between the 2 periods, and, for most racial and ethnic groups in most states, there was a significant percentage increase (eTable 4 in Supplement 2).
Figure 2. Percentage Change in Maternal Mortality Ratios (MMRs), 1999-2009 to 2010-2019.
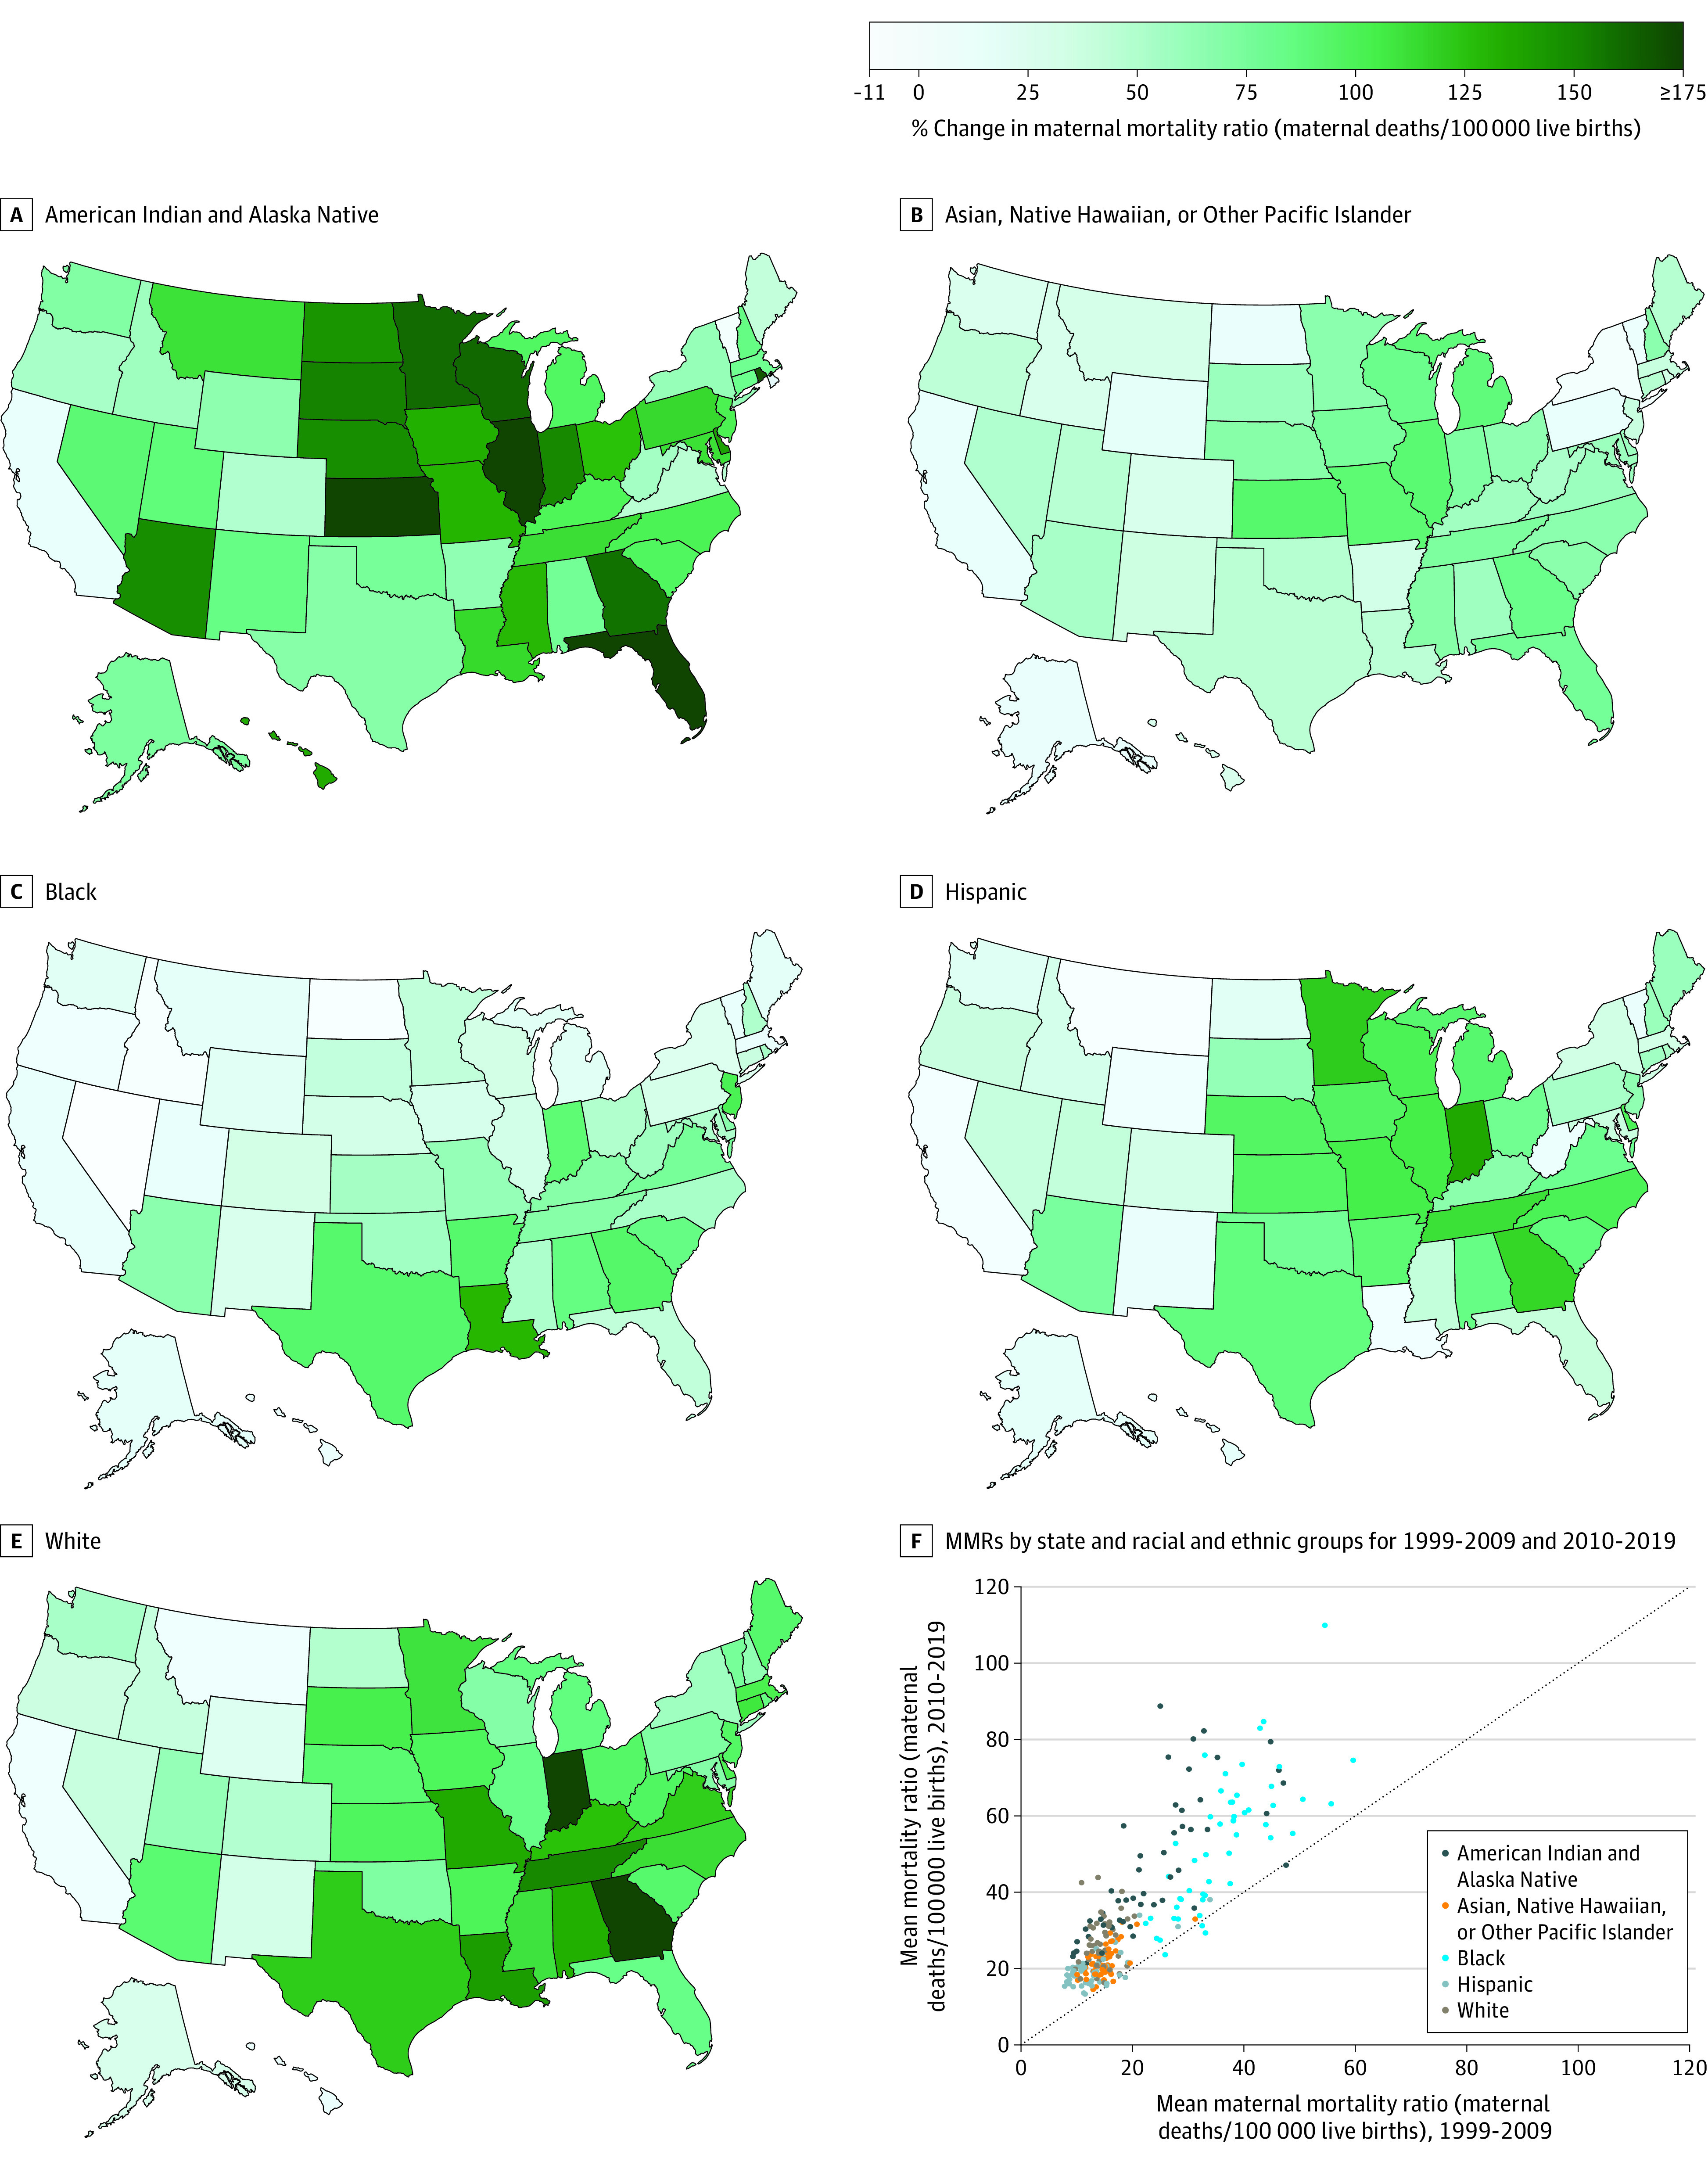
The color gradient shows percentage change in MMRs by state between the means of 2 10-year periods (A-E). The scatterplot shows mean MMRs by state and racial and ethnic group for 2 10-year periods with MMRs estimated using the aggregate of all deaths and births in each period for each state and racial and ethnic group (F).
In the American Indian and Alaska Native population (Figure 2A), the 5 states with the largest percentage increases were Florida, Kansas, Illinois, Rhode Island, and Wisconsin, which were all greater than 162%. In the Asian, Native Hawaiian, or Other Pacific Islander population (Figure 2B), the 5 states with the largest percentage increases were Kansas, Illinois, Missouri, Michigan, and Georgia, which were all greater than 83%. In the Black population (Figure 2C), the 5 states with the largest increases were Louisiana, New Jersey, Georgia, Arkansas, and Texas, which were all greater than 93%. In the Hispanic population (Figure 2D), the 5 states with the largest percentage increases were Indiana, Minnesota, Georgia, Tennessee, and Illinois, which were all greater than 105%. In the White population (Figure 2E), the 5 states with the largest increases were Indiana, Georgia, Tennessee, Louisiana, and Missouri, which were all greater than 135%. The American Indian and Alaska Native and Black populations in most states had higher MMRs than the other 3 racial and ethnic groups in the first decade and they remained high in the second decade (Figure 2F). eFigure 3 in Supplement 1 shows that both the median and the range of state MMR values increased between these 2 decades for every racial and ethnic group.
Annual State-Level MMRs by Racial and Ethnic Group Between 1999 and 2019
Figure 3 shows boxplots of state MMR values for each year from 1999 to 2019 by racial and ethnic group. Both the spread of MMR values across states and the median state MMR values increased between 1999 and 2019 for all racial and ethnic groups. The smallest increase was in the Hispanic population, whose median state MMR increased from 9.6 (IQR, 6.9-11.6) in 1999, peaked at 20.1 (IQR, 15.5-27.3) in 2018, and decreased slightly in 2019 (19.1 [IQR, 11.6-24.9]) (see eTable 5 in Supplement 2 for the values shown in Figure 3). In the White population, median state MMR increased from 9.4 (IQR, 7.41-11.4) in 1999, peaked in 2016 at 27.7 (IQR, 20.8-36.8), and leveled off from 2016 to 2019 (26.3 [IQR, 20.3-33.3]). In the Asian, Native Hawaiian, or Other Pacific Islander population, median state MMR increased from 9.6 (IQR, 5.7-12.6) in 1999 to a peak of 20.9 (IQR, 12.1-32.8) in 2019. The American Indian and Alaska Native population experienced the largest increase in median state MMR between 1999 and 2019, from 14.0 (IQR, 5.7-23.9) in 1999 to a peak of 49.2 (IQR, 14.4 -88.0) in 2019. In the Black population, median state MMR increased from 26.7 (IQR, 18.3-32.9) in 1999 to a peak of 55.4 (IQR, 31.6-74.5) in 2019. For every year from 1999 to 2019, the Black population had the highest median state MMR value.
Figure 3. Distribution of State-Level Maternal Mortality Ratios (MMRs) by Year for 5 Racial and Ethnic Groups, 1999-2019.
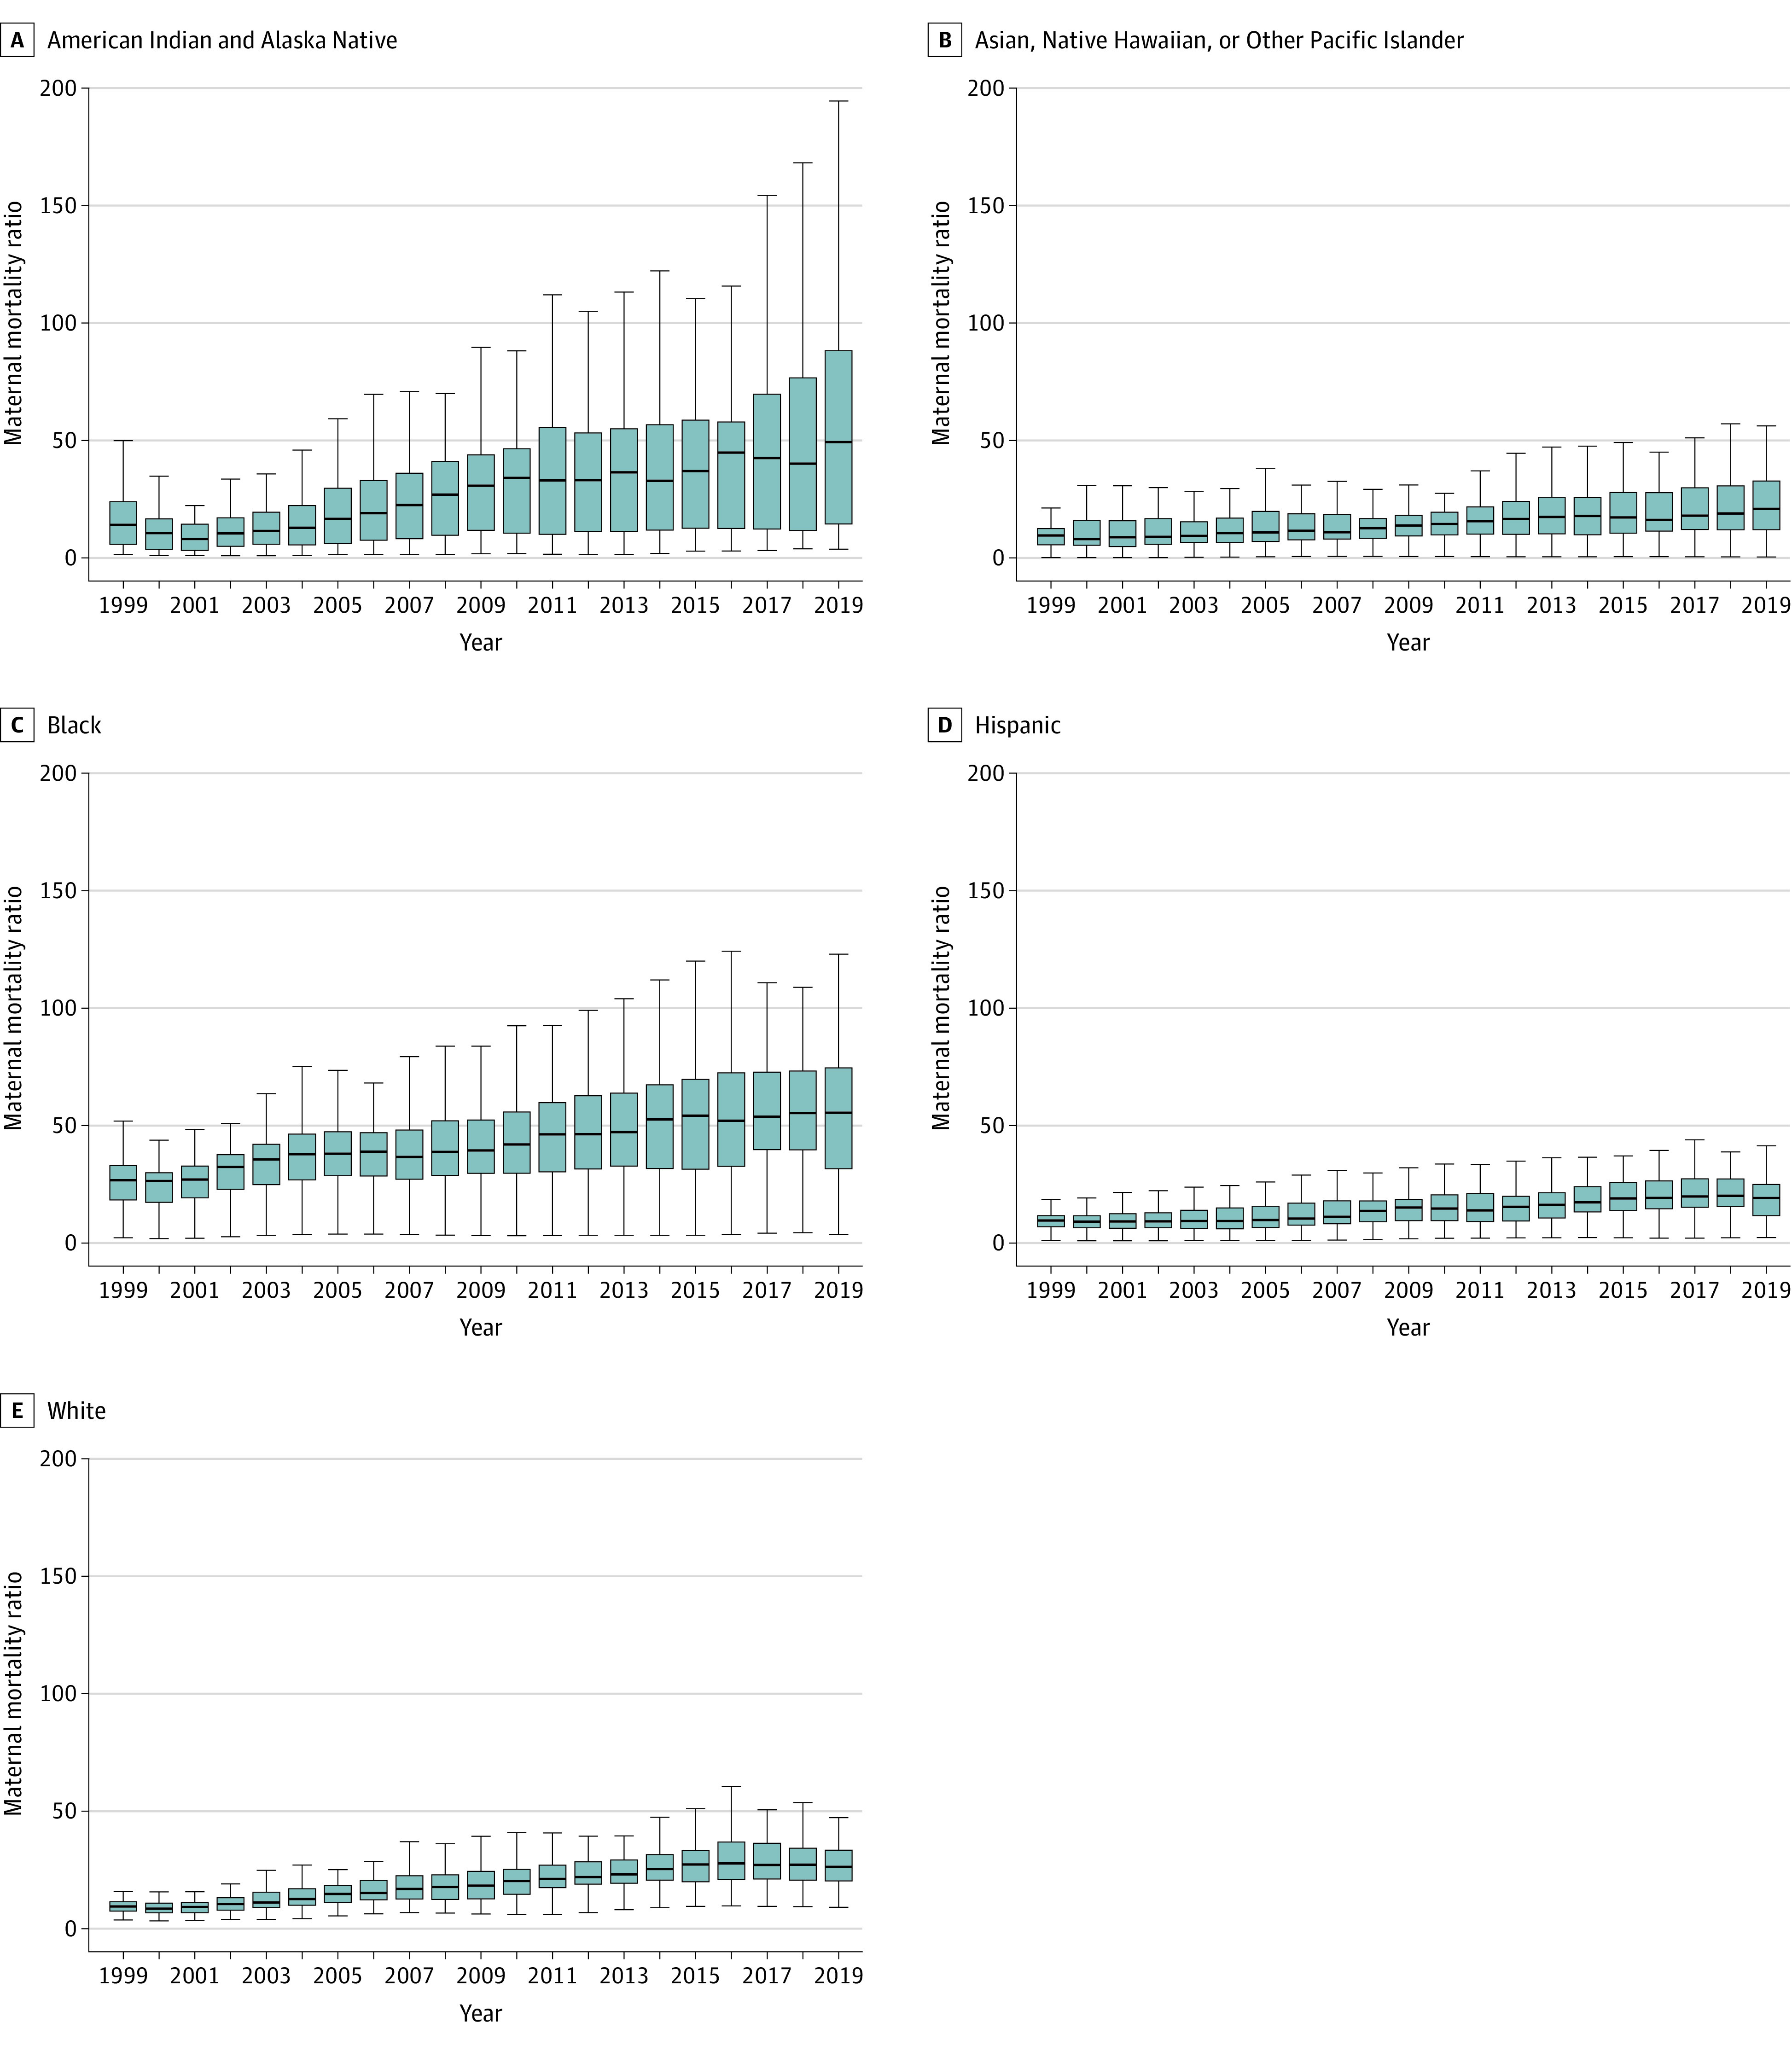
Box and whisker plots show the distribution of state MMRs by year. The boxes show the medians and IQRs of the distribution of state MMR values for each year and group. Whiskers show the distribution to 1.5 times above and below the IQR for each year and group. More extreme values (state MMR values greater than 1.5 times the IQR) are not depicted. Actual values are presented in eTable 5 in Supplement 2. National estimates of deaths, births, and MMRs are presented in the Table. Death and birth estimates, respectively, were 74 and 764 000 in 1999 and 184 and 887 000 in 2019 for the Hispanic population; 7 and 37 800 in 1999 and 23 and 33 300 in 2019 for the American Indian and Alaska Native population; 17 and 178 000 in 1999 and 56 and 269 000 in 2019 for the Asian, Native Hawaiian, or Other Pacific Islander population; 186 and 593 000 in 1999 and 393 and 581 000 in 2019 for the Black population; and 220 and 2 390 000 in 1999 and 551 and 1 980 000 in 2019 for the White population.
Discussion
Persistent disparities exist among the American Indian and Alaska Native and Black populations relative to the Asian, Native Hawaiian, or Other Pacific Islander; Hispanic; and White populations. These disparities do not appear to have improved over time; during the 20 years studied in this analysis, the findings indicated that MMRs increased significantly for both the American Indian and Alaska Native and Black populations in more than half of states. In every year of the period analyzed, maternal death risk across states was highest in the Black population, indicating that, despite current prevention efforts, risk of maternal death for the Black population has not decreased. The American Indian and Alaska Native population experienced the greatest increase in maternal death risk across states during this time, with 2019 being the year for which the risk was highest in this group. Given the relatively small number of maternal deaths compared with total mortality as well as concerns for breaches of anonymity, previous reports of maternal deaths have often lacked granularity at the within-state and by race and ethnicity levels.6 This has resulted, particularly in less populous states, in aggregate reporting over multiple years or over geographic region, which may have limited the development and implementation of specific and timely interventions and policies. Using statistical models, MMRs in the current study were estimated for every state, year, and racial and ethnic group, providing a novel approach to understanding patterns of maternal mortality in the US. Comprehensive estimates of maternal mortality may be useful for guiding policy decisions and for benchmarking progress in reducing disparities over time.
The results of the current study reveal marked inequities facing the American Indian and Alaska Native population. While median state maternal mortality plateaus in the terminal 3 to 4 years among the Black, Hispanic, and White populations, maternal mortality continues to increase in the American Indian and Alaska Native population. Recent data from 36 states have elevated concern about maternal mortality among American Indian and Alaska Native individuals, elucidating mental health conditions and hemorrhage as major contributors to pregnancy-related deaths for this group.15 The profound disparity observed suggests that a national approach to reducing inequities among American Indian and Alaska Native populations may be required.
Consistent with previous findings, the states with the highest overall MMRs were in the South; however, prior reports did not include MMRs for states with fewer than 20 maternal deaths, which is nearly half of all states.2 These results show that important disparities also exist across the US. In Wyoming and Montana, 2019 MMR values were high relative to other states for multiple racial and ethnic groups. In Arizona and Tennessee, 2019 MMR values were lower in the White population relative to other states but higher in all other racial and ethnic groups relative to other states. Oregon, Hawaii, Colorado, Illinois, Wisconsin, Delaware, Vermont, and Rhode Island had lower 2019 MMR values for all racial and ethnic groups, suggesting that either underlying risk factors that drive maternal deaths are lower in these states or that prevention efforts have had some success in these locations.
These results showed lower MMR values across the US for the Hispanic and White populations. Studies of pregnancy-related deaths have identified mental health as a leading cause of maternal mortality among Hispanic and White populations.16 Deaths due to suicide or overdose were not included in this analysis due to death certificate coding rules that consider suicide or overdose to be the underlying cause of death when they occur; this may partially contribute to the findings of lower MMRs for these 2 groups.7 The results for the Hispanic population are also consistent with trends seen in other health conditions, where Hispanic individuals fare better than other racial and ethnic minority groups.17 “Hispanic” is a broadly constructed ethnicity category in which there is a large disparity in mortality based on US nativity (ie, whether individuals were born in the US). When interpreting results for Hispanic individuals, it is important to consider that mortality rates overall reflect the mean rates among US-born and non–US-born Hispanic individuals, as well as individuals of different ethnic or national backgrounds.18
Maternal mortality trends in the Asian, Native Hawaiian, or Other Pacific Islander population were unique as MMR values were only high in a small number of states relative to other racial and ethnic populations. MMR values were notably high in the Asian, Native Hawaiian, or Other Pacific Islander population in Wyoming, Montana, and Nevada, where Filipino individuals represent the largest Asian, Native Hawaiian, and Other Pacific Islander population.19 Individuals of Filipino ethnic background have been documented to have poorer perinatal outcomes compared with those of Chinese or Japanese ethnicity.20 These results showed that Asian, Native Hawaiian, and Other Pacific Islander individuals who live in these states are at increased risk of maternal death, suggesting that specific Asian, Native Hawaiian, or Other Pacific Islander populations may be important targets for interventions that reduce maternal mortality.
Most maternal deaths are deemed preventable by state review committees.7 Prevention efforts are, therefore, essential and should be informed by patterns of maternal deaths and specific inequities within states. Additional investigation is needed to better understand what factors are contributing to increasing maternal mortality and how systemic racism, which is associated with broader social determinants of health and individual health characteristics, relates to persistent inequities in maternal mortality in the US and how interventions to dismantle these structural barriers might improve outcomes.5
Limitations
The present study had several limitations. First, a number of individuals may have been incorrectly classified by race and ethnicity on their death certificate. While the effects of misclassification by race and ethnicity have been estimated as small at the national level, there is a possibility that some degree of misclassification remains in this analysis.21 Misclassification is most common for the American Indian and Alaska Native population, which could result in underestimation of MMRs for this group. Because birth certificates are not standardized across states, information collected about maternal race and ethnicity may differ by state.
Second, the current study includes all maternal deaths but does not stratify according to the use of the US standard pregnancy question (the pregnancy checkbox) on death certificates. Each state added the checkbox over a prolonged period between 2003 and 2017, and maternal deaths may be coded as such either by indication of an underlying maternal cause of death and/or by indication on the pregnancy checkbox. As a result, it is possible that some of the increases in maternal mortality over time are due to an increasing number of states incorporating the pregnancy checkbox on their death certificates.
Third, because the National Vital Statistics System automatically recodes any death certificate without a maternal death ICD-10 code (except for select unintentional injuries and injury-related causes) to a maternal death ICD-10 code if the pregnancy checkbox was checked by the individual certifying the death, it is not currently possible to separately examine maternal deaths reported based on the pregnancy checkbox alone. These estimates rely on the final underlying cause of death as determined by the National Center for Health Statistics. It is possible that the recoding process has resulted in some nonmaternal deaths being recoded as maternal, which would bias these estimates upward. Recoding, however, should not introduce bias differentially by race or ethnicity. Further studies are needed to understand the impact of the use of the pregnancy checkbox on the reporting of maternal mortality and the potential for both under- and overreporting of maternal deaths.
Fourth, these data do not contain information on the amount of time between birth and maternal death. Fifth, it is important to note that high MMR values in year-state-race and ethnicity groups with very small numbers of live births reflect, in part, the very small number of births. Sixth, given that this analysis excluded unintentional injuries, homicides, and suicides, as well as pregnancy-associated causes of death such as mental health disorders, these estimates are likely to be conservative relative to the true burden of mortality.
Conclusions
While maternal mortality remains unacceptably high among all racial and ethnic groups in the US, American Indian and Alaska Native and Black individuals are at increased risk, particularly in several states where these inequities have not been previously highlighted. A checkbox indicating pregnancy on death certificates was adopted by states at different times during the past 2 decades, which complicates comparisons across years. Disparities across racial and ethnic groups persisted and median state MMRs for the American Indian and Alaska Native and Asian, Native Hawaiian, or Other Pacific Islander populations continue to increase even after the pregnancy checkbox was adopted. Of note, median state MMRs for the Black population remains the highest in the US. Comprehensive mortality surveillance for all states via vital registration identifies states and racial and ethnic groups where maternal mortality is increasing. Maternal mortality persists as a source of worsening disparities in many US states and prevention efforts during this study period appear to have had a limited impact in addressing this health crisis.
Educational Objective: To identify the key insights or developments described in this article.
-
The authors modeled mean maternal death risk for each race and ethnicity in each US state. Why was modeling necessary?
Modeling allowed for the estimation of mean maternal death risk for each racial and ethnic group in each state.
Modeling helped account for cause of death when the information was missing from death certificates.
Modeling was necessary for deaths due to unintentional injuries, homicides, and suicide.
-
Comparison of maternal mortality rates over the 2 10-year blocks of 1999-2009 and 2010-2019 revealed that
Change in maternal mortality rates over the 2 decades was highly variable.
For most racial and ethnic groups in most states, there was a significant percentage increase in maternal mortality ratio.
Maternal mortality rates dropped in nearly every state and for nearly every race and ethnicity.
-
Results showed lower maternal mortality rates across the US for Hispanic and non-Hispanic White compared with other groups. Why do the authors suggest this may be an inaccurate conclusion?
Difficulty collecting accurate data for non–US-born Hispanic individuals biased the findings toward a lower-risk subgroup of individuals.
Mental health is a leading cause of maternal mortality among Hispanic and non-Hispanic White populations, and deaths from suicide and overdose were excluded and may have biased the findings.
Narrow construction of the “Hispanic” category omitted higher-risk groups.
eMethods
eReferences
eFigure 1. Workflow
eFigure 2. Maternal Mortality Ratios by State and Race and Ethnicity Groups and the Total US Population, 1999
eFigure 3. Distribution of State-Level Maternal Mortality Ratios by Year for 5 Race and Ethnicity Groups, 1999-2009 and 2010-2019
eTable 1. GATHER Compliance
eReferences
eTable 2. ICD-10 Codes and WHO Descriptions
eTable 3. Maternal Mortality Ratio (Maternal Deaths/100,000 Live Births) by State and Race/Ethnicity group, 2019
eTable 4. MMR by State and Race/Ethnicity group, 1999-2009 and 2010-2019
eTable 5. Distribution of State-Level Maternal Mortality Ratios by Year for 5 Race/Ethnicity groups, 1999-2019
Data Sharing Statement
References
- 1.Reinhardt UE, Hussey PS, Anderson GFUS. US health care spending in an international context. Health Aff (Millwood). 2004;23(3):10-25. doi: 10.1377/hlthaff.23.3.10 [DOI] [PubMed] [Google Scholar]
- 2.Declercq E, Zephyrin L. Maternal Mortality in the United States: A Primer. Commonwealth Fund; 2020. [Google Scholar]
- 3.Institute for Health Metrics and Evaluation . GBD Compare. University of Washington. Published October 15, 2020. Accessed February 16, 2023. https://vizhub.healthdata.org/gbd-compare
- 4.Leonard SA, Main EK, Scott KA, Profit J, Carmichael SL. Racial and ethnic disparities in severe maternal morbidity prevalence and trends. Ann Epidemiol. 2019;33:30-36. doi: 10.1016/j.annepidem.2019.02.007 [DOI] [PMC free article] [PubMed] [Google Scholar]
- 5.Hardeman RR, Kheyfets A, Mantha AB, et al. Developing tools to report racism in maternal health for the CDC Maternal Mortality Review Information Application (MMRIA): findings from the MMRIA racism & discrimination working group. Matern Child Health J. 2022;26(4):661-669. doi: 10.1007/s10995-021-03284-3 [DOI] [PubMed] [Google Scholar]
- 6.Heck JL, Jones EJ, Bohn D, et al. Maternal mortality among American Indian/Alaska Native women: a scoping review. J Womens Health (Larchmt). 2021;30(2):220-229. doi: 10.1089/jwh.2020.8890 [DOI] [PubMed] [Google Scholar]
- 7.Davis NL, Smoots AN, Goodman DA. Pregnancy-related deaths: data from 14 US Maternal Mortality Review Committees, 2008-2017. Centers for Disease Control and Prevention. Published April 13, 2022. Accessed October 13, 2022. https://www.cdc.gov/reproductivehealth/maternal-mortality/erase-mm/mmr-data- brief.html
- 8.MacDorman MF, Declercq E, Cabral H, Morton C. Recent Increases in the US maternal mortality rate: disentangling trends from measurement issues. Obstet Gynecol. 2016;128(3):447-455. doi: 10.1097/AOG.0000000000001556 [DOI] [PMC free article] [PubMed] [Google Scholar]
- 9.Gill J, Blackman J. Texas delays publication of maternal death data until after midterms, legislative session. Houston Chronicle. Published September 13, 2022.
- 10.US Department of Health and Human Services Office of Minority Health . Explanation of data standards for race, ethnicity, sex, primary language, and disability. Published May 18, 2021. Accessed October 24, 2022. https://minorityhealth.hhs.gov/omh/browse.aspx?lvl=3&lvlid=54
- 11.National Center for Health Statistics . A reference guide for certification of deaths associated with pregnancy on death certificates. Vital Statistics Reporting Guidance. Published March 2022. Accessed October 14, 2022.
- 12.GBD US Health Disparities Collaborators . Life expectancy by county, race, and ethnicity in the USA, 2000-19: a systematic analysis of health disparities. Lancet. 2022;400(10345):25-38. doi: 10.1016/S0140-6736(22)00876-5 [DOI] [PMC free article] [PubMed] [Google Scholar]
- 13.Van Rossum G, Drake FL. Python 3 Reference Manual. CreateSpace; 2009. [Google Scholar]
- 14.R: The R Project for Statistical Computing. Accessed October 13, 2022. https://www.r-project.org/
- 15.Trost S, Beauregard J, Chandra G, et al. Pregnancy-related deaths among American Indian or Alaska Native persons: data from Maternal Mortality Review Committees in 36 US States, 2017-2019. Centers for Disease Control and Prevention. Published September 19, 2022. Accessed October 13, 2022. https://www.cdc.gov/reproductivehealth/maternal-mortality/erase-mm/data-mmrc-aian.html
- 16.Trost S, Beauregard J, Chandra G, et al. Pregnancy-related deaths: data from Maternal Mortality Review Committees in 36 US States, 2017-2019. Centers for Disease Control and Prevention. Published September 19, 2022. Accessed October 13, 2022. https://www.cdc.gov/reproductivehealth/maternal-mortality/erase-mm/data-mmrc.html
- 17.Montoya-Williams D, Williamson VG, Cardel M, Fuentes-Afflick E, Maldonado-Molina M, Thompson L. The Hispanic/Latinx perinatal paradox in the United States: a scoping review and recommendations to guide future research. J Immigr Minor Health. 2021;23(5):1078-1091. doi: 10.1007/s10903-020-01117-z [DOI] [PubMed] [Google Scholar]
- 18.Rodriguez F, Hastings KG, Hu J, et al. Nativity status and cardiovascular disease mortality among Hispanic adults. J Am Heart Assoc. 2017;6(12):e007207. doi: 10.1161/JAHA.117.007207 [DOI] [PMC free article] [PubMed] [Google Scholar]
- 19.US Census Bureau . Decennial census of population and housing datasets: 2010. Accessed October 13, 2022. https://www.census.gov/programs-surveys/decennial-census/data/datasets.2010.html
- 20.Wong LF, Caughey AB, Nakagawa S, Kaimal AJ, Tran SH, Cheng YW. Perinatal outcomes among different Asian-American subgroups. Am J Obstet Gynecol. 2008;199(4):382.e1-382.e6. doi: 10.1016/j.ajog.2008.06.073 [DOI] [PubMed] [Google Scholar]
- 21.Arias E, Heron M, Hakes J; National Center for Health Statistics, Hakes J; US Census Bureau . The validity of race and Hispanic-origin reporting on death certificates in the United States: an update. Vital Health Stat 2. 2016;(172):1-21. [PubMed] [Google Scholar]
Associated Data
This section collects any data citations, data availability statements, or supplementary materials included in this article.
Supplementary Materials
eMethods
eReferences
eFigure 1. Workflow
eFigure 2. Maternal Mortality Ratios by State and Race and Ethnicity Groups and the Total US Population, 1999
eFigure 3. Distribution of State-Level Maternal Mortality Ratios by Year for 5 Race and Ethnicity Groups, 1999-2009 and 2010-2019
eTable 1. GATHER Compliance
eReferences
eTable 2. ICD-10 Codes and WHO Descriptions
eTable 3. Maternal Mortality Ratio (Maternal Deaths/100,000 Live Births) by State and Race/Ethnicity group, 2019
eTable 4. MMR by State and Race/Ethnicity group, 1999-2009 and 2010-2019
eTable 5. Distribution of State-Level Maternal Mortality Ratios by Year for 5 Race/Ethnicity groups, 1999-2019
Data Sharing Statement