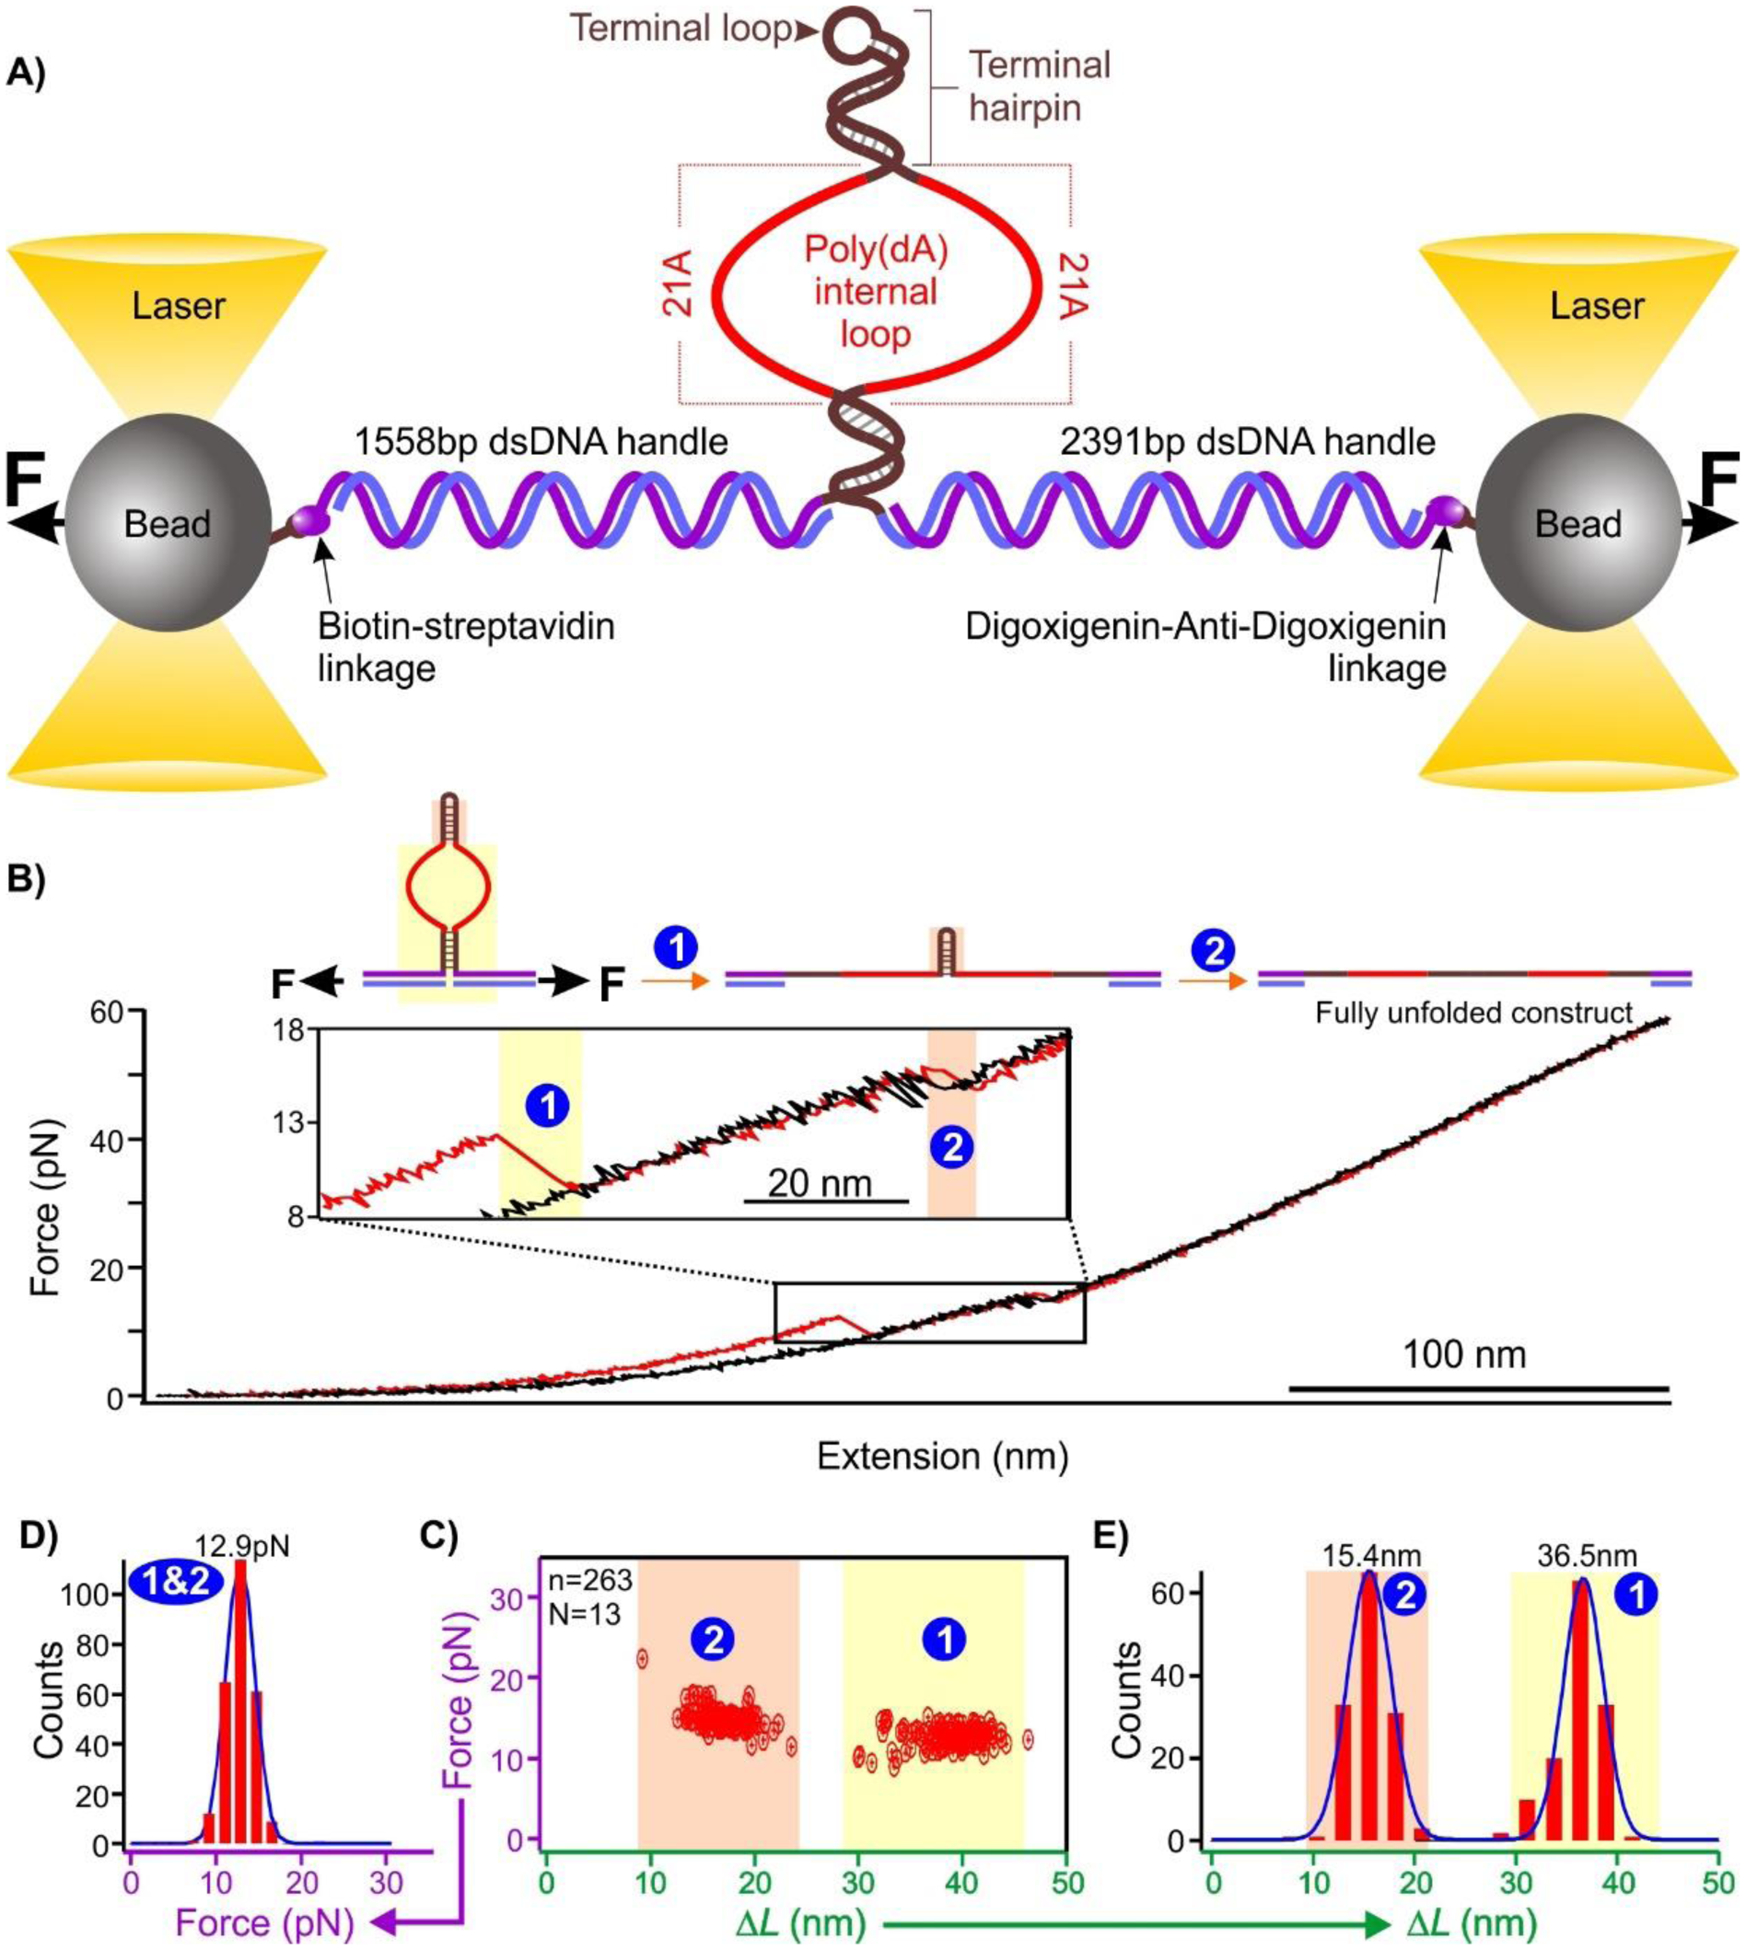
Figure 1.

A) Schematic of the single-molecule platform to investigate the binding of poly(dA) to gold nanospheres. See Table S1 for DNA sequences. B) A typical force extension curve when a DNA construct is stretched (red) and relaxed (black) in the optical tweezers instrument. C) Scatter plot of force vs change-in-contour length (ΔL). D) Unfolding force and E) change-in-contour-length (ΔL) histograms of the unfolding features shown in C). Solid curves are Gaussian fittings. N represents the number of molecules from which the FX curves were collected, and n represents the total number of unfolding features measured.
