

Significance
Currently, no pharmacological therapies treat skeletal muscle insulin resistance in pathological conditions such as type 2 diabetes, age-associated diseases, and cancer. Therefore, there is an unmet need to identify the molecular mechanisms controlling skeletal muscle insulin sensitivity. Using a multitude of model systems, including myoblasts, myotubes, mouse skeletal muscle, and human muscle, we identify the Rho guanine dissociation inhibitor α (RhoGDIα) as a point of control in regulating skeletal muscle insulin sensitivity. RhoGDIα’s functions have never before been described in skeletal muscle. We show that RhoGDIα inhibits muscle insulin action mechanistically by modulating Rac1 activity, thereby, highlighting RhoGDIα as a new clinically relevant controller of skeletal muscle insulin sensitivity and whole-body glucose homeostasis.
Keywords: insulin sensitivity, skeletal muscle, glucose uptake, GLUT4 translocation, type 2 diabetes
Abstract
The molecular events governing skeletal muscle glucose uptake have pharmacological potential for managing insulin resistance in conditions such as obesity, diabetes, and cancer. With no current pharmacological treatments to target skeletal muscle insulin sensitivity, there is an unmet need to identify the molecular mechanisms that control insulin sensitivity in skeletal muscle. Here, the Rho guanine dissociation inhibitor α (RhoGDIα) is identified as a point of control in the regulation of insulin sensitivity. In skeletal muscle cells, RhoGDIα interacted with, and thereby inhibited, the Rho GTPase Rac1. In response to insulin, RhoGDIα was phosphorylated at S101 and Rac1 dissociated from RhoGDIα to facilitate skeletal muscle GLUT4 translocation. Accordingly, siRNA-mediated RhoGDIα depletion increased Rac1 activity and elevated GLUT4 translocation. Consistent with RhoGDIα’s inhibitory effect, rAAV-mediated RhoGDIα overexpression in mouse muscle decreased insulin-stimulated glucose uptake and was detrimental to whole-body glucose tolerance. Aligning with RhoGDIα’s negative role in insulin sensitivity, RhoGDIα protein content was elevated in skeletal muscle from insulin-resistant patients with type 2 diabetes. These data identify RhoGDIα as a clinically relevant controller of skeletal muscle insulin sensitivity and whole-body glucose homeostasis, mechanistically by modulating Rac1 activity.
There is a growing awareness of the detrimental effects of skeletal muscle insulin resistance because insulin resistance contributes to several prevalent pathological conditions, including type 2 diabetes (1), age-associated diseases (2), cancer (3–5), and cardiovascular disease (6). Skeletal muscle is a paramount tissue regulating whole-body glucose homeostasis (1, 7, 8). With no current pharmacological treatments to target skeletal muscle insulin resistance, there is an unmet need to identify the molecular mechanisms that control insulin sensitivity in skeletal muscle.
Central to insulin resistance is a reduction in insulin-dependent glucose uptake into skeletal muscle, underpinned by a reduction in Glucose Transporter Type 4 (GLUT4) recruitment to the cell surface of rodent (9, 10) and human (11, 12) muscles. While the proximal steps of the insulin-stimulated signaling pathway that mediate glucose uptake in skeletal muscle are well-defined (13), the distal signaling events remain poorly understood. We and others identified the Rho GTPase Rac1 as a key regulator of skeletal muscle insulin sensitivity based on the requirement of Rac1 for insulin-stimulated glucose uptake (14–19). This pathway acts in parallel to and mostly independently of insulin-stimulated Akt activation (15, 17, 18). Importantly, Rac1 is dysregulated in insulin-resistant rodent and human skeletal muscle (17, 18). Yet, the molecular mechanisms regulating Rac1 activity in response to insulin in muscle have not been defined.
Classical Rho GTPases, including Rac1, cycle between an inactive guanosine diphosphate (GDP)-bound and an active guanosine triphosphate (GTP)-bound state, tightly controlled by GTPase-activating proteins (GAPs) and guanine nucleotide exchange factors (GEFs), respectively (20, 21). Yet, to date, only the Rho GEFs FLJ00068 and VAV2 have been shown to regulate insulin-stimulated Rac1 activity in skeletal muscle (22, 23). Therefore, there is a lack of knowledge of the mechanisms regulating Rac1 in skeletal muscle. A key point of control could be the Rho guanine dissociation inhibitor (RhoGDI), which sequesters Rho GTPases in the cytosol in the inactive state by preventing GDP to GTP exchange (24). RhoGDIs have also been reported to regulate the spatiotemporal localization of the active Rho GTPases in nonmuscle cell systems (25), yet, this layer of regulation has not before been studied in skeletal muscle.
Once activated by insulin, Rac1 activates the group I p21-activated kinases (PAK) 1 and 2 and promotes reorganization of the actin cytoskeleton to form actin ruffles in myotubes (15). PAK2, but likely not PAK1 (26) [although debated (27)], as well as actin ruffle formation, is necessary for full induction of insulin-stimulated GLUT4 translocation and glucose uptake in muscle. Another downstream target of Rac1 is the Ral family GTPase, RalA, which is also required for insulin-stimulated GLUT4 translocation in mouse skeletal muscle (28). Hence, while Rac1 plays a key role in regulating skeletal muscle insulin sensitivity in health and disease, the upstream regulators and downstream mechanisms involved in Rac1-mediated GLUT4 translocation are incompletely understood.
With the unmet need to define the molecular mechanisms that control insulin sensitivity in skeletal muscle, we aimed to identify regulators of Rac1. We hypothesized that by determining Rac1 interactors, we would be able to detect novel Rac1 regulators and thus identify new proteins regulating muscle insulin sensitivity. Our results identify RhoGDIα as a point of control of insulin sensitivity, mechanistically via RhoGDIα’s interaction with and inhibition of Rac1. We show that in response to insulin, RhoGDIα is phosphorylated at S101 and dissociates from Rac1 to activate skeletal muscle GLUT4 translocation. In agreement with insulin resistance and reduced Rac1 activity, RhoGDIα was up-regulated in the skeletal muscle of patients with type 2 diabetes, highlighting the translational value and potential clinical relevance of our findings.
Results
Identification of RhoGDIα as a Part of the Rac1 Interactome in L6 Myoblasts.
To identify the Rac1 interactome and potential novel candidates involved in the regulation of Rac1 activity and insulin sensitivity, L6 muscle cells with stable expression of C-terminal (Rac1-CTF) or N-terminal Flag-tagged Rac1 (Rac1-NTF) were generated because endogenous Rac1 could not be successfully immunopurified. We verified that the Flag-tag did not interfere with Rac1 activity by stimulating regular L6 myoblasts and Rac1-CTF, Rac1-NTF, and control L6 myoblasts transfected with a green fluorescent protein (GFP) with Rac activator II. Rac1-GTP binding, indicative of Rac1 activation, was similar between GFP and Rac1-CTF or Rac1-NTF L6 myoblasts (SI Appendix, Fig. S1A). Despite no apparent reduction in the capacity for activation of Rac1 in Rac1-CTF, the C-terminal of Rac1 contains a membrane-targeting domain (29), and the C-terminal Flag-tag could therefore potentially affect spatial localization of Rac1. Therefore, we chose Rac1-NTF L6 myoblasts for subsequent analyses including the determination of the Rac1 interactome. Immunopurification and subsequent proteomic analysis were performed in GFP and Rac1-NTF lysates incubated with either 1 mM inhibitory GDP or 0.2 mM stimulatory GTP-ϒ-S (SI Appendix, Fig. S1B). The interactome was used as a guiding tool to discover potential candidates involved in the regulation of Rac1 activity. We identified 129 proteins that interacted with Rac1-NTF (Dataset S1). Filtering those proteins with two or more peptide sequence similarities and enriched (>twofold) in the Rac1-GDP purified sample compared to GFP control, 14 proteins were identified (Fig. 1A). The lipid raft protein Stomatin complexed preferably with active GTP-bound Rac1. Thirteen proteins were preferentially in complex with inactive GDP-bound Rac1. This list included several ribosomal proteins (gene names: Rps27a, Rbp1, and Rpl15), histones (gene names: Hist1h1d, Hist1h2bl, and H3f3b), an antioxidant defense protein (gene name: Prdx1), a protein involved in intracellular trafficking (gene name: Anxa1), the RNA helicase Ddx3y, similar to 14-3-3 protein sigma (gene name: LOC298795), a major component of large cytoplasmic ribonuclear protein complexes (gene name: Mvp), a suggested myokine Dermcidin (30) (gene name: DCD), and a Rho family guanine nucleotide dissociation inhibitor α (RhoGDIα, gene name: Arhgdia). RhoGDIα stood out in particular, as it in nonmuscle cells inhibits Rho GTPase activity by preventing GDP/GTP exchange and regulates spatiotemporal localization by sequestering Rho GTPases away from the plasma membrane (31). Additionally, phosphorylation of RhoGDIα at S101 is a suggested mechanism for the dissociation of the Rac1–RhoGDIα complex in β-cells (32). RhoGDIα protein content was detected in both myoblast and myotube stages of differentiation in L6 rat skeletal muscle cells (SI Appendix, Fig. S1 C and D). In mature mouse skeletal muscle, RhoGDIα protein content was similar between the oxidative soleus, the glycolytic extensor digitorum longus (EDL), and the mixed quadriceps and gastrocnemius muscles (SI Appendix, Fig. S1 E and F). In agreement, skeletal muscle protein content of RhoGDIα has also previously been identified in both human type 1 and type 2 single fiber using proteomics (33, 34). Besides skeletal muscle, RhoGDIα was also detectable at the protein level in other tissues including perigonadal white adipose tissue (pgWAT), brown adipose tissue (BAT), liver, brain, and cardiac muscle (SI Appendix, Fig. S1G).
Fig. 1.
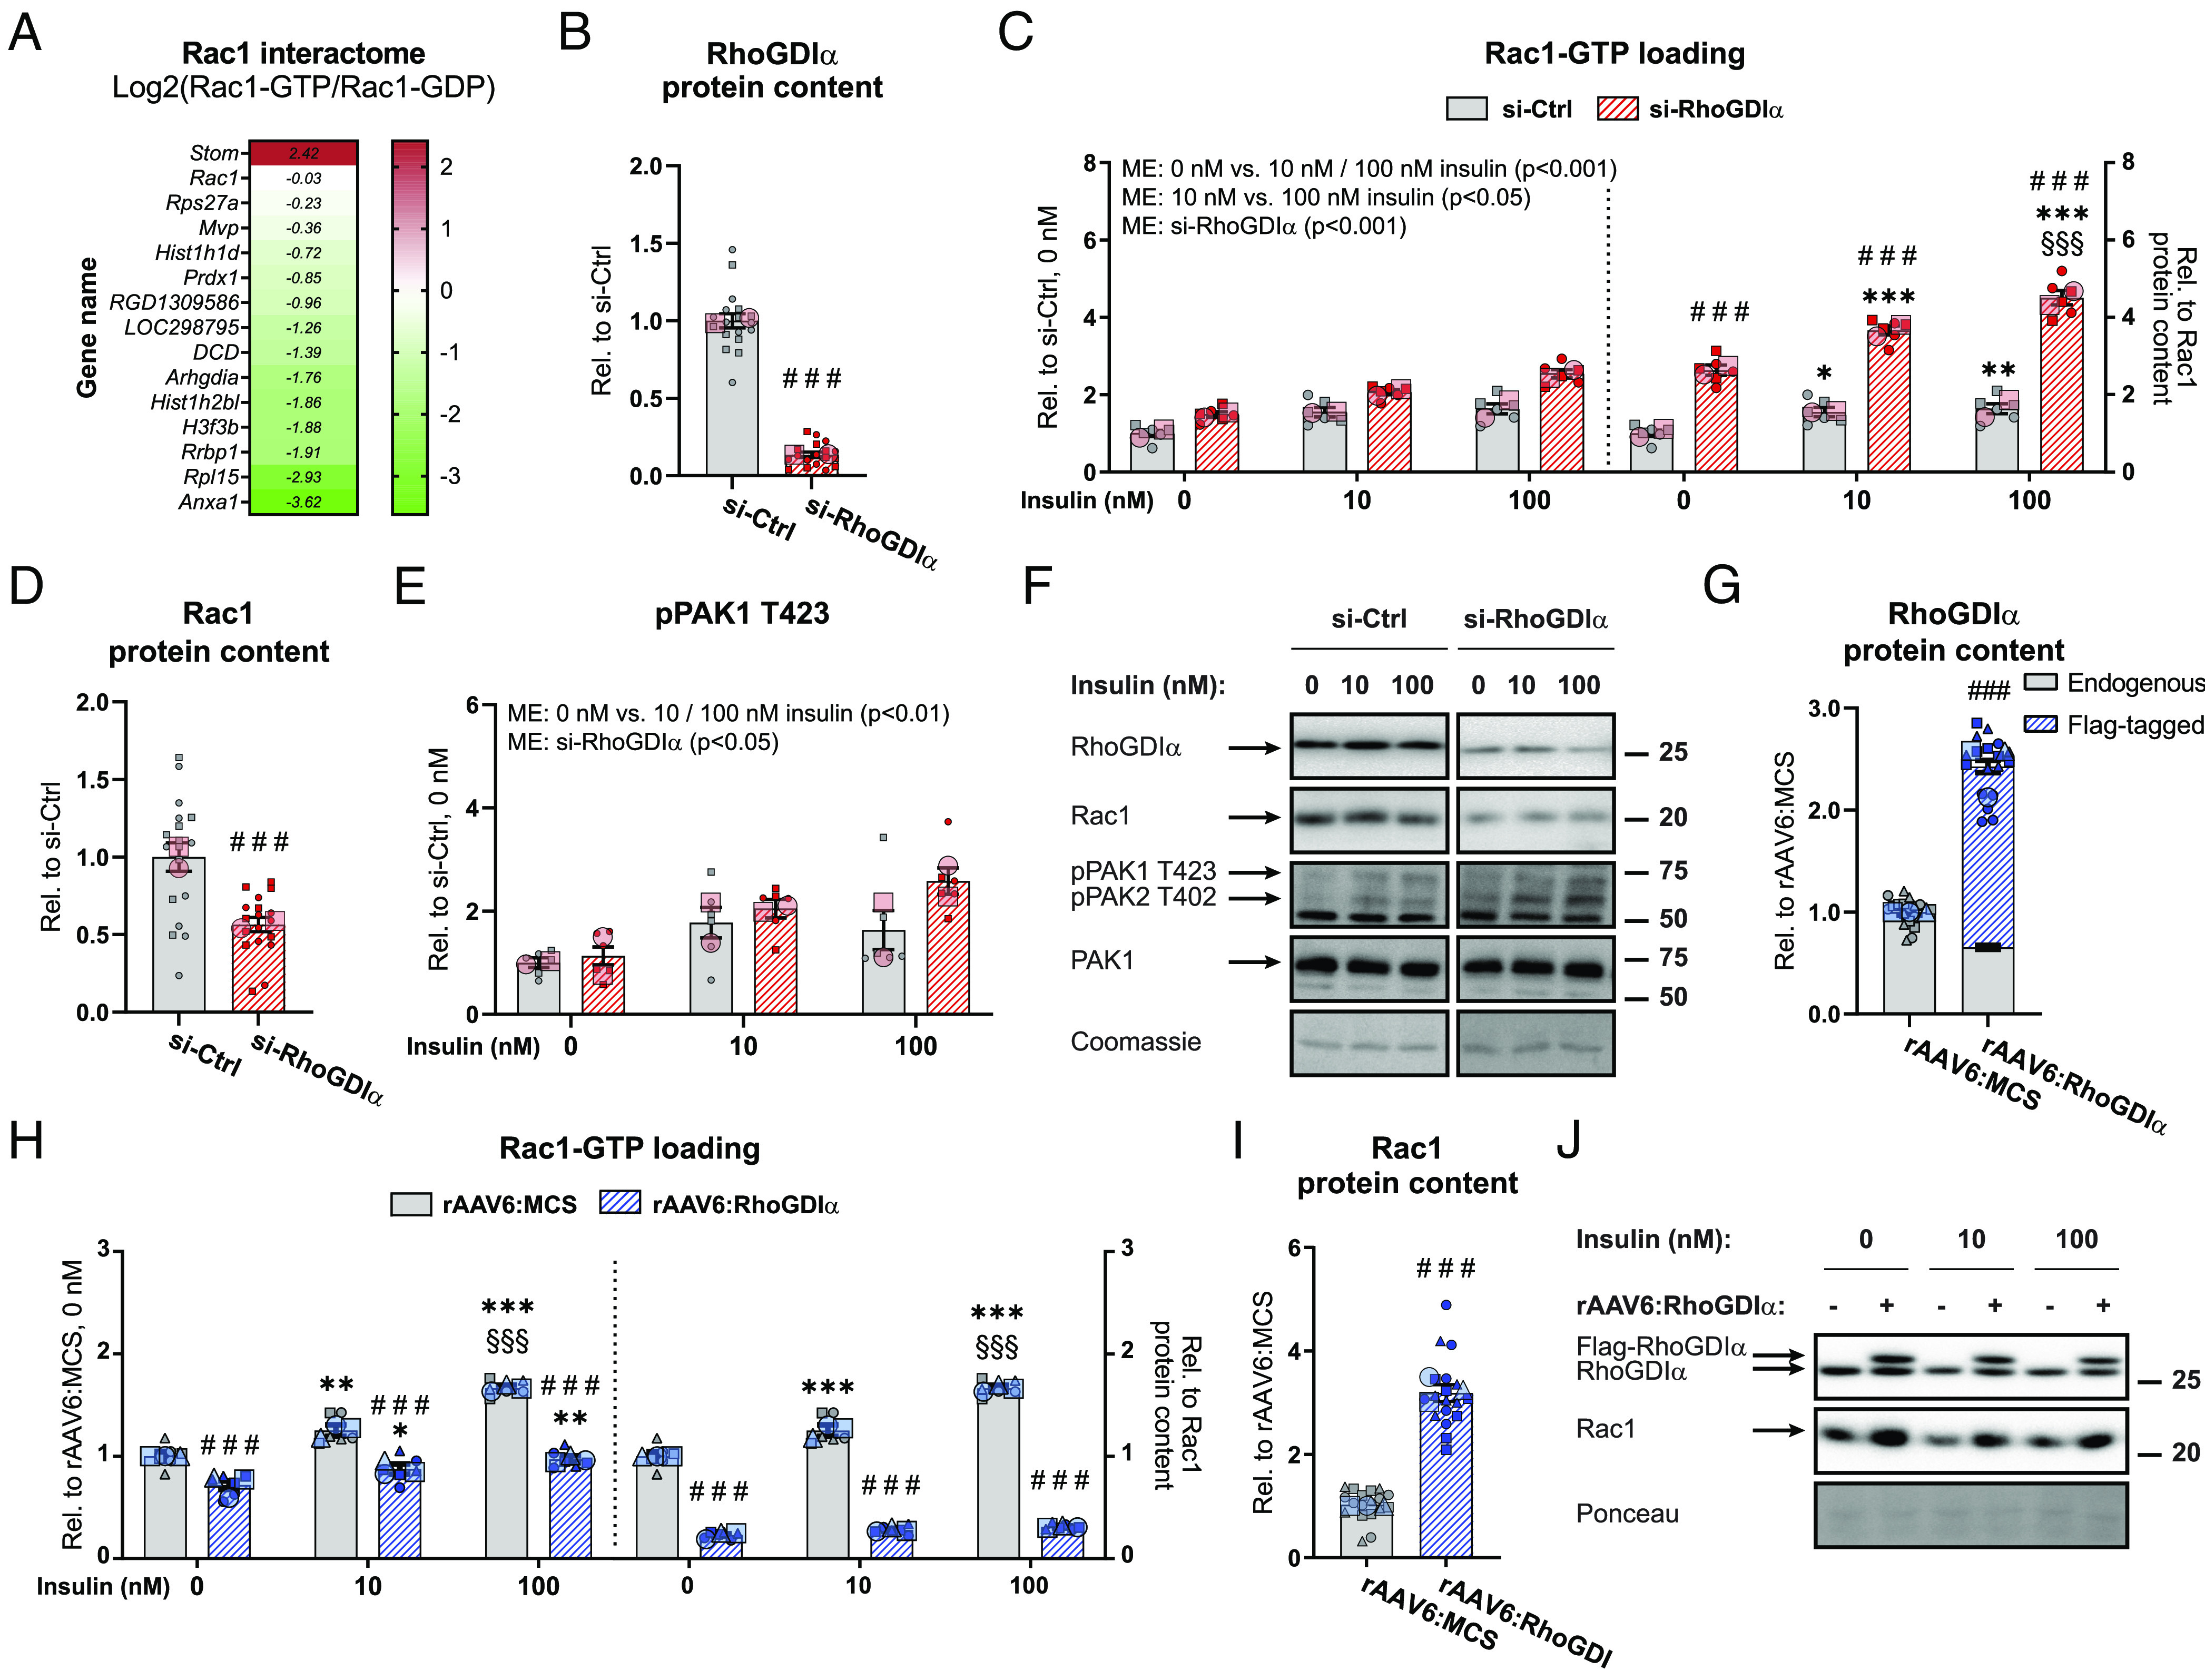
RhoGDIα inhibits Rac1 activity in GLUT4myc L6 myotubes. (A) Heat map showing the Rac1 interactome of proteins differentially bound to active GTP-bound Rac1 (Rac1-GTP/GFP) compared to inactive Rac1 (Rac1-GDP/GFP). (B) RhoGDIα protein content in GLUT4myc L6 myotubes transfected with RhoGDIα siRNA (si-RhoGDIα) or control siRNA (si-Ctrl). (C) Basal and insulin-stimulated Rac1 activity (Rac1-GTP loading) in GLUT4myc L6 myotubes transfected with si-RhoGDIα or si-Ctrl. Right Inset: Rac1 activity relative to total Rac1 protein content. The cells were incubated 10 nM or 100 nM insulin for 10 min. (D) Rac1 protein content and (E) phosphorylated (p)PAK1 T423 in GLUT4myc L6 myotubes transfected with si-RhoGDIα or si-Ctrl. (F) Representative blots showing (B–E), (SI Appendix, Fig. S2B) and control coomassie staining. (G) RhoGDIα protein content in GLUT4myc L6 myotubes with recombinant adeno-associated viral vector-mediated overexpression of wildtype RhoGDIα (rAAV6:RhoGDIα). Control cells were transfected with an empty vector (rAAV6:MCS). (H) Basal and insulin-stimulated Rac1 activity in GLUT4myc L6 myotubes transfected with rAAV6:RhoGDIα or as a control rAAV6:MCS. Right Inset: Rac1 activity relative to total Rac1 protein content. The cells were incubated 10 nM or 100 nM insulin for 10 min. (I) Rac1 protein content in GLUT4myc L6 myotubes transfected with rAAV6:RhoGDIα or as a control rAAV6:MCS. (J) Representative blots showing (G), (I), and control ponceau staining. As indicated by the SuperPlots (35), the siRNA experiment was assayed in triplicates and repeated twice and the AAV experiment was assayed in duplicates and repeated three times. Total protein content was evaluated with a Student’s t test. Rac1 activity and protein phosphorylation were evaluated with a two-way ANOVA. Main effects are indicated in the panels. Significant interactions in two-way ANOVAs and significant Student’s t tests: effect of si-RhoGDIα/rAAV6:RhoGDIα ### (P < 0.001); effect of insulin (0 nM vs. 10 nM/100 nM insulin) */**/*** (P < 0.05/0.01/0.001); and effect of insulin dose (10 nM vs. 100 nM insulin) §§§ (P < 0.001). Data are presented as mean SEM with individual data points shown and the average from each experimental round.
Silver staining confirmed the interaction between preferably inactive Rac1 and RhoGDIα in skeletal muscle cells (SI Appendix, Fig. S1H). In agreement with RhoGDIα binding preferentially to inactive (cytosolic) Rac1, subcellular fractionations showed that RhoGDIα was almost exclusively found in the cytosol in rat hind limb muscles [SI Appendix, Fig. S1I, verifications of the different fractions have previously been published (36)], consistent with findings in nonmuscle cells in vitro (37). Hence, the interaction between RhoGDIα and preferentially inactive GDP-bound Rac1 suggested a regulatory role of RhoGDIα on Rac1 activity in skeletal muscle.
RhoGDIα Inhibits Rac1 Activity in GLUT4myc L6 Myotubes.
Having established that RhoGDIα binds inactive Rac1, we next sought to determine whether RhoGDIα mechanistically regulated Rac1 activity. Rac1 activity was measured after siRNA-mediated RhoGDIα depletion (−86%) in GLUT4myc L6 myotubes (Fig. 1B). RhoGDIα depletion increased both basal (+49%) and insulin-stimulated (10 nM: +33%; 100 nM: +55%) Rac1 activity (Fig. 1 C, Left). Emphasizing the efficiency of RhoGDIα depletion, Rac1 activity relative to intramyocellular content of Rac1 was even more elevated at both baseline (+163%) and insulin-stimulated (10 nM: +136%; 100 nM: +175%; Fig. 1 C, Right) states because RhoGDIα depletion caused a 43% reduction in total Rac1 protein content compared to control cells (Fig. 1D). Those data identify RhoGDIα as a potent inhibitor of Rac1.
Group I PAKs bind active GTP-bound Rac1 (38). Active Rac1-binding to PAK1 and PAK2 elicits a conformational change in the kinases allowing for autophosphorylation of T423 and T402, respectively. This phosphorylation (p) relieves PAK1/2 autoinhibition (39) and pPAK1 T423 could therefore serve as an indirect readout of Rac1 activity as used previously (17, 18, 40). This contention was supported since basal and insulin-stimulated pPAK1 T423 correlated with Rac1-GTP binding (SI Appendix, Fig. S2A) and importantly, insulin-stimulated pPAK1 T423 is abrogated in muscle in Rac1 knockout mice (17). Consistent with the elevated Rac1 activity, RhoGDIα depletion up-regulated basal (+13%) and insulin-stimulated (10 nM: +15%; 100 nM: +58%) pPAK1 T423 compared to control cells (Fig. 1 E and F). PAK1 protein content was unaffected by RhoGDIα depletion (SI Appendix, Fig. S2B).
We next generated a rAAV6 constructed with tropism toward muscle to overexpress RhoGDIα in myotubes (+143%; Fig. 1G), hypothesizing that this would lead to inhibition of Rac1. RhoGDIα overexpression decreased both basal (−28%) and insulin-stimulated (10 nM: −30%; 100 nM: −42%) Rac1 activity (Fig. 1 H, Left). When related to the intramyocellular content of Rac1 protein, the Rac1 activity was even more reduced at both baseline (−59%) and insulin-stimulated (10 nM: −61%; 100 nM: −67%; Fig. 1 H, Right) states because RhoGDIα overexpression caused a 212% upregulation of Rac1 protein content compared to rAAV6:MCS control cells transfected with an empty viral vector (Fig. 1 I and J). These data show that RhoGDIα is a potent negative regulator of Rac1 activity in skeletal muscle cells.
Insulin Phosphorylates RhoGDIα S101 to Dissociate from and Activate Rac1 in Skeletal Muscle Cells.
The molecular events that mediate insulin-induced Rac1 activation could be via insulin-dependent Rac1-RhoGDIα dissociation. To test if insulin resulted in the dissociation of Rac1 from RhoGDIα, we immunopurified RhoGDIα and blotted for Rac1 with or without insulin treatment. We detected a reduction in the Rac1 content associated with RhoGDIα in insulin-stimulated compared to nonstimulated L6 myoblasts (Fig. 2 A, left “decreased interaction”). In β-cells, phosphorylation of RhoGDIα at S101 is a suggested mechanism for dissociation of the Rac1–RhoGDIα complex (32). Indeed, in response to insulin, we found that phosphorylation of RhoGDIα at S101 increased by 40% (Fig. 2 A, right “increased phosphorylation”, Fig. 2B), showing that insulin elicited phosphorylation of RhoGDIα at this site. To determine the importance of the S101 site in mediating insulin-stimulated Rac1 activation, we introduced a nonphosphorylatable RhoGDIα S101A mutant (rAAV6:RhoGDIα S101A) into GLUT4myc L6 myotubes. rAAV6:RhoGDIα S101A overexpression (+171%; Fig. 2C), repressed both basal (−39%) and insulin-stimulated (10 nM: −41%; 100 nM: −45%) Rac1 activity (Fig. 2 D, Left). Interestingly, the drop in Rac1 activity by RhoGDIα S101A (Fig. 2 D, Right) occurred despite an upregulation of Rac1 protein content (+252%) compared to control cells (Fig. 2 E and F). Next, to better maintain Rac1 and RhoGDIα protein contents, we depleted RhoGDIα using siRNA followed by rAAV-mediated reintroduction of either WT RhoGDIα or RhoGDI S101A (Fig. 2 G–I). RhoGDIα S101A tended to lower basal (−29%) and insulin-stimulated (100 nM: −40%) Rac1 activity (Fig. 2 H, Left). Despite the slight upregulation of RhoGDIα S101A, no association was detected between RhoGDIα protein content and Rac1-GTP loading in response to insulin stimulation (SI Appendix, Fig. S2C). Rac1 activity was even more reduced at both baseline (−42%) and insulin-stimulated (100 nM: −51%; Fig. 2 H, Right) when related to intramyocellular content of Rac1 protein (Fig. 2 I and SI Appendix, Fig. S2D). These findings indicate that the inability to phosphorylate RhoGDIα at S101 in response to insulin prevents insulin-induced Rac1 activation. Together, these results suggest a mechanism whereby RhoGDIα in response to insulin is phosphorylated at S101 and dissociates from Rac1, whereby Rac1 is activated in skeletal muscle cells.
Fig. 2.
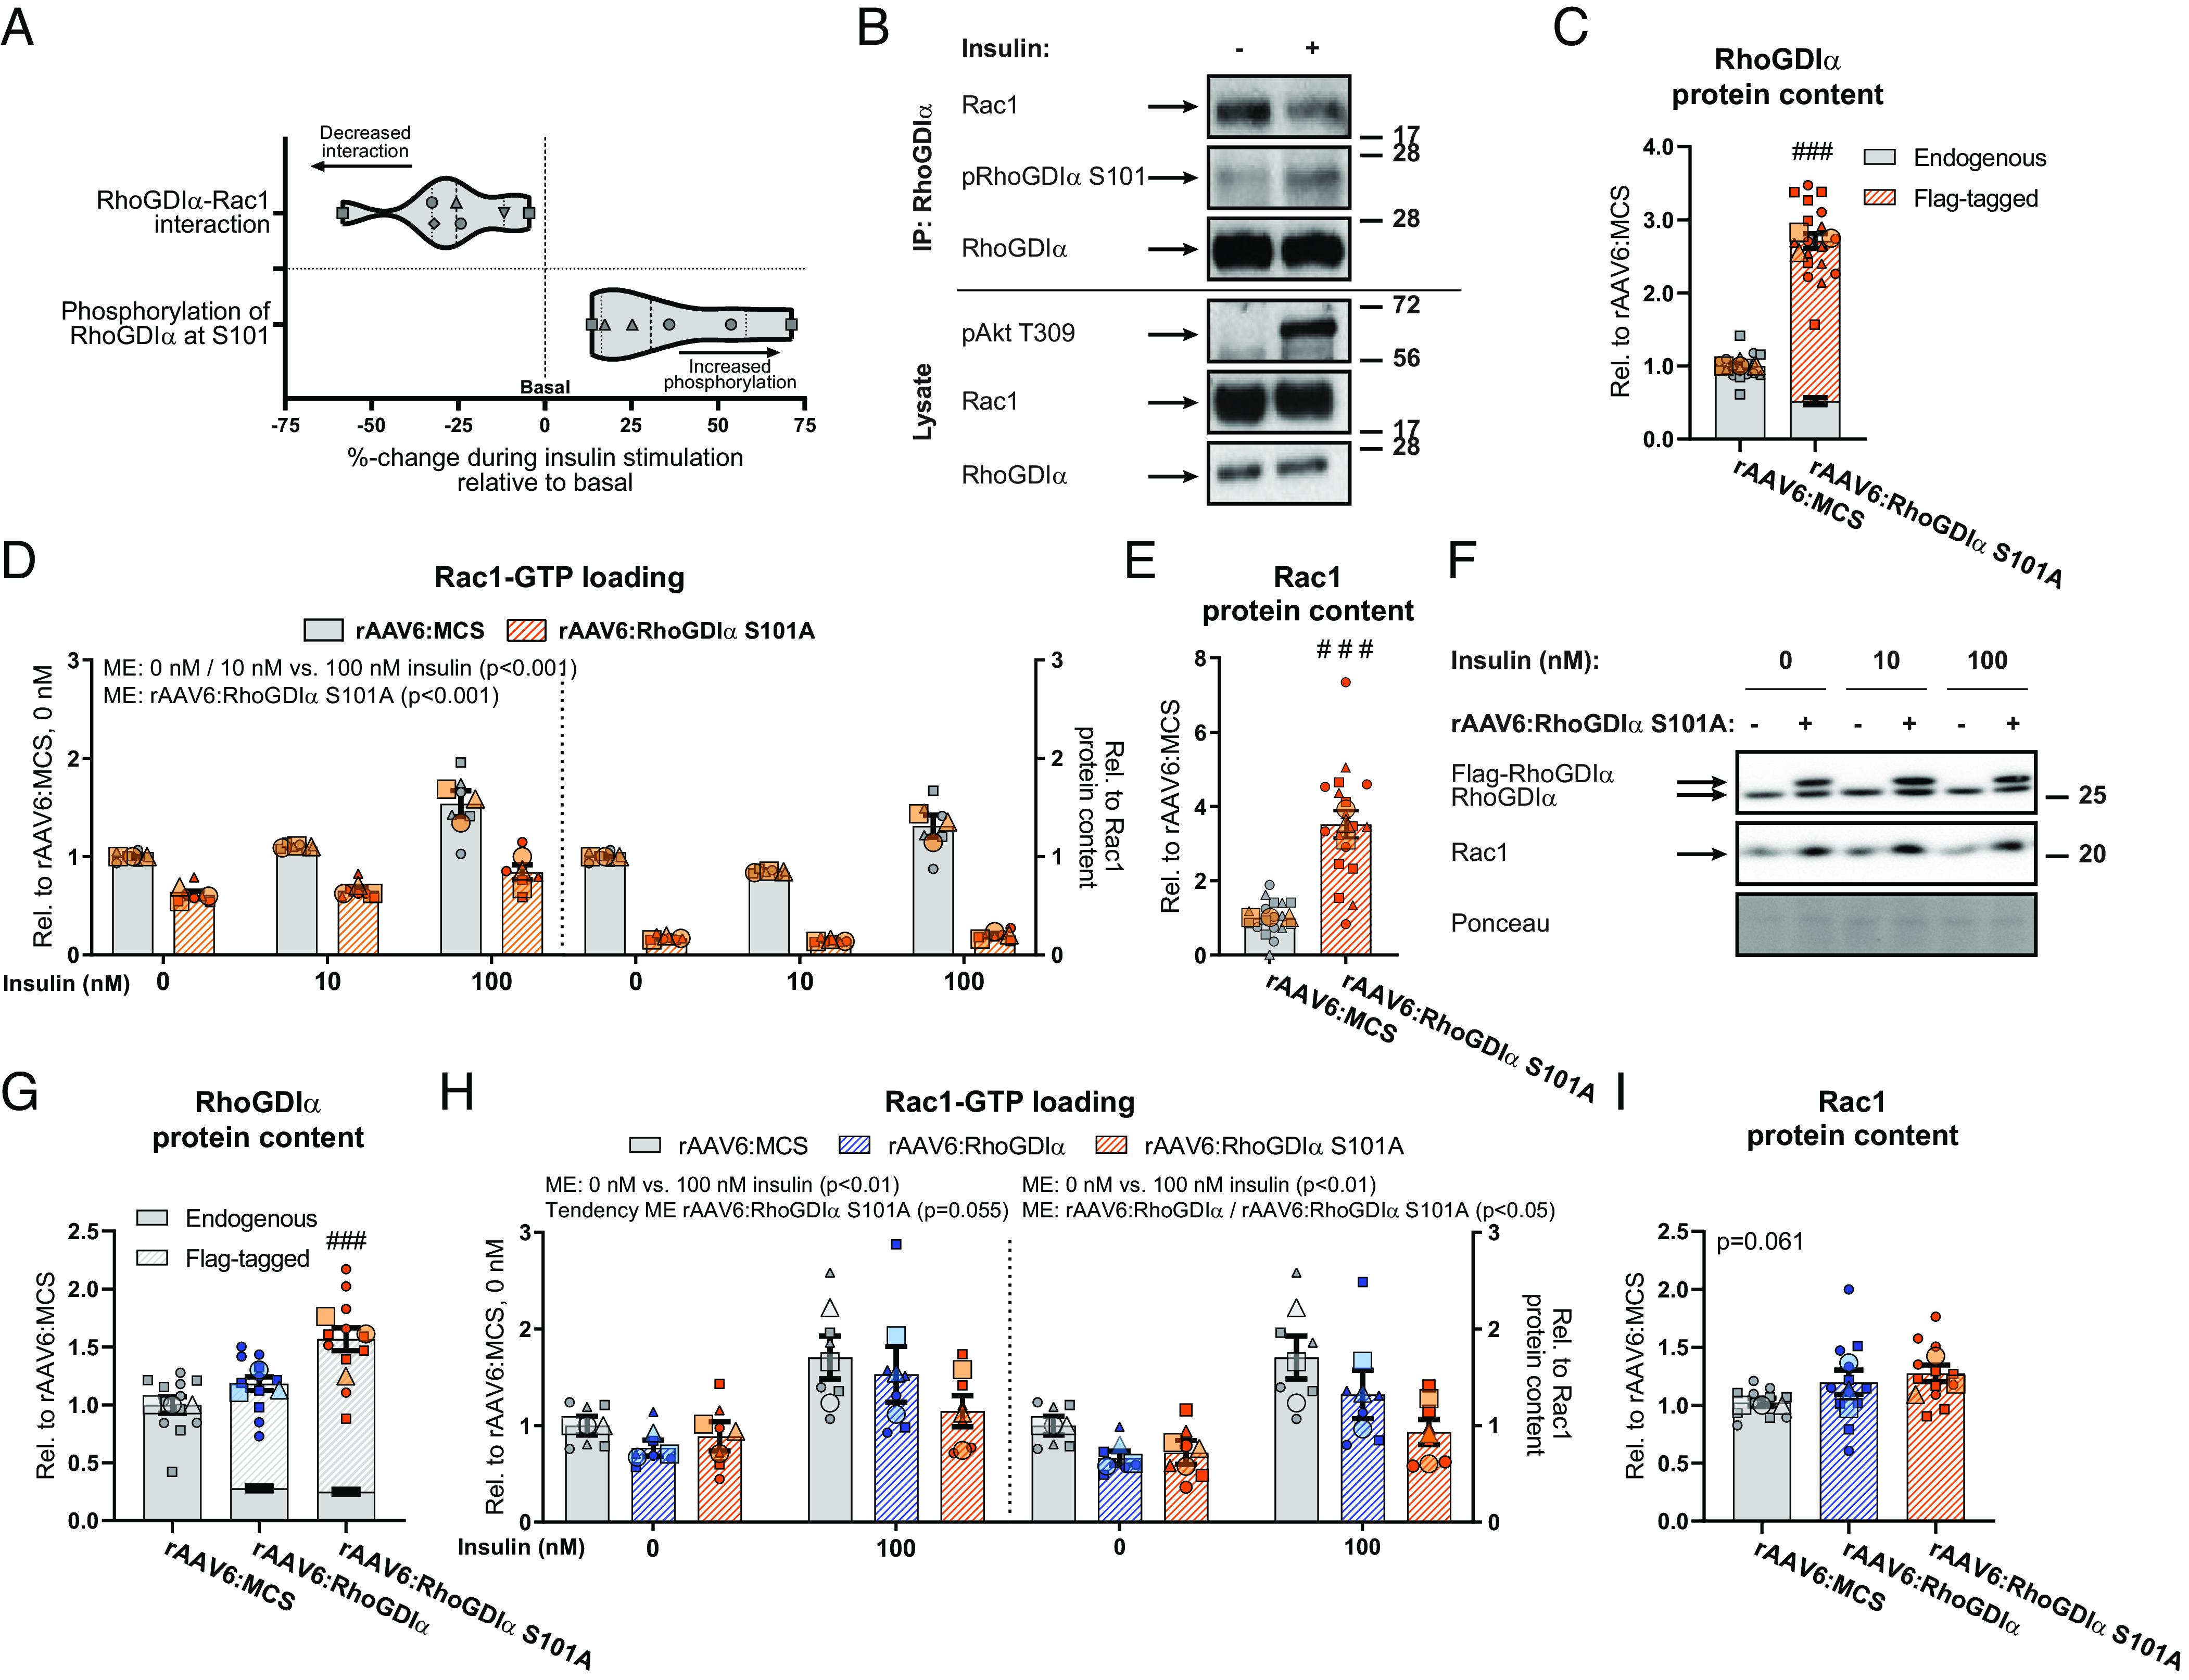
Insulin phosphorylates RhoGDIα S101 to dissociate from and activate Rac1 in skeletal muscle cells. (A) Violin plot showing immunopurification of RhoGDIα followed by immunoblotting for Rac1 (Left; RhoGDIα–Rac1 interaction) or pRhoGDIα S101 (Right) 100 nM insulin for 10 min in GLUT4myc L6 myoblasts. (B) Representative blots for (A). (C) RhoGDIα protein content in GLUT4myc L6 myotubes with recombinant adeno-associated viral vector-mediated overexpression of a RhoGDIα S101A mutant (rAAV6:RhoGDIα S101A). Control cells were transfected with an empty vector (rAAV6:MCS). (D) Basal- and insulin-stimulated Rac1 activity in GLUT4myc L6 myotubes transfected with rAAV6:RhoGDIα S101A or control rAAV6:MCS. Right Inset: Rac1 activity relative to total Rac1 protein content. The cells were incubated 10 nM or 100 nM insulin for 10 min. (E) Rac1 protein content in GLUT4myc L6 myotubes transfected with rAAV6:RhoGDIα S101A or control rAAV6:MCS. (F) Representative blots showing (C), (E), and control ponceau staining. (G) RhoGDIα protein content in GLUT4myc L6 myotubes transfected with rAAV6:RhoGDIα or rAAV6:RhoGDIα S101A after siRNA-mediated knockdown of endogenous RhoGDIα. Control cells were transfected with rAAV6:MCS and control siRNA. (H) Basal- and insulin-stimulated Rac1 activity in GLUT4myc L6 myotubes transfected with rAAV6:RhoGDIα, rAAV6:RhoGDIα S101A, or control rAAV6:MCS after siRNA-mediated knockdown of endogenous RhoGDIα or si-Ctrl. Right Inset: Rac1 activity relative to total Rac1 protein content. The cells were incubated 100 nM insulin for 10 min. (I) Rac1 protein content in GLUT4myc L6 myotubes transfected with rAAV6:RhoGDIα, rAAV6:RhoGDIα S101A, or control rAAV6:MCS. As indicated by the SuperPlots (35), the experiments were assayed in duplicates and repeated three times. Total protein content was evaluated with a Student’s t test or one-way ANOVA. Rac1 activity was evaluated with a two-way ANOVA. For (H), the effect of rAAV6:RhoGDIα or rAAV6:RhoGDIα S101A was tested separately. Main effects are indicated in the panels. Significant interactions in two-way ANOVAs and significant Student’s t tests and one-way ANOVAs: Effect of rAAV6:RhoGDIα/rAAV6:RhoGDIα S101A ### (P < 0.001). Data are presented as mean SEM with individual data points shown and the average from each experimental round.
RhoGDIα Is a Negative Regulator of GLUT4myc Translocation to the Plasma Membrane.
Having established that RhoGDIα inhibits both basal and insulin-stimulated Rac1 activity in skeletal muscle cells, and knowing the prominent role of Rac1 in insulin-stimulated GLUT4 translocation and glucose uptake (14–18, 41–43), we tested whether RhoGDIα regulates GLUT4 translocation dynamics. Rac1 activation is sufficient to increase GLUT4 translocation in GLUT4myc L6 myoblasts and mouse skeletal muscle (16, 42) and we, therefore, hypothesized that RhoGDIα depletion or overexpression would positively or negatively, respectively, affect muscle GLUT4 translocation. Consistent with increased Rac1 activity, RhoGDIα depletion increased basal (+34%) and insulin-stimulated (100 nM: +18%) GLUT4 translocation compared to control cells (Fig. 3A). Expectedly, phosphorylation of Akt at S474 was unaffected by RhoGDIα depletion (Fig. 3B), despite a 70% increased Akt2 protein content compared to control cells (Fig. 3 C and D). Next, we overexpressed RhoGDIα using rAAV to inhibit Rac1 and hypothesized that GLUT4 translocation would diminish. In agreement, RhoGDIα overexpression resulted in a reduction in basal (−19%) and insulin-stimulated (−11%) GLUT4 translocation (Fig. 3E). Importantly, pAkt S474 (Fig. 3 F and G) was unaffected by RhoGDIα overexpression. Finally, because RhoGDIα was phosphorylated by insulin at S101 and this site was important for insulin-stimulated Rac1 activation, we determined GLUT4 translocation in cells expressing a nonfunctional mutation at this site. In line with the inability to optimally activate Rac1, insulin-stimulated (10 nM: −9%; 100 nM: −19%) GLUT4 translocation was diminished by RhoGDIα S101A overexpression (Fig. 3H), endorsing its participation in the pathway of insulin-stimulated GLUT4 translocation.
Fig. 3.
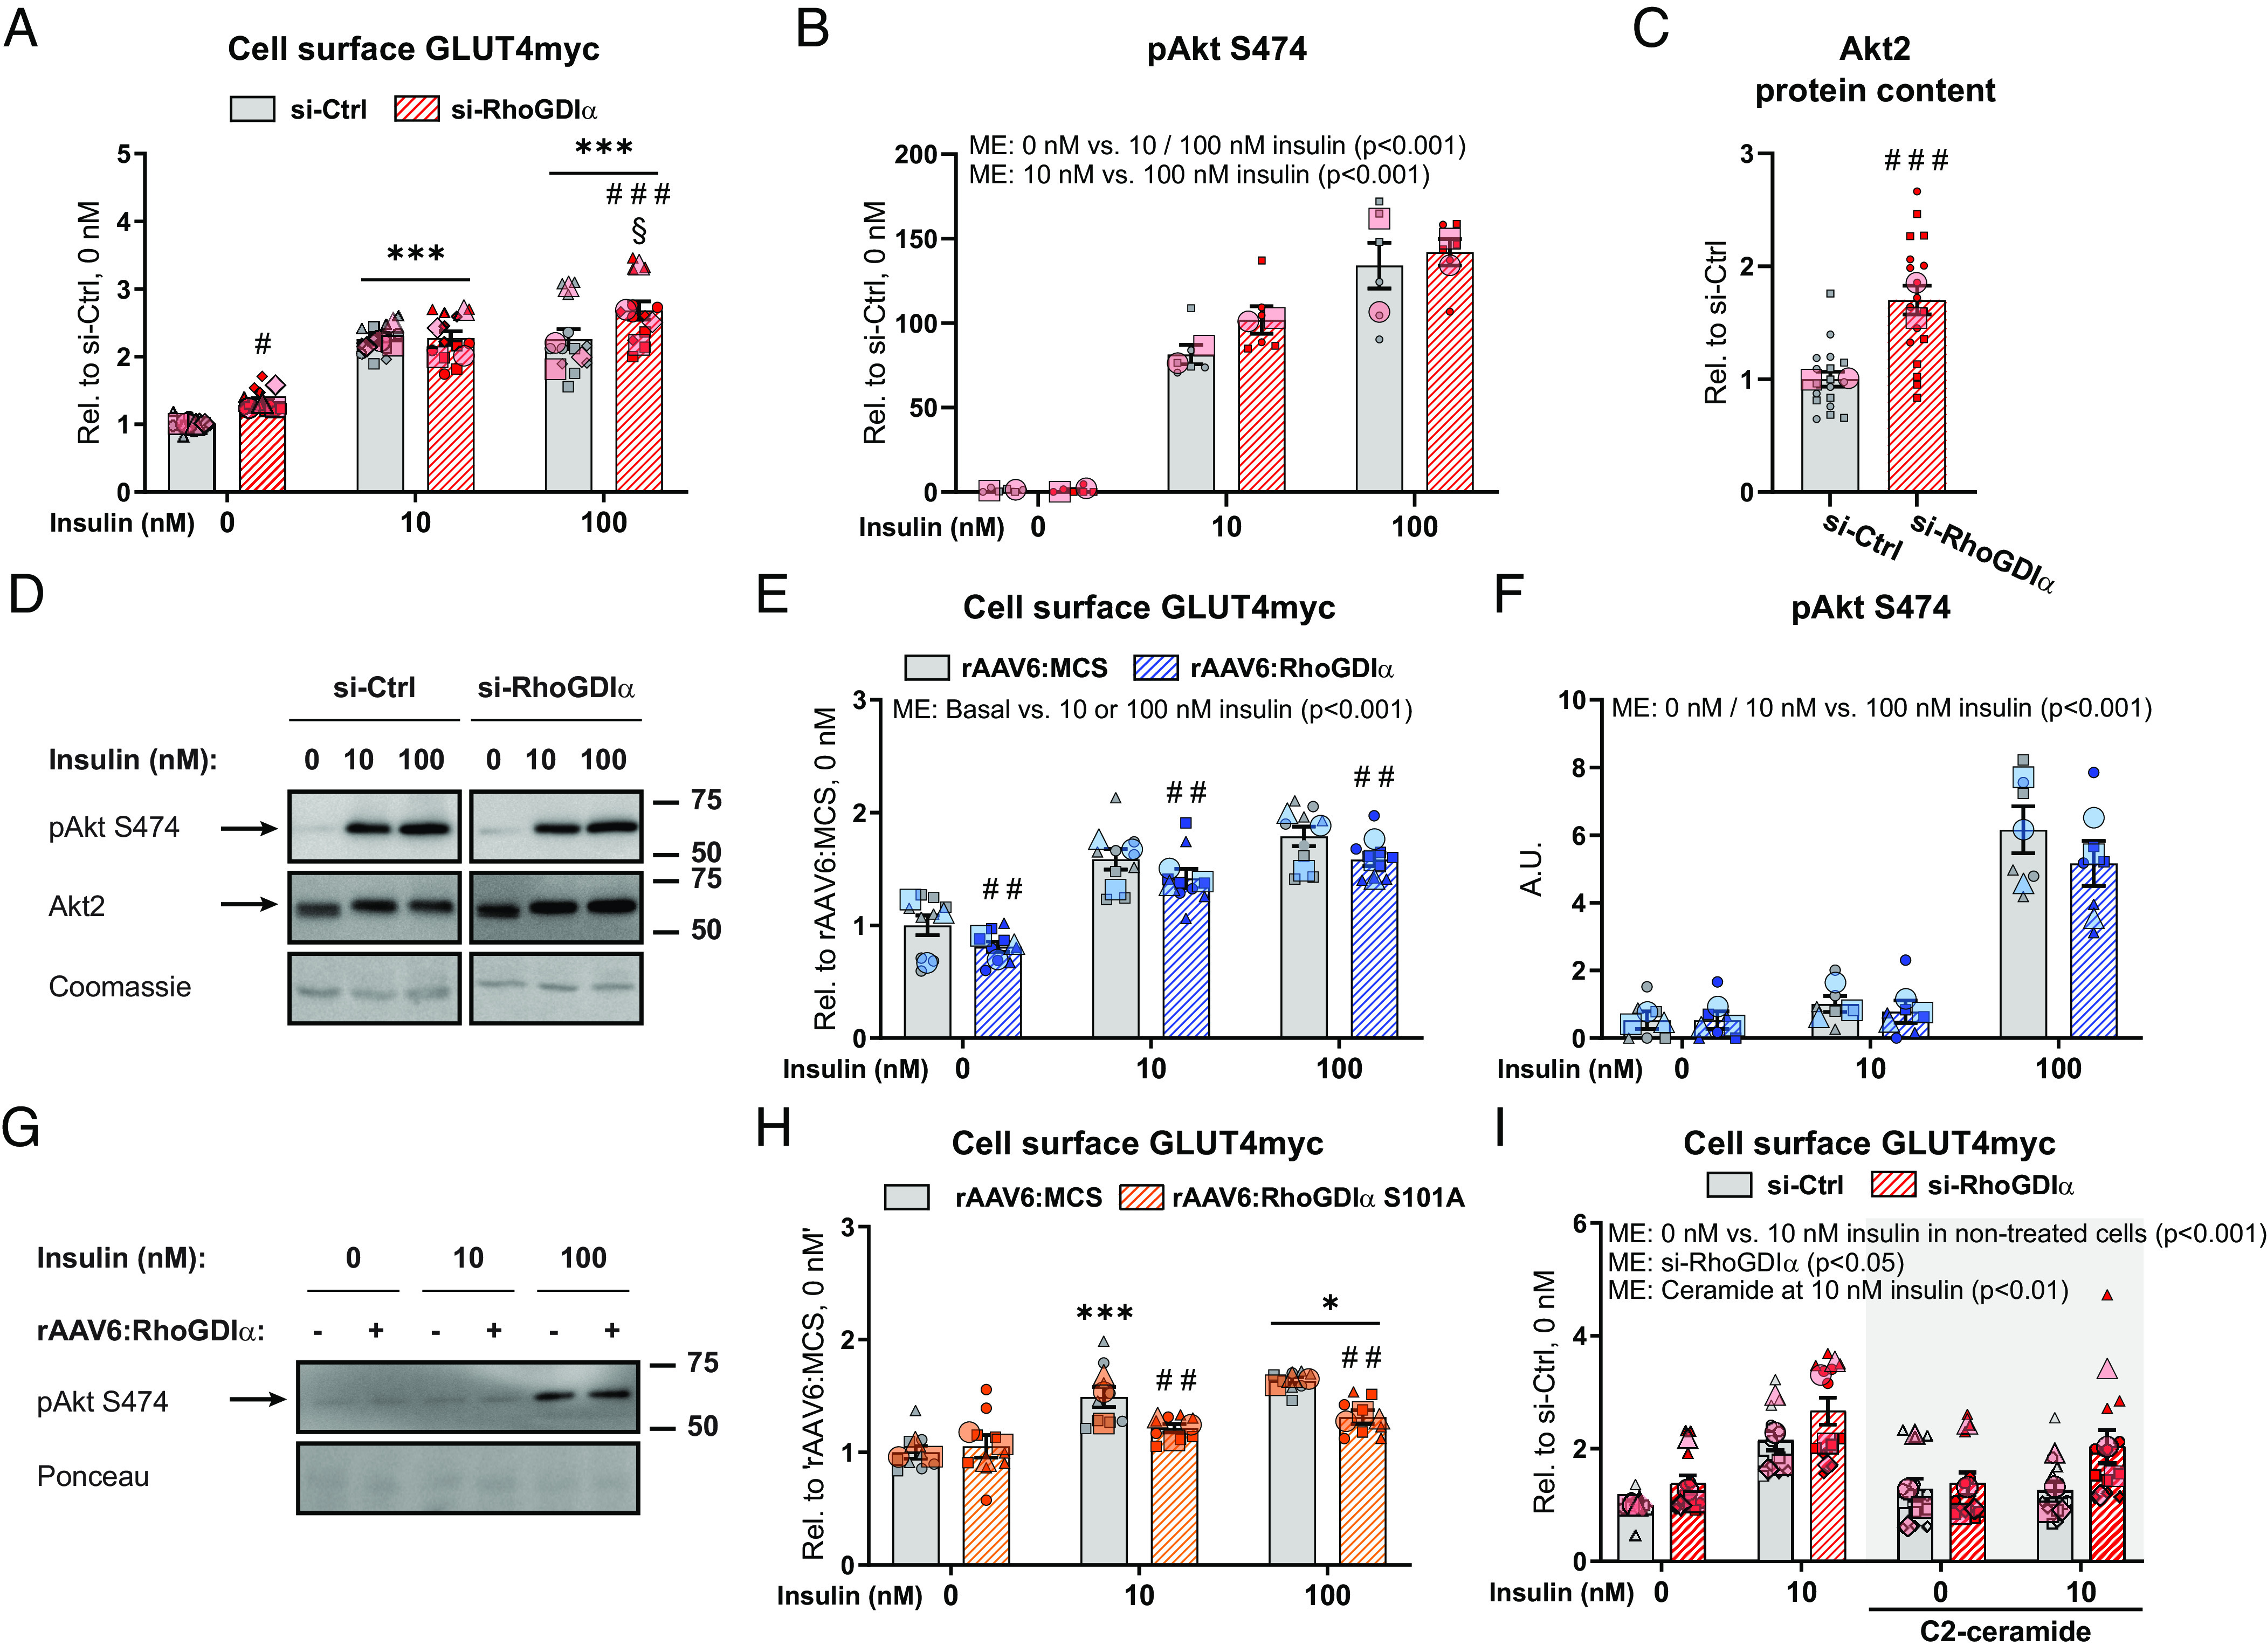
RhoGDIα is a negative regulator of GLUT4 translocation to the plasma membrane. (A) Basal and insulin-stimulated GLUT4 translocation (cell surface GLUT4myc) in GLUT4myc L6 myotubes transfected with RhoGDIα siRNA (si-RhoGDIα) or control siRNA (si-Ctrl). The cells were incubated 10 nM or 100 nM insulin for 15 min. (B) Phosphorylated (p)Akt S474 and (C) Akt2 protein content in GLUT4myc L6 myotubes transfected with si-RhoGDIα or si-Ctrl. (D) Representative blots showing (B), (C), and control coomassie staining. (E) Basal and insulin-stimulated GLUT4 translocation in GLUT4myc L6 myotubes with recombinant adeno-associated viral vector-mediated overexpression of wildtype RhoGDIα (rAAV6:RhoGDIα) or control empty vector (rAAV6:MCS). The cells were incubated 10 nM or 100 nM insulin for 15 min. (F) pAkt S474 in GLUT4myc L6 myotubes transfected with si-RhoGDIα or si-Ctrl. (G) Representative blots showing (F) and control ponceau staining. (H) Basal and insulin-stimulated GLUT4 translocation in GLUT4myc L6 myotubes transfected with rAAV vector-mediated overexpression of a RhoGDIα S101A mutant (rAAV6:RhoGDIα S101A). Control cells were transfected with rAAV6:MCS. The cells were incubated 10 nM or 100 nM insulin for 15 min. (I) Basal and submaximal insulin-stimulated (10 nM) GLUT4 translocation in GLUT4myc L6 myotubes transfected with si-RhoGDIα or si-Ctrl ± 25 µM C2-ceramide during the last 2 h of serum deprivation and the acute insulin challenge. Data were evaluated with two two-way ANOVAs to test the factors “siRNA” (si-Ctrl vs. si-RhoGDIα) and “insulin concentration” (0 nM vs. 10 nM) in nontreated and C2-ceramide–treated cells, respectively. The effect of C2-ceramide treatment was assessed by two two-way ANOVAs to test the factors “siRNA” and “C2-ceramide” (nontreated cells vs. C2-ceramide–treated cells) at 0 nM and 10 nM insulin, respectively. As indicated by the SuperPlots (35), the experiments were assayed in duplicate (F) or triplicate (A–C, E, H, I) and repeated twice (B and C), three (E, F, and H), or four times (A and I). Total protein content was evaluated with a Student’s t test. Unless otherwise stated previously in the figure legend, GLUT4 translocation and protein phosphorylation were evaluated with a two-way ANOVA. Main effects are indicated in the panels. Significant interactions in two-way ANOVAs and significant Student’s t tests: Effect of si-RhoGDIα/rAAV6:RhoGDIα/rAAV6:RhoGDIα S101A #/##/### (P < 0.05/0.01/0.001). Effect of insulin (0 nM vs. 10 nM/100 nM insulin) */*** (P < 0.05/0.001). Effect of insulin dose (10 nM vs. 100 nM insulin) § (P < 0.05). Data are presented as mean SEM with individual data points shown and the average from each experimental round. A.U., arbitrary units.
Because Rac1 is less active during states of insulin resistance (15, 17), our findings prompted us to explore whether activating Rac1, via a reduction in RhoGDIα protein content, would restore insulin sensitivity as a clinically relevant end-point. Insulin resistance was induced by 25 µM C2-ceramide [a known agent reducing insulin action in muscle cells (44)], and the short-chain ceramide attenuates Rac1 activation more than Akt in L6 myotubes (15). C2-ceramide treatment abrogated GLUT4 translocation in control cells in response to a submaximal insulin dose (Fig. 3I). Intriguingly, C2-ceramide–induced insulin resistance was attenuated with RhoGDIα depletion (Fig. 3I), suggesting that transient RhoGDIα downregulation or inhibition has the potential to prevent muscle insulin resistance. This scenario is concordant with the observation above that silencing RhoGDIα potentiates insulin action via activation of Rac1.
A distal Rac1-regulated event necessary for GLUT4 translocation in myotubes in response to insulin is the reorganization of the actin cytoskeleton, known as membrane ruffling (14, 15, 45–48). As the final step in GLUT4 translocation, we, therefore, estimated RhoGDIα’s involvement in actin-cytoskeleton dynamics in response to insulin. RhoGDIα knockdown altered actin membrane ruffling in response to insulin showing as more elongated ruffle areas in contrast to the more concentrated areas in the control cells, although we were unable to quantify the cytoskeletal reorganization (SI Appendix, Fig. S3). This is in agreement with Rac1’s known role in insulin-induced membrane ruffle formation (14, 15, 45–48). Taken together, our data identify RhoGDIα as a negative regulator of GLUT4 translocation in GLUT4myc L6 myotubes, suggesting a mechanism whereby RhoGDIα in response to insulin dissociates from Rac1, whereby Rac1 is activated leading to altered actin cytoskeleton remodeling and thereby increased GLUT4 translocation.
RhoGDIα Suppresses Insulin-Stimulated Glucose Uptake in Mouse Skeletal Muscle In Vivo.
To cement the relevance of RhoGDIα in mature mouse skeletal muscle in vivo, we administered rAAV6:RhoGDIα into the gastrocnemius (also targeting the soleus), tibialis anterior (alto targeting the EDL), and triceps brachii muscles of one side while the contralateral muscles were injected with an empty viral vector, rAAV6:MCS (Fig. 4A). The overexpression of RhoGDIα was specific to the injected muscle groups (Fig. 4B), appeared in all fibers (Fig. 4C), and did not result in visible fiber degeneration at either 2 or 4 wk after rAAV6-administration (SI Appendix, Fig. S4A). Glycemia and maximal insulin-stimulated glucose uptake were measured in mice 4 wk after the administration of rAAV6. Ten minutes following insulin administration, blood glucose was lowered by 1.6 0.5 mM (−17%; SI Appendix, Fig. S4B), while blood glucose was stable in saline-treated mice. RhoGDIα overexpression attenuated insulin-stimulated glucose uptake in gastrocnemius (−24%) and EDL (−45%), but not in soleus or triceps brachii (Fig. 4D). Higher [3H]-2DG availability per se could result in an increased uptake of [3H]-2DG, so importantly, due to the paired design (one rAAV6:RhoGDIα-treated leg and one rAAV6:MCS-treated leg), circulating [3H]-2DG availability was the same for both legs and the availability only differed between saline- and insulin-administered mice (SI Appendix, Fig. S4C). The effect of RhoGDIα overexpression on insulin-stimulated glucose uptake persisted in muscles from mice fed a high-fat diet (HFD, 60E%) for 8 wk (−36% in gastrocnemius and −54% in EDL, Fig. 4E). Interestingly, in the context of 60E% HFD, RhoGDIα overexpression also induced marked insulin resistance in triceps brachii (−39%; Fig. 4E), which was not seen in chow-fed mice (Fig. 4D). Similar to what we found in L6 myotubes, RhoGDIα overexpression increased Rac1 protein content (+136%; Fig. 4 F and G). RhoGDIα likely also regulates other Rho GTPases in muscle, and indeed, RhoA protein content was markedly up-regulated by rAAV6:RhoGDIα (+146%; SI Appendix, Fig. S4D). In contrast to protein content, mRNA levels of RAC1 and RHOA (Fig. 4H and SI Appendix, Fig. S4E) were unaffected by rAAV6:RhoGDIα-treatment. This is in line with data from nonmuscle cells showing that Rac1 ubiquitination occurs exclusively when Rac1 is activated (49), indicating that RhoGDIα stabilizes the Rho GTPases proteins by preventing their degradation rather than stimulating transcription. Verifying that the RhoGDIα overexpression was specific to the injected muscle groups, no Flag-tagged RhoGDIα was detected in cardiac tissue, perigonadal white adipose tissue, liver, or the brain (SI Appendix, Fig. S4F). These findings establish RhoGDIα as a negative regulator of insulin-stimulated glucose uptake in mature mouse skeletal muscle in vivo.
Fig. 4.
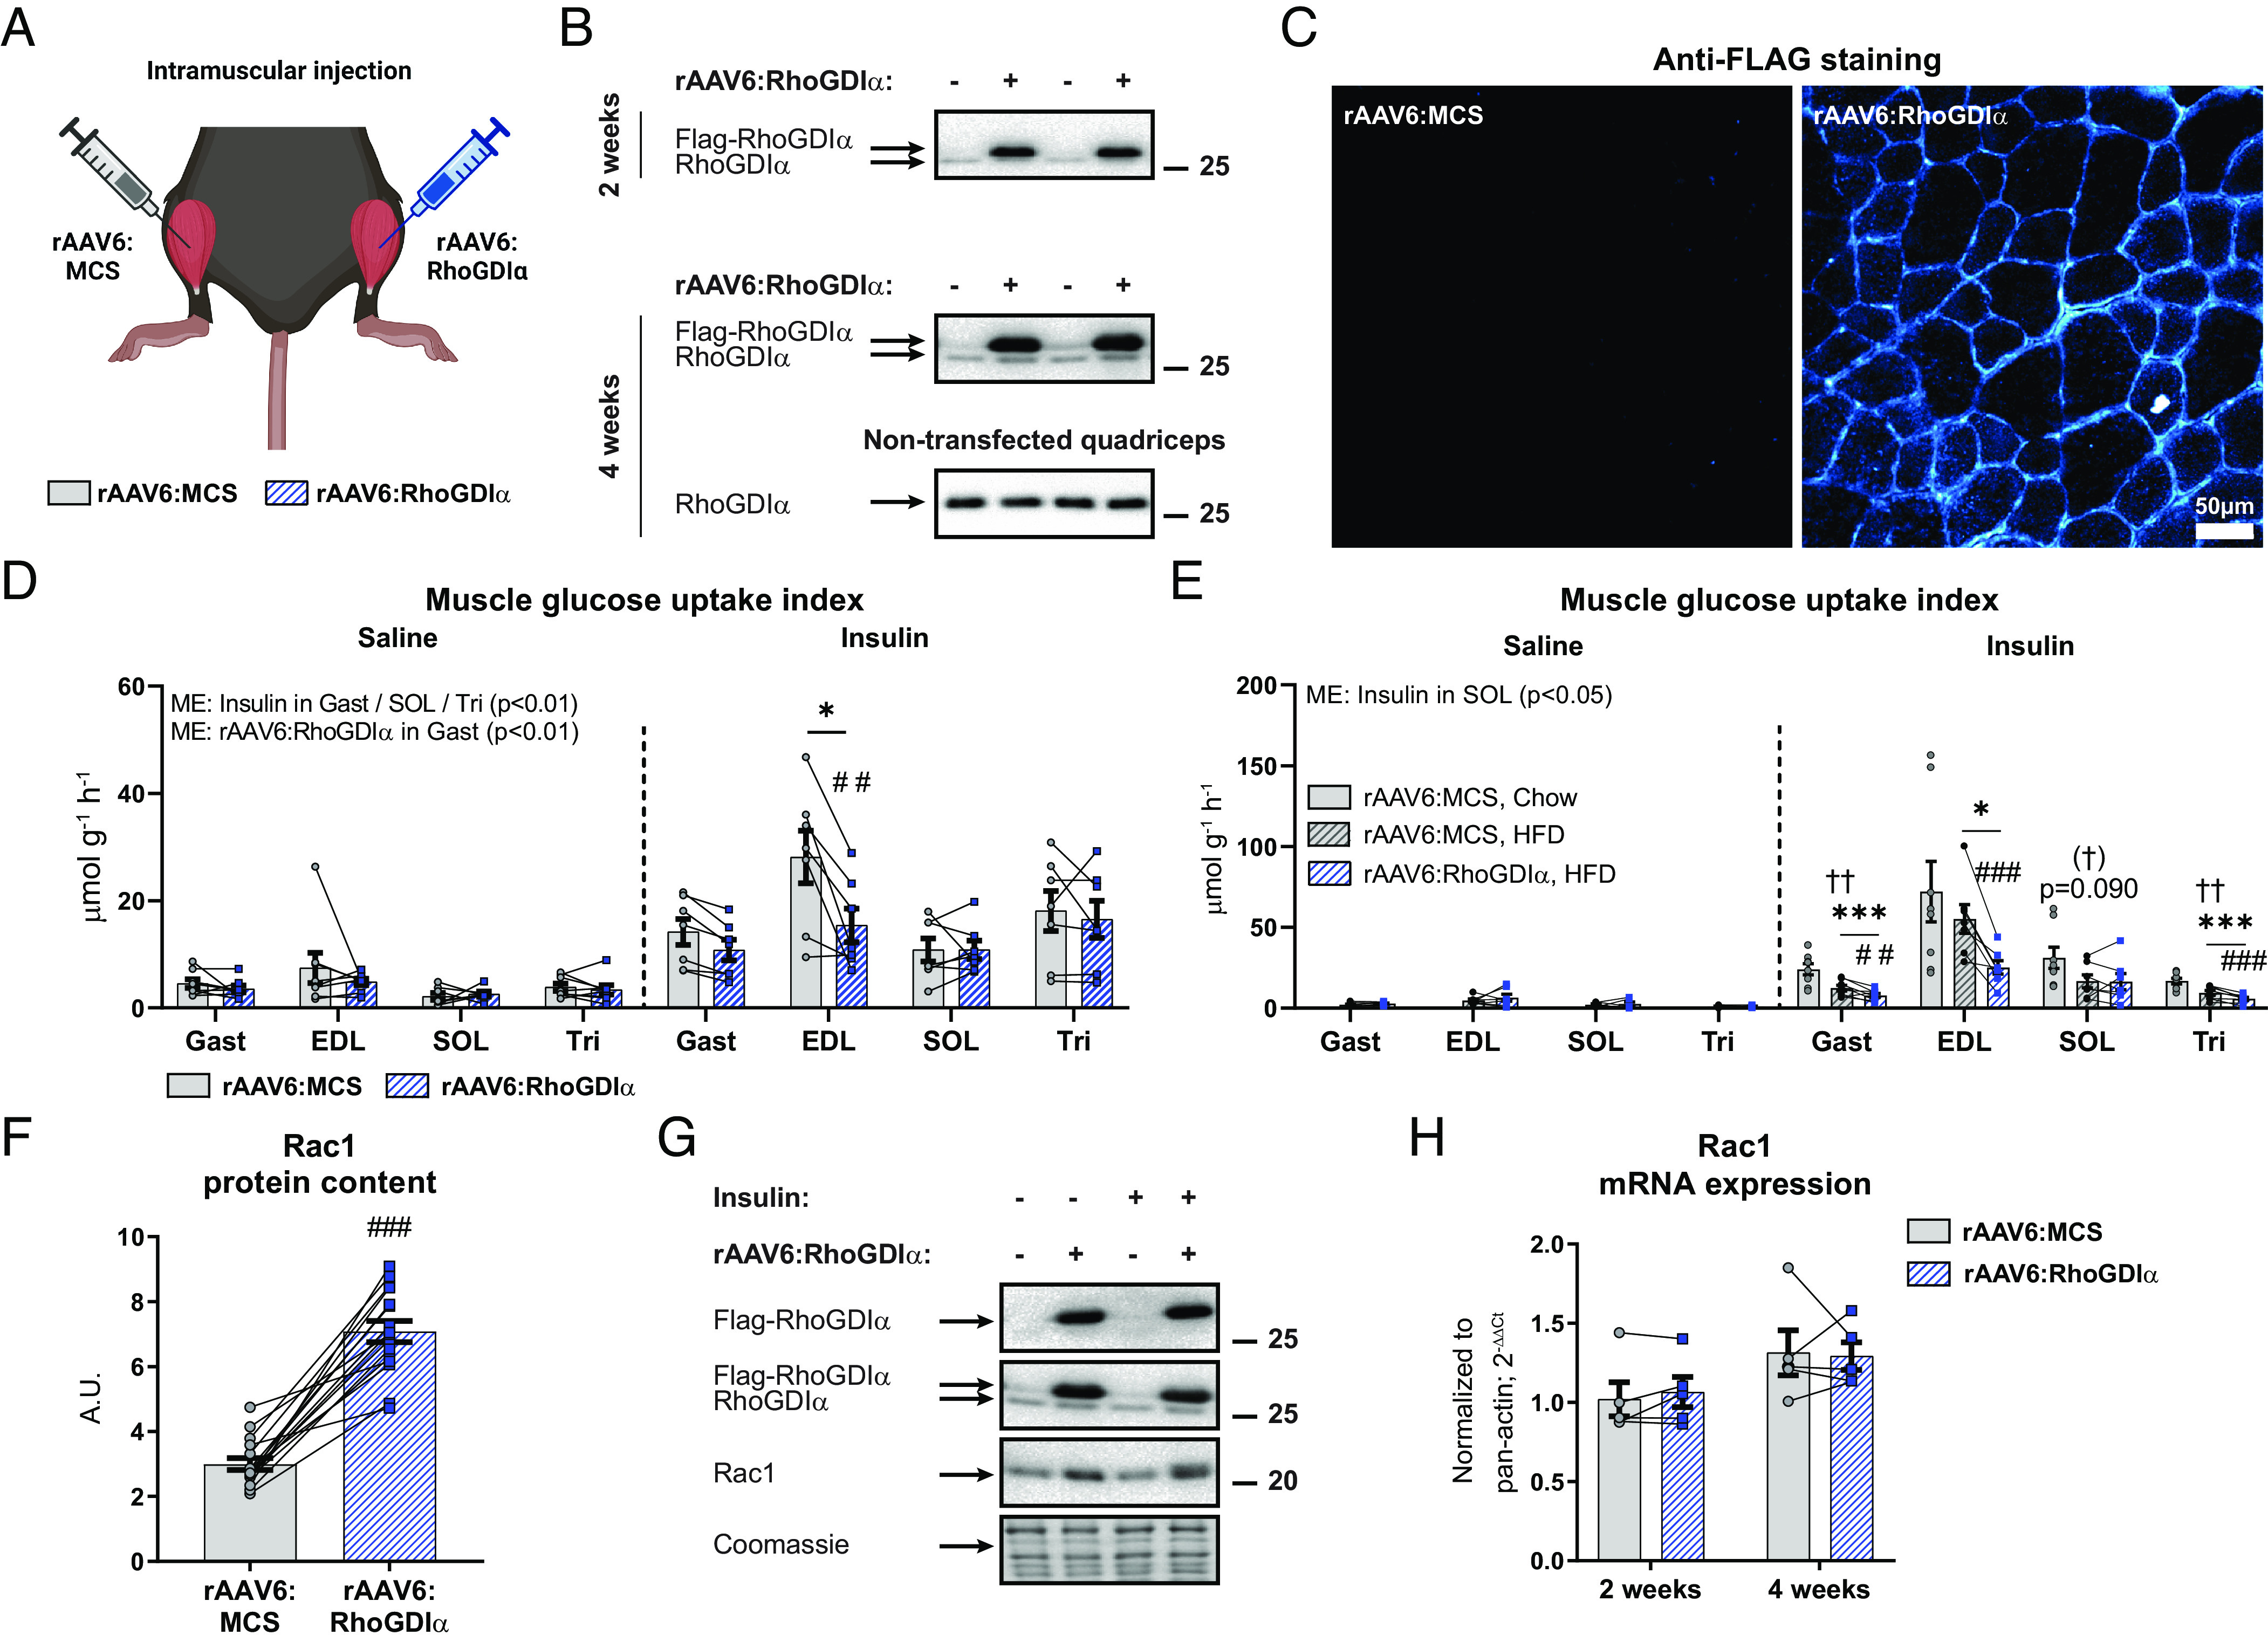
RhoGDIα suppresses insulin-stimulated glucose uptake in mouse skeletal muscle in vivo. (A) Schematic of the experimental design. A recombinant adeno-associated viral vector encoding RhoGDIα (rAAV6:RhoGDIα) was administered intramuscularly in gastrocnemius (also targeting the soleus), tibialis anterior (also targeting the EDL), and triceps brachii muscles, while the contralateral muscles were injected with an empty viral vector (rAAV6:MCS). (B) Representative blot of Flag-tagged and endogenous RhoGDIα in gastrocnemius or nontransfected control quadriceps muscle 2 or 4 wk after administration. (C) Representative image of Flag (RhoGDIα) staining of cross-sections from rAAV6:RhoGDIα- or rAAV6:MCS-treated tibialis anterior muscle. (D) Insulin-stimulated (0.5 U kg−1 body weight) glucose uptake index in rAAV6:RhoGDIα- or rAAV6:MCS-treated gastrocnemius (Gast), EDL, soleus (SOL) and triceps brachii (Tri) muscles from chow-fed young adult mice 4 wk after rAAV6-administration. Saline, n =8/7/8/8 (Gast/EDL/SOL/Tri); Insulin, n =7/7/7/7. Data were evaluated with a two-way RM ANOVA for each of the muscles. (E) Insulin-stimulated (0.4 U kg−1 body weight) glucose uptake index in Gast, EDL, SOL, and Tri muscles from 8 wk 60E% HFD-fed young adult mice 4 wk after rAAV6-administration. Saline, n = 8/7/6/8 (Gast/EDL/SOL/Tri); Insulin, n = 8/7/7/8. Data were evaluated with a two-way RM ANOVA for each of the muscles. The effect of diet was evaluated with a Student's t test comparing rAAV6:MCS-treated muscle in chow- and 60E% HFD-fed mice. (F) Rac1 protein content in rAAV6:RhoGDIα- or rAAV6:MCS-treated gastrocnemius muscle. Data were evaluated with a paired t test. (G) Representative blots showing RhoGDIα, (G), and control coomassie staining. (H) Rac1 mRNA expression in rAAV6:RhoGDIα- or rAAV6:MCS-treated TA muscle 2 or 4 wk after rAAV6-administration in chow-fed, male mice, n = 4. Data were evaluated with a paired t test. Main effects are indicated in the panels. Significant interactions in two-way RM ANOVAs and significant t tests: Effect of rAAV6:RhoGDIα vs. rAAV6:MCS ##/### (P < 0.01/0.001); Effect of insulin */*** (P < 0.05/0.001); Effect of HFD 60E% (†)/†† (P < 0.1/0.001). Data are presented as mean SEM or when applicable mean SEM with individual data points shown. A.U., arbitrary units.
Canonical Insulin Signaling Proteins and Glucose Handling Proteins Are Not Regulated by RhoGDIα Overexpression.
We next explored possible molecular explanations for the reduced insulin-stimulated glucose uptake and used immunoblotting techniques to analyze intracellular insulin signaling and glucose-handling proteins in gastrocnemius muscle. RhoGDIα overexpression reduced intracellular phosphorylation of PAK1 T423, a proxy for Rac1 activity, in both saline- and insulin-treated muscles (Saline: -31%; Insulin: −24%; Fig. 5A). This occurred despite a trending 30% increase in PAK1 protein content (Fig. 5B) and even with the marked upregulation of Rac1 protein content (Fig. 4F). As expected, since Rac1 signals in parallel (14, 17, 18) or downstream of Akt (50), RhoGDIα overexpression did not affect pAkt S474, pAkt T309, nor total Akt2 protein content (Fig. 5 C–E). Yet, pTBC1D4 T649, a Rab-GAP downstream target of Akt, was mildly but significantly reduced in the basal and insulin-stimulated states (Saline: −14%; Insulin: −8%; Fig. 5F). Total TBC1D4 protein content was not affected (Fig. 5 G and H). The protein content of GLUT4 (SI Appendix, Fig. S4G) and hexokinase II (HKII; a suggested rate-limiting enzyme for in vivo glucose uptake in skeletal muscle (51)] (SI Appendix, Fig. S4H) was unchanged in rAAV6:RhoGDIα-treated muscles compared to control muscles. Because the muscles were insulin resistant, and there is evidence in the literature linking Rho GTPase signaling not only to the actin cytoskeleton but also to markers of mitochondrial content and morphology (52), we next analyzed the complexes of the electron transport chain and, by use of transmission electron microscopy, the mitochondrial volume and morphology. None of the electron transport chain complexes were affected by RhoGDIα overexpression (SI Appendix, Fig. S4 I and J). There were also no changes in intermyofibrillar, subsarcolemmal, total mitochondrial volume, or mitochondrial cristae density (Fig. 5I and SI Appendix, Fig. S4 K–O). Thus, there is no evidence to suggest that the decrease in insulin-stimulated glucose uptake upon RhoGDIα overexpression is due to decreased oxidative capacity in young, adult mice. Overall, we find that insulin resistance in response to RhoGDIα overexpression did not involve canonical insulin signaling but was likely due to RhoGDIα-mediated inhibition of Rho GTPase signaling evidenced by reduced PAK activation.
Fig. 5.
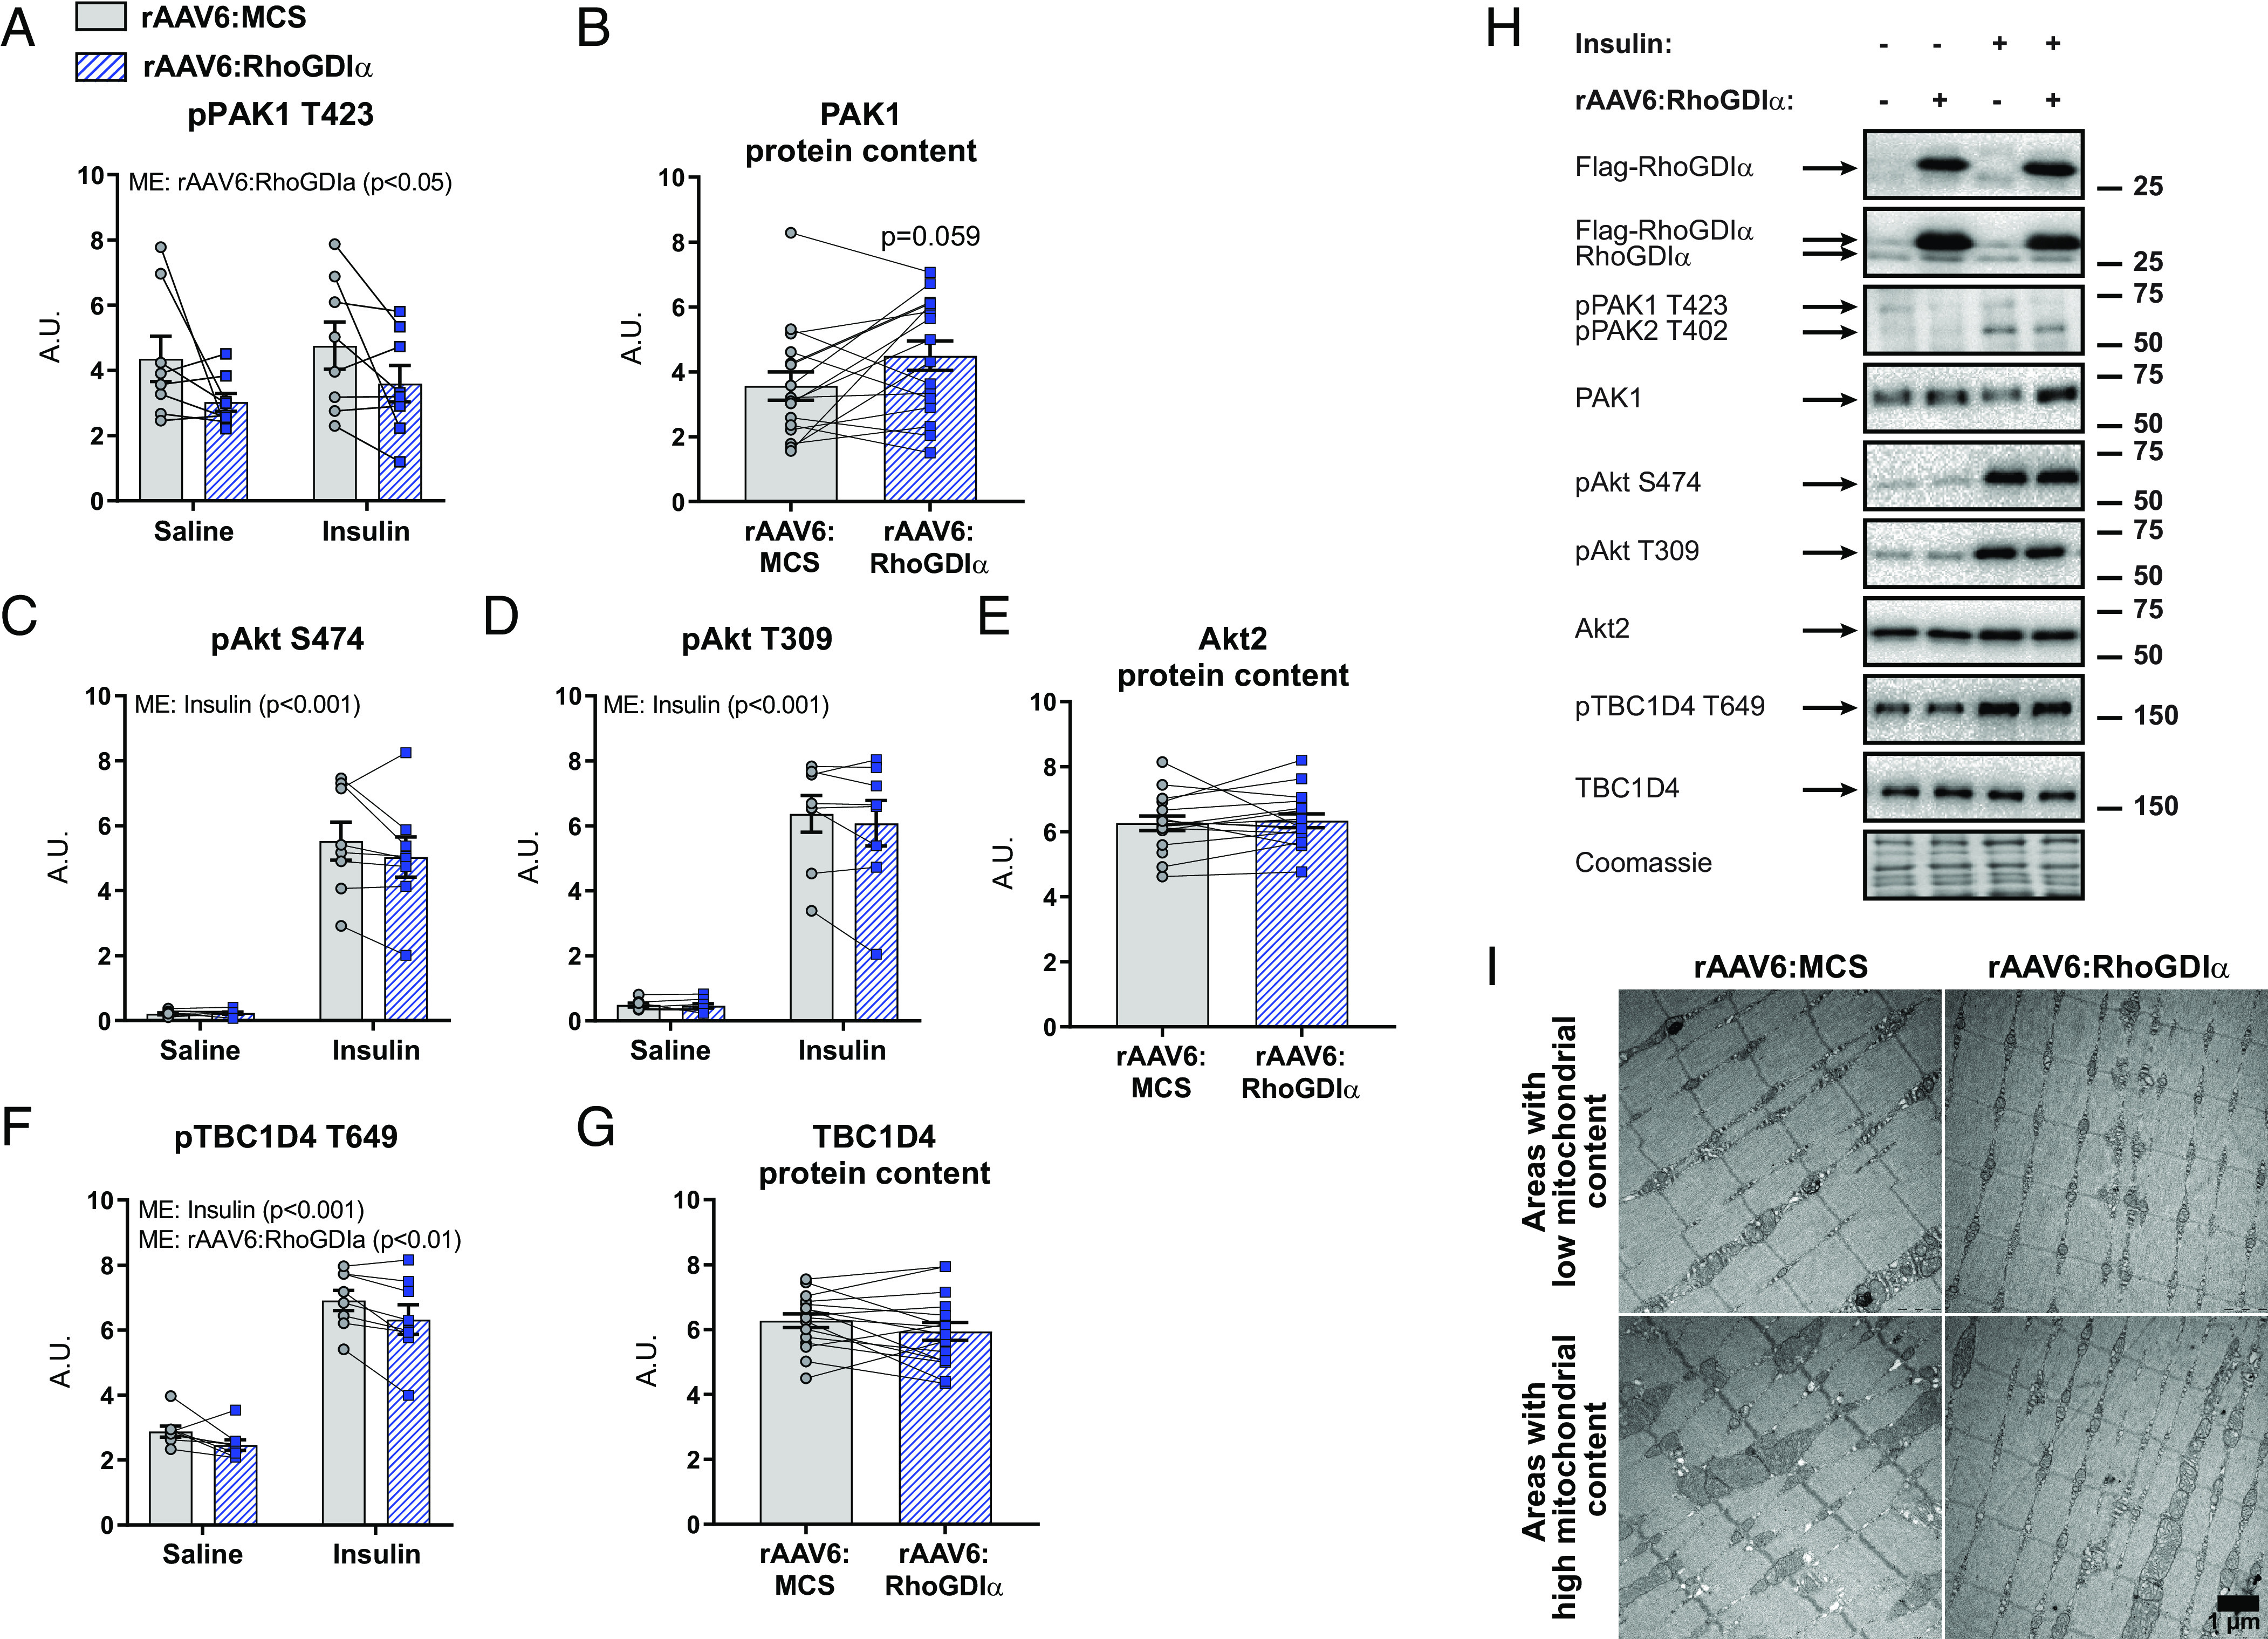
Canonical insulin signaling proteins and glucose-handling proteins are not regulated by RhoGDIα overexpression. (A) Phosphorylated (p)PAK1 T423, (B) total PAK1, (C) pAkt S474, (D) pAkt T309, (E) total Akt2, (F) pTBC1D4 T649, and (G) total TBC1D4 protein content in gastrocnemius from chow-fed mice with recombinant adeno-associated viral vector encoding RhoGDIα (rAAV6:RhoGDIα) administered intramuscularly in muscles of the right leg, while the contralateral muscles were injected with an empty viral vector (rAAV6:MCS). Saline, n = 8; Insulin, n = 7. Total protein content was evaluated with a paired t test. Protein phosphorylation was evaluated with a two-way repeated measures (RM) ANOVA. (H) Representative blots showing (A–G) and control coomassie staining. (I) Representative TEM images showing skeletal muscle mitochondria in TA from rAAV6:RhoGDIα- or rAAV6:MCS-treated muscle of young adult mice. n = 6. Main effects are indicated in the panels. Data are presented as mean SEM with individual data points shown. A.U., arbitrary units.
Chronic RhoGDIα Knockdown Negatively Affects Insulin-Stimulated Glucose Uptake and Intracellular Insulin Signaling in Skeletal Muscle.
As RhoGDIα overexpression decreased insulin-stimulated glucose uptake in muscle, and transient RhoGDIα knock-down in cells elevated GLUT4 translocation in myotubes, we hypothesized that chronic muscle-specific RhoGDIα knockdown would benefit insulin sensitivity. We generated a rAAV6 carrying an expression cassette that encodes for a short-hairpin RNA targeting mouse RhoGDIα (rAAV6:RhoGDIα shRNA) (Fig. 6A). Contralateral muscles were injected with a control vector encoding an shRNA sequence targeting LacZ (rAAV6:LacZ shRNA). Mouse gastrocnemius muscles investigated 8 wk after rAAV6:RhoGDIα shRNA administration demonstrated a 69% reduction in endogenous RhoGDIα protein content (Fig. 6B). In line with our findings that RhoGDIα overexpression increased Rho GTPase protein content in mouse skeletal muscle, RhoGDIα knockdown caused a reduction in the protein content of Rac1 (−36%; Fig. 6C) and RhoA (−26%; SI Appendix, Fig. S5A). Likewise, the Rho GTPase target, PAK1 protein content was 30% decreased (Fig. 6 D and E). Insulin administration lowered blood glucose by 3.7 0.4 mM compared to baseline after 10 min (−43%; SI Appendix, Fig. S5B). Contrary to our hypothesis, chronic RhoGDIα knockdown in mouse muscle in vivo attenuated the insulin-dependent gain in glucose uptake in gastrocnemius (−19%) and EDL (−25%), whereas soleus muscle was unaffected by the reduced RhoGDIα protein content (Fig. 6F). Together with the effect of RhoGDIα overexpression, these data suggest that long-term manipulation of RhoGDIα content in either direction (and thereby Rho GTPase content and activity) in mouse muscle is detrimental to skeletal muscle glucose uptake. These findings reveal an important role for RhoGDIα in maintaining homeostatic glucose metabolism in skeletal muscle.
Fig. 6.
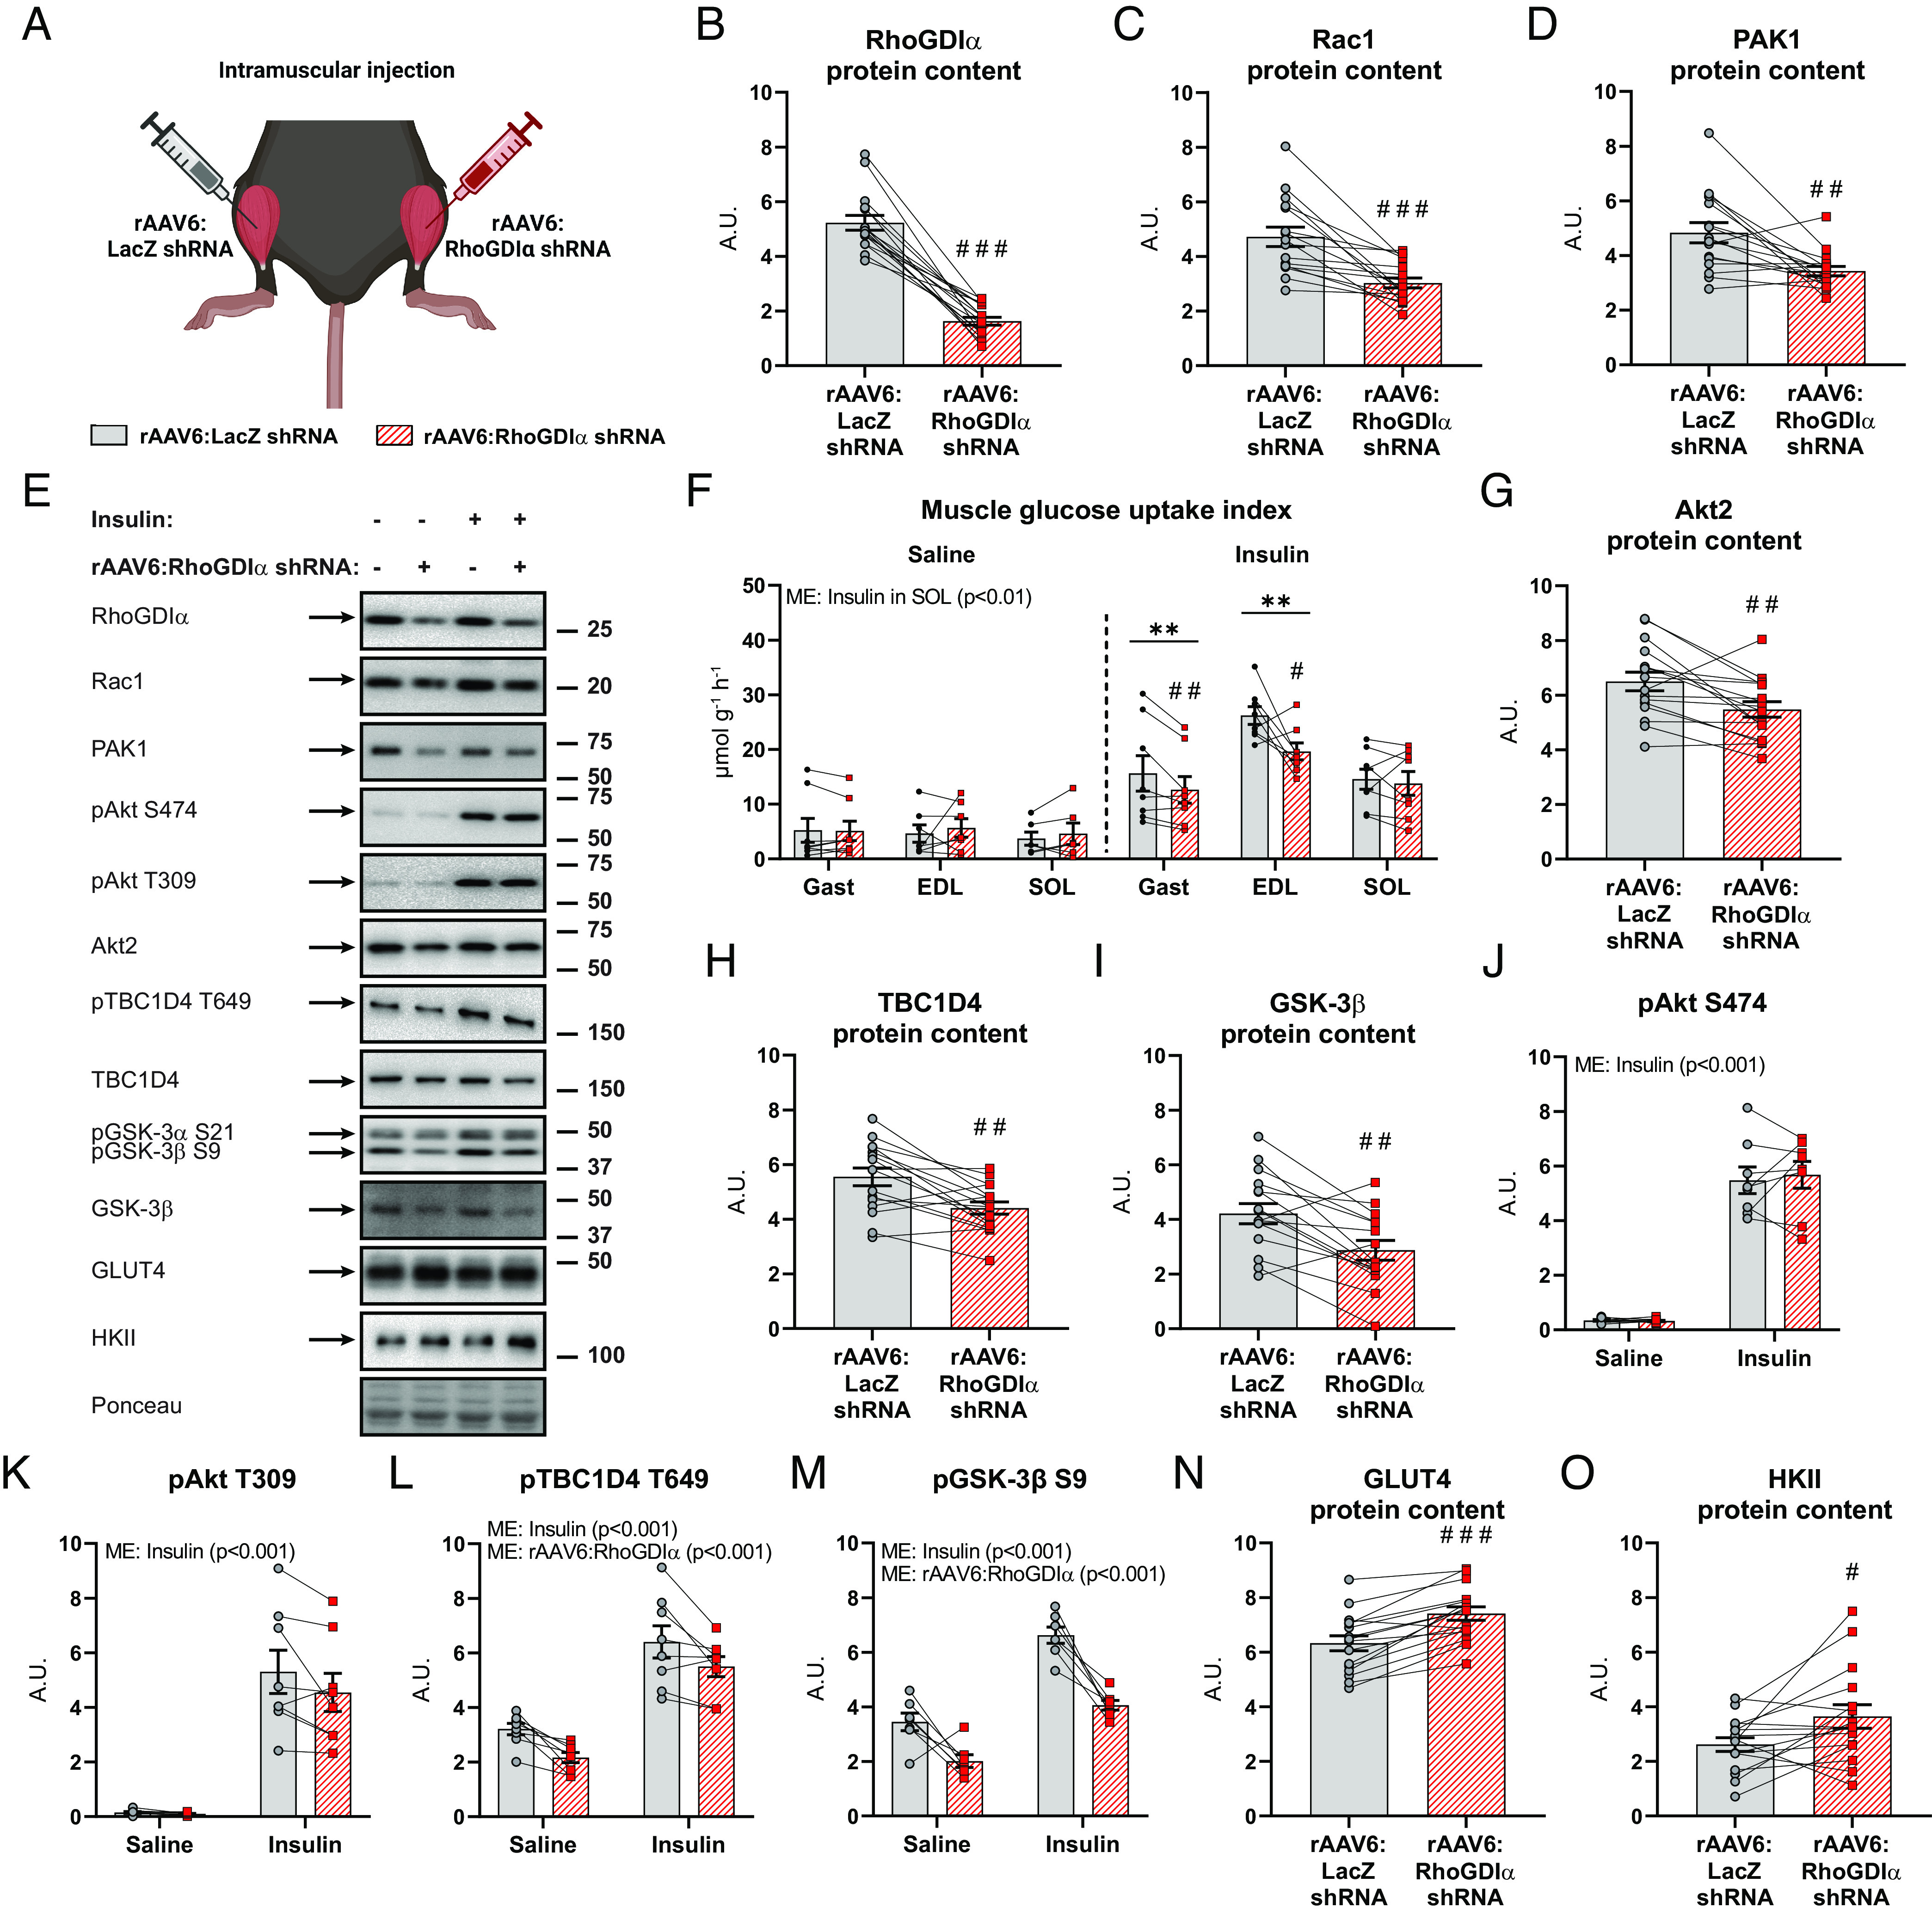
Chronic RhoGDIα knockdown negatively affects insulin-stimulated glucose uptake and intracellular insulin signaling in skeletal muscle. (A) Schematic of the experimental design. A recombinant adeno-associated viral vector encoding RhoGDIα shRNA (rAAV6:RhoGDIα shRNA) was administered intramuscularly in gastrocnemius (also targeting the soleus) and tibialis anterior (also targeting the EDL), while the contralateral muscles were injected with a control vector (rAAV6:LacZ shRNA). (B) RhoGDIα, (C) Rac1, and (D) PAK1 protein content in rAAV6:RhoGDIα shRNA- or rAAV6:LacZ shRNA-treated gastrocnemius muscle. Saline, n = 8; Insulin, n = 8. (E) Representative blots showing (B–D) and (G–O) and control ponceau staining. (F) Insulin-stimulated (0.5 U kg−1 body weight) glucose uptake index in rAAV6:LacZ shRNA- or rAAV6:RhoGDIα shRNA-treated gastrocnemius (Gast), extensor digitorum longus (EDL), and soleus (SOL) muscles. Saline, n = 8/7/6 (Gast/EDL/SOL); Insulin, n = 8/8/8. Data were evaluated with a two-way repeated measures (RM) ANOVA for each of the muscles. (G) Akt2, (H) TBC1D4, (I) GSK-3β, and (J) phosphorylated (p)Akt S474, (K) pAkt T309, (L) pTBC1D4 T649, (M) pGSK-3β S9, (N) GLUT4 and (O) HKII protein content in gastrocnemius muscle. Saline, n = 8; Insulin, n = 8. Total protein content was evaluated with a paired t test. Protein phosphorylation was evaluated with a two-way RM ANOVA. Main effects are indicated in the panels. Significant interactions in two-way RM ANOVAs and significant paired t tests: effect of rAAV6:RhoGDIα shRNA vs. rAAV6:LacZ shRNA #/##/### (P < 0.05/0.01/0.001) and effect of insulin ** (P < 0.01). Data are presented as mean SEM with individual data points shown. A.U., arbitrary units.
To explain the detrimental effects of chronic RhoGDIα knockdown on insulin-stimulated glucose uptake, we analyzed intracellular insulin signaling and glucose-handling proteins in gastrocnemius muscle. Interestingly, RhoGDIα knockdown resulted in the downregulation of multiple important insulin-responsive proteins, including Akt2 (−16%; Fig. 6G), TBC1D4 (−21%; Fig. 6H), and glycogen synthase kinase (GSK)-3β protein (−34%; Fig. 6I). While Akt phosphorylation was preserved (Fig. 6 J and K), signaling downstream of Akt was down-regulated. Thus, RhoGDIα knockdown reduced basal (-33%) and insulin-stimulated (−14%) TBC1D4 phosphorylation at T649 (Fig. 6L) and attenuated basal (−42%) and insulin-stimulated (−39%) GSK-3β S9 indicating downregulation of glycogen synthesis (Fig. 6M) (53). Potentially as a counter-regulatory mechanism, there was an upregulation of GLUT4 (+17%; Fig. 6N) and HKII (+39%; Fig. 6O) protein content. Complexes of the electron transport chain were unaffected by RhoGDIα knockdown (SI Appendix, Fig. S5C). Taken together, chronic RhoGDIα knockdown reduced insulin-stimulated glucose uptake. Multiple intracellular remodeling of the insulin-signaling cascade was observed due to RhoGDIα knockdown, including i) decreased protein content of Rac1, Akt2, TBC1D4, and GSK-3β, ii) reduced insulin signaling downstream of Akt, and iii) increased HKII and GLUT4 protein content. Thus, RhoGDIα knockdown caused marked intracellular signaling alterations, most remarkably revealing a hitherto unidentified link between TBC1D4- and GSK-3β-signaling with Rho GTPases.
Elevated Muscle RhoGDIα Protein Is Associated with Whole-Body Glucose Intolerance in Mice and Humans.
Given that RhoGDIα overexpression in striated muscle caused muscle insulin resistance, we explored the potential clinical relevance of RhoGDIα in muscle insulin resistance and glycemic control in human skeletal muscle. RhoGDIα protein content was determined in vastus lateralis biopsy samples from lean normal glucose tolerant (NGT), obese NGT, and obese type 2 diabetic (T2D) subjects of mixed sex with baseline characteristics previously published and insulin sensitivity verified (54, 55). The glucose disposal rate during a euglycemic hyperinsulinemic clamp was lower in T2D subjects compared to both lean NGT and obese NGT subjects (54). Obesity per se did not alter RhoGDIα protein content, as RhoGDIα protein content was similar between muscles from obese NGT and lean control NGT subjects (Fig. 7A). Yet, and notably, RhoGDIα protein content was 50% higher in obese T2D subjects compared with obese NGT subjects (Fig. 7 A and B). Impaired Rac1 signaling has previously been reported in skeletal muscle from insulin-resistant obese subjects with T2D (17). Thus, our results implicate RhoGDIα in the development of human insulin resistance, via elevated interaction with, and thereby inhibition of, Rac1.
Fig. 7.
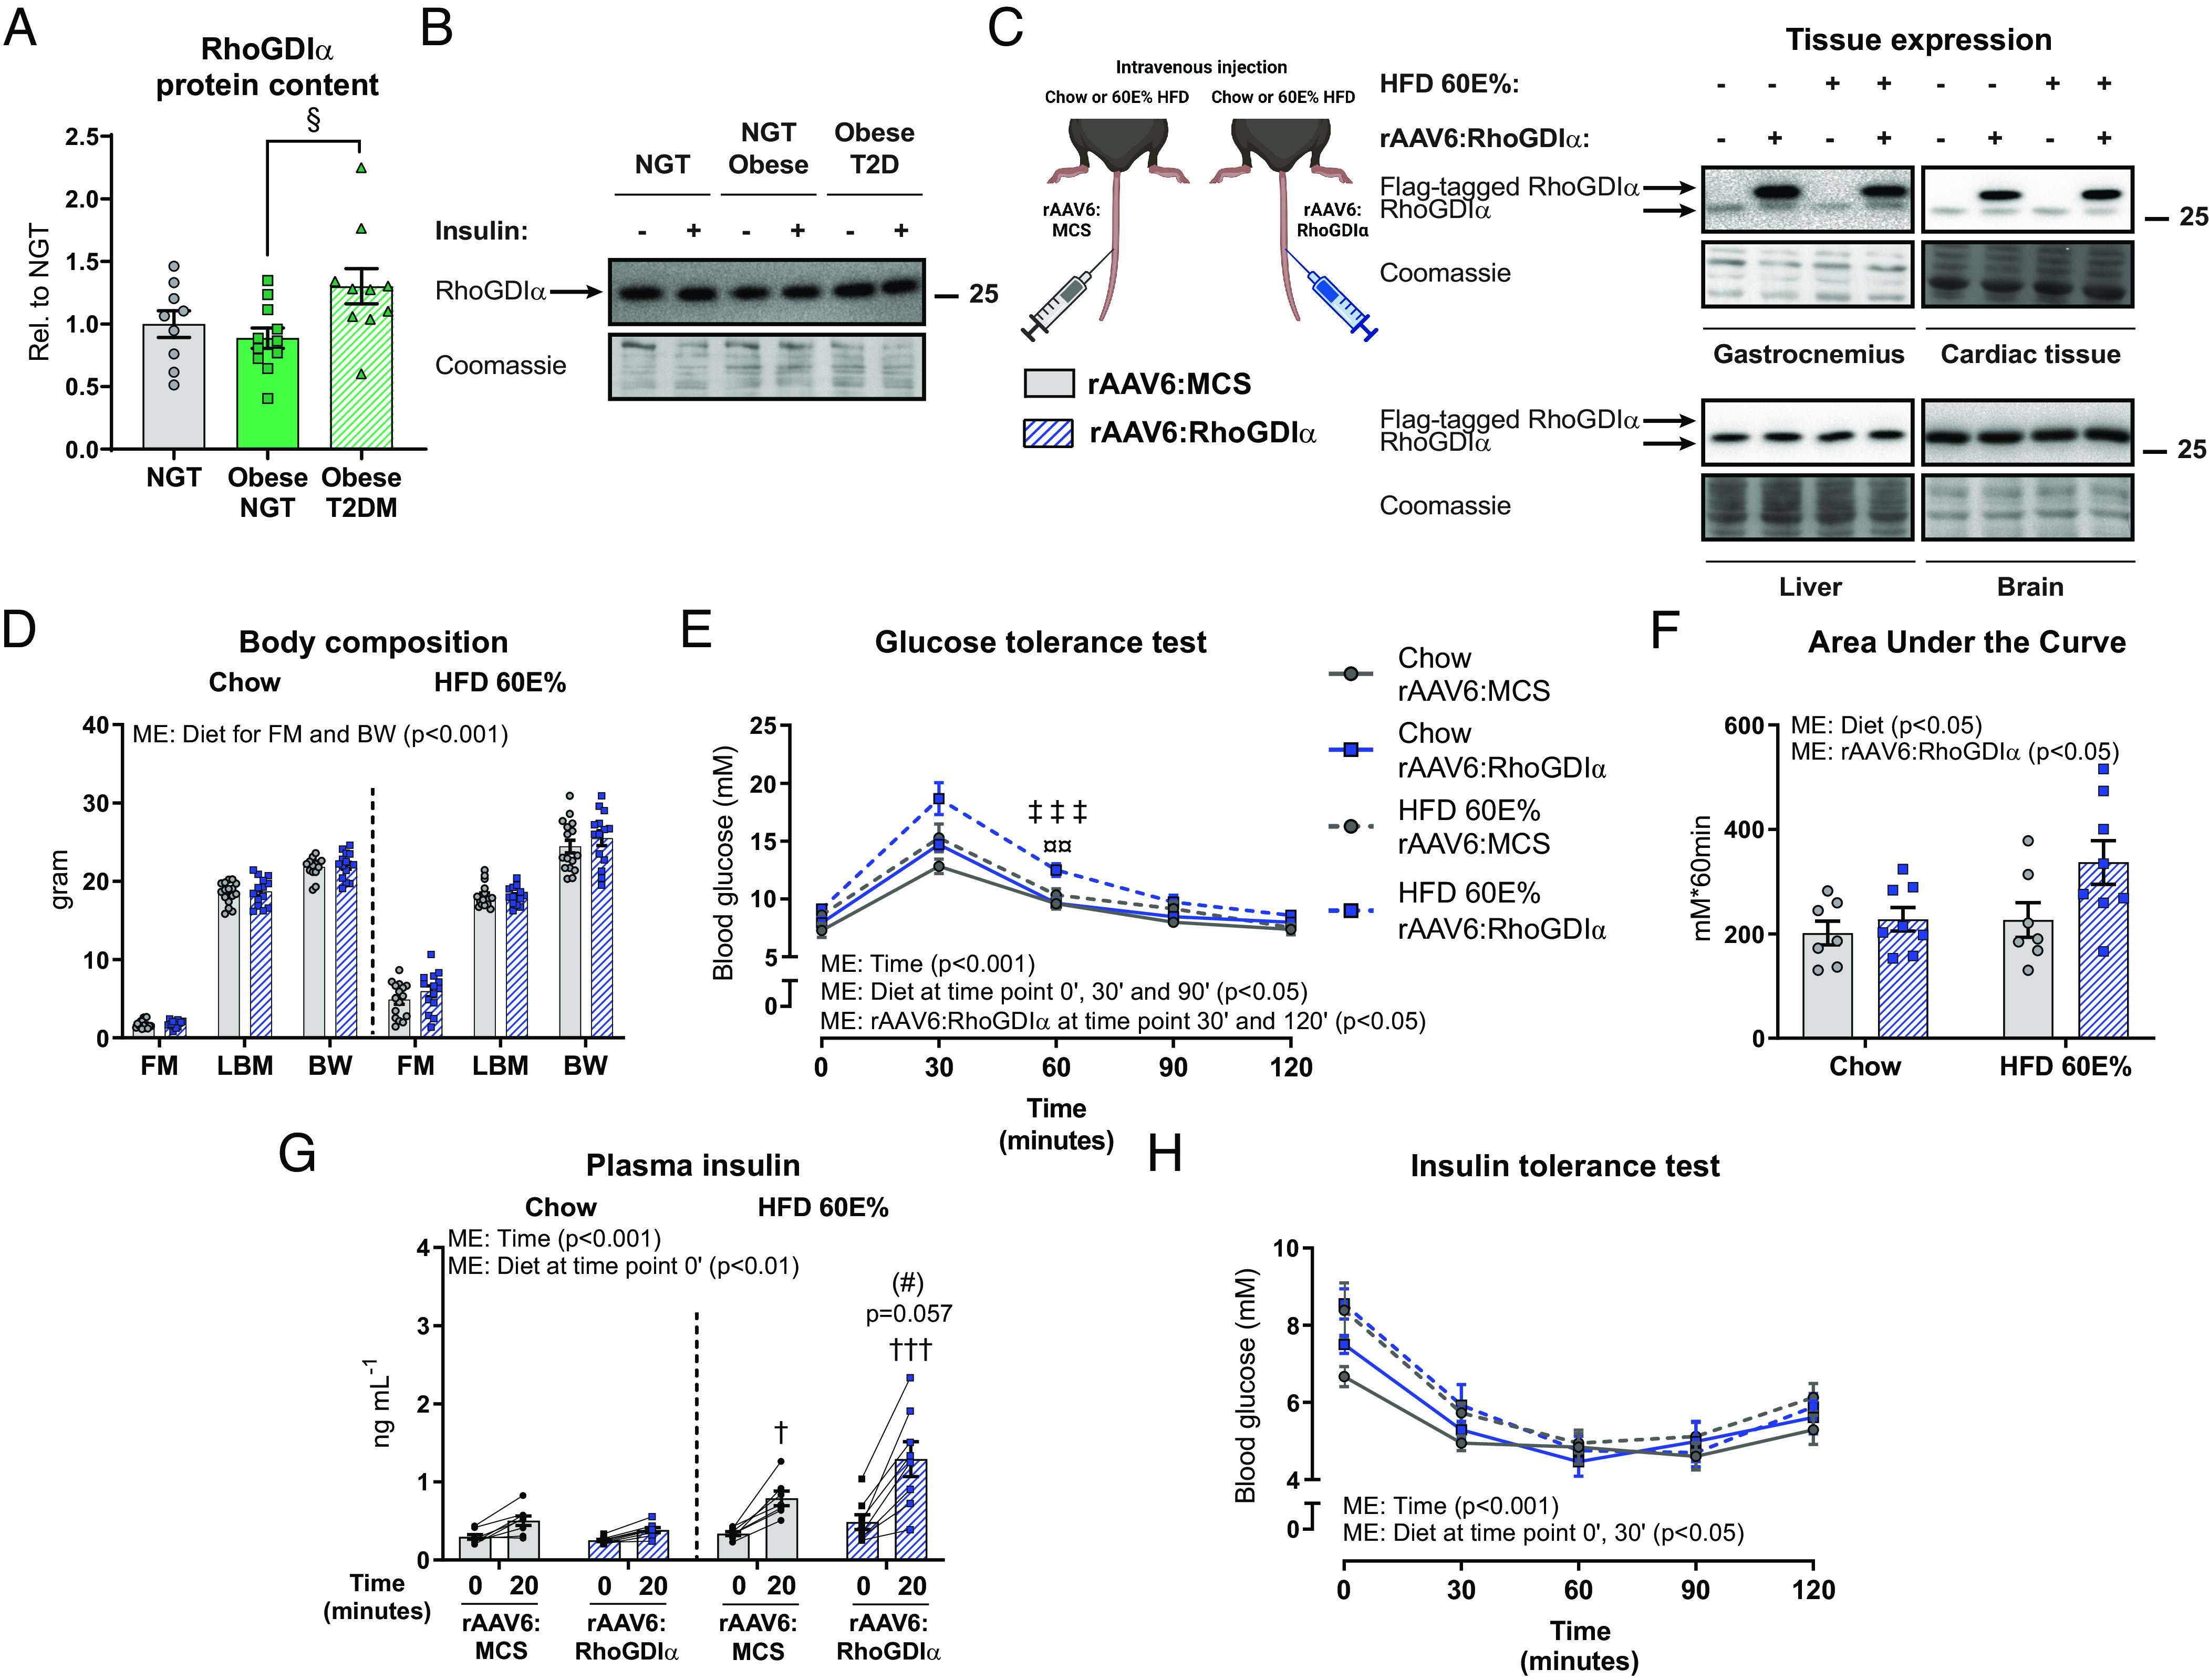
Elevated muscle RhoGDIα content is associated with whole-body glucose intolerance in mice and humans. (A) RhoGDIα protein content in lean normal glucose tolerant (NGT; n = 9), obese NGT (n = 11), and obese T2D (n = 10) subjects of mixed sex. (B) Representative blots showing RhoGDIα and control coomassie staining. The data were evaluated with a one-way ANOVA. (C) Experimental overview and representative blots of tissue protein content of RhoGDIα in chow- or 60E% HFD-fed mice 8 wk after recombinant adeno-associated viral vector-mediated overexpression of RhoGDIα (rAAV6:RhoGDIα) specifically in striated muscle after a single intravenous administration in young, adult mice. As a control, an empty vector was administered (rAAV6:MCS). (D) Body composition (FM: fat mass; LBM: lean body mass; BW: body weight) in gram. Data were evaluated with a two-way ANOVA separately for FM, LBM, and BW. (E) Blood glucose levels during a glucose tolerance test (GTT). Chow, n = 7/8 (rAAV6:MCS/rAAV6:RhoGDIα); HFD, n = 7/8. Data were evaluated with two two-way RM ANOVAs to test the factors “rAAV6” and “time point” (0’ vs. 30’ vs. 60’ vs. 90’ vs. 120’) in chow- and HFD-fed mice, respectively. The effect of HFD was assessed with five two-way ANOVAs to test the factors rAAV6 and “diet” at each time point, respectively. (F) Incremental Area Under the Curve for blood glucose levels during the first 60 min of the GTT in panel (E). Data were evaluated with a two-way ANOVA. (G) Plasma insulin levels during a GTT. Chow, n = 8/8 (rAAV6:MCS/rAAV6:RhoGDIα); HFD, n = 7/8. Data were evaluated with two two-way RM ANOVAs to test the factors rAAV6 and time point (0’ vs. 20’) in chow- and HFD-fed mice, respectively. The effect of HFD was assessed with two two-way ANOVAs to test the factors rAAV6 and diet at both time points, respectively. (H) Blood glucose levels during an insulin tolerance test. Chow, n = 7/8 (rAAV6:MCS/rAAV6:RhoGDIα); HFD, n = 7/8. Data were evaluated with two two-way RM ANOVAs to test the factors rAAV6 and time point (0’ vs. 30’ vs. 60’ vs. 90’ vs. 120’) in chow- and HFD-fed mice, respectively. The effect of HFD was assessed with five two-way ANOVAs to test the factors rAAV6 and diet at each time point, respectively. Main effects are indicated in the panels. Significant interactions in two-way ANOVAs and significant one-way ANOVAs: Effect of rAAV6:RhoGDIα vs. rAAV6:MCS (#) (P < 0.1); Chow vs. HFD †/††† (P < 0.05/0.001); rAAV6:RhoGDIα vs. rAAV6:MCS in HFD-fed mice ¤¤ (P < 0.01); Chow vs. HFD in rAAV6:RhoGDIα ‡‡‡ (P < 0.001); Obese NGT vs. Obese T2D § (P < 0.05). Data are presented as mean SEM or when applicable mean SEM with individual data points shown.
Since RhoGDIα protein content was up-regulated in the skeletal muscle of insulin-resistant T2D subjects, we determined the whole-body consequences of rAAV-induced skeletal muscle RhoGDIα overexpression. RhoGDIα was overexpressed specifically in all striated muscles (i.e., skeletal and cardiac muscle) after a single intravenous rAAV6 administration in mice (Fig. 7C). Muscle-specific RhoGDIα overexpression did not affect body weight (Fig. 7D and SI Appendix, Fig. S6A), fat mass, or lean body mass (Fig. 7D) in 8 wk chow- or 60E% HFD-fed mice. RhoGDIα overexpression in striated muscles slightly increased habitual activity in the fasting state but did not alter energy intake or substrate utilization (SI Appendix, Fig. S6 B–D). Blood glucose concentration was 16% elevated by HFD- compared to chow-fed mice 7 wk into the diet intervention but unaffected by RhoGDIα overexpression (SI Appendix, Fig. S6E). Interestingly, mice overexpressing RhoGDIα in skeletal and cardiac muscles were glucose intolerant, particularly diet-induced obese mice (Fig. 7E). Thus, the incremental area under the blood glucose curve during the first 60 min of the test was 49% larger in HFD-fed mice overexpressing RhoGDIα in muscle compared to control mice administered an empty viral vector (Fig. 7F). The impaired glucose tolerance occurred despite fourfold increased Rac1 protein content in skeletal muscle (SI Appendix, Fig. S6 F and G). In response to the glucose administration, the plasma insulin concentration tended (P = 0.057) higher in HFD-fed mice with muscle-specific RhoGDIα overexpression compared to control HFD-fed mice (+63%; Fig. 7G), suggesting impaired insulin sensitivity. However, an insulin tolerance test (Fig. 7H) failed to reveal insulin resistance in response to either the HFD or RhoGDIα overexpression, so possibly other tissues compensate for the systemic effects of RhoGDIα overexpression in muscle. This scenario is in line with our previous results that muscle-specific Rac1 KO mice do not develop whole-body insulin resistance despite reduced muscle glucose uptake (43). These findings show that elevated skeletal muscle RhoGDIα protein is associated with whole-body glucose intolerance in mice and humans.
Discussion
The present study identifies RhoGDIα as a negative regulator of Rac1 in skeletal muscle, muscle insulin action, and whole-body glucose homeostasis. We establish five major functions of skeletal muscle RhoGDIα in cell systems and mouse and human skeletal muscle: First, RhoGDIα interacts with Rac1 thereby inhibiting Rac1 activity. Second, phosphorylation of RhoGDIα at S101 was necessary for insulin-induced Rac1 activation and GLUT4 translocation in skeletal muscle. Third, RhoGDIα provides input to multiple intracellular insulin signaling processes in skeletal muscle. Fourth, muscle-specific RhoGDIα overexpression impairs whole-body glucose tolerance. Finally, RhoGDIα protein content is increased in insulin-resistant skeletal muscle in patients with type 2 diabetes. Taken together, our findings not only unravel RhoGDIα as a new component to the insulin signaling cascade but also highlight previously unrecognized molecular mechanisms implicated in muscle insulin resistance.
Targeting proteins involved in GLUT4 translocation would be worth exploring for pharmacological strategies to treat insulin resistance in conditions such as T2D and obesity. We took an unbiased proteomics approach to identify new regulators of Rac1 activity and found that inactive Rac1 interacted with RhoGDIα in L6 myoblasts. Mechanistically, we show that RhoGDIα inhibits Rac1 activity in skeletal muscle, as RhoGDIα depletion increased Rac1 activity. Correspondingly, overexpression of RhoGDIα inhibited Rac1 activity. Aligning with our results, RhoGDIα reportedly exists in a heterodimer with Rac1 and RhoA in several nonmuscle cells (24, 31, 56, 57) and GTP-bound Rac1 is increased in kidneys of RhoGDIα−/− mice (58).
Mechanistically, our findings suggest that insulin-induced Rac1-RhoGDIα dissociation in response to insulin is mediated by phosphorylation of RhoGDIα S101. Thus, expression of a RhoGDIα S101A mutant abolished insulin-stimulated Rac1 activation and attenuated insulin-stimulated GLUT4 translocation in GLUT4myc L6 myotubes. The kinase(s) responsible for RhoGDIα S101 phosphorylation remains to be identified. Previous studies have suggested that PAK1, which is a downstream target of Rac1, in turn phosphorylates RhoGDIα at S101 causing Rac1 activation (59). That raises the possibility of Rac1-induced feed-forward stimulation of Rac1 activity. Yet, other kinase groups (e.g., calcium/calmodulin-dependent kinases [CAMK], tyrosine-kinase like kinases [TKL], the AGC [cAMP-dependent, cGMP-dependent and protein kinase C] protein kinase family) are also predicted potential regulators (60), constituting an exciting area of future research.
While RhoGDIα–Rac1 complex formation inhibited Rac1, potentially being in complex with RhoGDIα also protected Rac1 from degradation. This was suggested by RAC1 mRNA being stable, while RhoGDIα knockdown or overexpression caused a reduction or elevation, respectively, in Rac1 protein abundance. However, further studies are needed to support this function of RhoGDIα in skeletal muscle. The requirement for RhoGDIα to maintain a stable intramyocellular Rho GTPase protein pool corroborates findings in HeLa cells (49) and resonates with observations in nonmuscle cells showing that Rac1 ubiquitination occurs exclusively when Rac1 is activated (61). Taken together, our findings unravel a mechanism by which insulin causes phosphorylation of RhoGDIα S101 to destabilize the RhoGDIα–Rac1 complex, resulting in dissociation of Rac1 from RhoGDIα, thereby freeing up Rac1 for subsequent activation and potentially resulting in degradation.
A second discovery of our study was that RhoGDIα evokes negative regulation upon insulin-stimulated GLUT4 translocation and glucose uptake in skeletal muscle in vitro and in vivo. Given that RhoGDIα negatively regulated Rac1, our results agree with other studies showing that Rac1 depletion or expression of a dominant-negative Rac1 mutant inhibits insulin-stimulated GLUT4 translocation in L6 myotubes (14, 15), and Rac1 knockout mice displayed reduced insulin-stimulated glucose uptake (16–18, 43).
In L6 myotubes, acute RhoGDIα knockdown increased GLUT4 translocation and restored ceramide-induced insulin resistance, suggesting that RhoGDIα downregulation or inhibition may have the potential to prevent muscle insulin resistance. This finding builds on work showing that C2-ceramide–induced insulin resistance attenuates Rac1 activity and Rac1-mediated actin cytoskeleton remodeling and insulin-stimulated GLUT4 translocation (15). Because of those collective in vitro results, we were surprised to find that chronic (8 wk) RhoGDIα depletion in mouse skeletal muscle actually reduced insulin-stimulated glucose uptake. The cause of the discrepancy between in vitro and in vivo results could be what was our third major discovery, the remarkable intramyocellular remodeling that occurred by chronic RhoGDIα depletion in muscle in vivo, including a clear lowering of Rac1, PAK1, Akt2, TBC1D4, and GSK-3β protein content, and reduction in intracellular insulin signaling downstream of Akt. Possibly to counterbalance these effects, chronic RhoGDIα depletion resulted in an increase in the content of HKII and GLUT4 proteins. The same degree of intramyocellular remodeling was not observed in response to overexpression of RhoGDIα in vivo. Here, and consistent with our in vitro results, phosphorylation of PAK1 T423 was lowered in the basal and insulin-stimulated state of RhoGDIα overexpressing muscles, indicating decreased Rac1 activity (39). PAK1 and 2 initiate a signaling cascade that regulates the actin cytoskeleton. Accordingly, RhoGDIα knockdown resulted in accelerated actin-cytoskeleton reorganization in response to insulin in L6 myotubes. However, it should be noted that insulin-stimulated glucose uptake only partially requires PAK2, while PAK1 is dispensable in isolated mouse muscle (26). As another potential effector protein downstream of Rac1, RalA is also required for insulin-stimulated GLUT4 translocation in myoblasts and mouse skeletal muscle (28). Moreover, regulators of actin cytoskeleton dynamics downstream of Rac1, Arp3, and cofilin are associated with the regulation of GLUT4 translocation in L6 myoblasts (62). However, these mechanisms remain to be confirmed in mature muscle in vivo. Thus, additional mechanisms may be acting downstream of the RhoGDIα–Rac1 complex to control insulin-stimulated glucose uptake in skeletal muscle which should be the topic of future research. In aggregate, our results illustrate that prolonged manipulation of RhoGDIα (and thereby Rho GTPase content andactivity) is detrimental to skeletal muscle glucose uptake, endorsing an important role for RhoGDIα in maintaining homeostatic glucose metabolism in mouse skeletal muscle. To investigate the acute effects of RhoGDIα knockdown in vivo, the generation of a transient, muscle-specific knockdown model or pharmacological inhibition of RhoGDIα in vivo in mouse muscle is needed. Interestingly, skeletal muscle insulin resistance, caused by skeletal muscle RhoGDIα overexpression, impaired whole-body glucose tolerance in both lean and diet-induced obese mice.
The human relevance of RhoGDIα is likely as we observed elevated RhoGDIα protein content in skeletal muscle from patients with obesity and T2D compared to obese but normoglycemic subjects. These results extend previous findings showing that Rac1 is dysregulated in insulin-resistant rodent and human skeletal muscle (17, 18). Conceivably, the increased RhoGDIα protein content could contribute to the decrease in Rac1 activity in insulin-resistant T2D patients (17, 54). Our findings thus provide a potential mechanism for the establishment of insulin resistance in humans.
In conclusion, we here provide results that not only unravel the RhoGDIα–Rac1 complex as a crucial component to the insulin signaling cascade but also identify novel molecular mechanisms implicated in muscle insulin resistance.
Materials and Methods
Please see SI Appendix, Materials and Methods for a full description of the methods used.
Statistical Analyses.
Data are presented as means ± SEM. with individual data points shown for all bar graphs. Statistical tests varied according to the dataset being analyzed and the specific tests used are indicated in the figure legends. P < 0.05 was considered statistically significant. P < 0.1 was considered a tendency. All statistical analyses were performed using Sigma Plot, version 13 (Systat Software Inc.; RRID:SCR_003210).
Supplementary Material
Appendix 01 (PDF)
Dataset S01 (XLSX)
Acknowledgments
We thank our colleagues at the August Krogh Section of Molecular Physiology, Department of Nutrition, Exercise, and Sports (NEXS), Faculty of Science, University of Copenhagen, for fruitful discussions on this topic. We acknowledge the guidance and hospitality of Prof. Bruce Spiegelman and his laboratory at the Dana Farber Cancer Institute and Harvard Medical School. We acknowledge the skilled technical assistance of Betina Bolmgren and Irene B. Nielsen (NEXS, Faculty of Science, University of Copenhagen, Denmark). We acknowledge the Core Facility for Integrated Microscopy, Faculty of Health and Medical Sciences, University of Copenhagen. We thank the reviewers for the time and effort to provide constructive feedback on our manuscript. Illustrations were generated using Biorender.com (RRID:SCR_018361). Graphs were generated with GraphPad PRISM (RRID:SCR_002798). This study was supported by a PhD fellowship from The Lundbeck Foundation (grant R208-2015-3388 to L.L.V.M.); Postdoctoral fellowship from The Lundbeck Foundation (R322-2019-2688 to L.L.V.M.); The Danish Council for Independent Research, Medical Sciences (grant DFF-4004-00233 to L.S., grant 6108-00203 to E.A.R.); Canadian Institutes of Health Research Foundation Grant (FRN: FDN-143203 to A.K.); and The Novo Nordisk Foundation (grant 10429 to E.A.R., grant 15182 to T.E.J., grant NNF16OC0023418 and NNF18OC0032082 to L.S.).
Author contributions
L.L.V.M., J.D., J.Z.L., T.T.C., M.P.J., P.G., A.K., E.A.R., and L.S. designed research; L.L.V.M., M.S.A., N.R.A., J.Z.L., C.H.-O., E.F., T.E.J., J.N., T.T.C., M.P.J., and L.S. performed research; L.L.V.M., J.D., H.Q., J.F.J., K.H., J.F.P.W., J.N., P.G., A.K., and L.S. contributed new reagents/analytic tools; L.L.V.M., S.H.R., J.N., T.T.C., M.P.J., and L.S. analyzed data; and L.L.V.M., A.K., E.A.R., and L.S. wrote the paper.
Competing interests
The authors declare no competing interest.
Footnotes
This article is a PNAS Direct Submission.
Contributor Information
Erik A. Richter, Email: Erichter@nexs.ku.dk.
Lykke Sylow, Email: Lykkesylow@sund.ku.dk.
Data, Materials, and Software Availability
The authors confirm that the data supporting the findings of this study are available within the article and/or supporting information. The mass spectrometry proteomic dataset from the Flag-Rac1 interactome in L6 myoblasts is provided in Dataset S1.
Supporting Information
References
- 1.DeFronzo R. A., Gunnarsson R., Björkman O., Olsson M., Wahren J., Effects of insulin on peripheral and splanchnic glucose metabolism in noninsulin-dependent (type II) diabetes mellitus. J. Clin. Invest. 76, 149–155 (1985). [DOI] [PMC free article] [PubMed] [Google Scholar]
- 2.Batsis J. A., Villareal D. T., Sarcopenic obesity in older adults: Aetiology, epidemiology and treatment strategies. Nat. Rev. Endocrinol. 14, 513–537 (2018). [DOI] [PMC free article] [PubMed] [Google Scholar]
- 3.Esposito K., Chiodini P., Colao A., Lenzi A., Giugliano D., Metabolic Syndrome and Risk of Cancer: A systematic review and meta-analysis. Diabetes Care 35, 2402–2411 (2012). [DOI] [PMC free article] [PubMed] [Google Scholar]
- 4.Han X., et al. , Cancer causes metabolic perturbations associated with reduced insulin-stimulated glucose uptake in peripheral tissues and impaired muscle microvascular perfusion. Metabolism 105, 154169 (2020). [DOI] [PubMed] [Google Scholar]
- 5.Màrmol J. M., et al. , Insulin resistance in patients with cancer: a systematic review and meta-analysis. Acta Oncol. (Madr). 62, 364–371 (2023). [DOI] [PubMed] [Google Scholar]
- 6.Paternostro G., et al. , Cardiac and skeletal muscle insulin resistance in patients with coronary heart disease. A study with positron emission tomography. J. Clin. Invest. 98, 2094–2099 (1996). [DOI] [PMC free article] [PubMed] [Google Scholar]
- 7.Baron A. D., Brechtel G., Wallace P., Edelman S. V., Rates and tissue sites of non-insulin- and insulin-mediated glucose uptake in humans. Am. J. Physiol. Metab. 255, E769–E774 (1988). [DOI] [PubMed] [Google Scholar]
- 8.Ferrannini E., et al. , The disposal of an oral glucose load in healthy subjects. A quantitative study. Diabetes 34, 580–588 (1985). [DOI] [PubMed] [Google Scholar]
- 9.King P. A., Horton E. D. S., Hirshman M. F., Horton E. D. S., Insulin resistance in obese Zucker rat (fa/fa) skeletal muscle is associated with a failure of glucose transporter translocation. J. Clin. Invest. 90, 1568–1575 (1992). [DOI] [PMC free article] [PubMed] [Google Scholar]
- 10.Klip A., et al. , Recruitment of GLUT-4 glucose transporters by insulin in diabetic rat skeletal muscle. Biochem. Biophys. Res. Commun. 172, 728–736 (1990). [DOI] [PubMed] [Google Scholar]
- 11.Zierath J. R., et al. , Insulin action on glucose transport and plasma membrane GLUT4 content in skeletal muscle from patients with NIDDM. Diabetologia 39, 1180–1189 (1996). [DOI] [PubMed] [Google Scholar]
- 12.Ryder J. W., et al. , Use of a novel impermeable biotinylated photolabeling reagent to assess insulin- and hypoxia-stimulated cell surface GLUT4 content in skeletal muscle from type 2 diabetic patients. Diabetes 49, 647–654 (2000). [DOI] [PubMed] [Google Scholar]
- 13.Sylow L., Tokarz V. L., Richter E. A., Klip A., The many actions of insulin in skeletal muscle, the paramount tissue determining glycemia. Cell Metab. 33, 758–780 (2021). [DOI] [PubMed] [Google Scholar]
- 14.Khayat Z. A., Tong P., Yaworsky K., Bloch R. J., Klip A., Insulin-induced actin filament remodeling colocalizes actin with phosphatidylinositol 3-kinase and GLUT4 in L6 myotubes. J. Cell Sci. 113, 279–290 (2000). [DOI] [PubMed] [Google Scholar]
- 15.JeBailey L., et al. , Ceramide- and oxidant-induced insulin resistance involve loss of insulin-dependent Rac-activation and actin remodeling in muscle cells. Diabetes 56, 394–403 (2007). [DOI] [PubMed] [Google Scholar]
- 16.Ueda S., et al. , Crucial role of the small GTPase Rac1 in insulin-stimulated translocation of glucose transporter 4 to the mouse skeletal muscle sarcolemma. FASEB J. 24, 2254–2261 (2010). [DOI] [PMC free article] [PubMed] [Google Scholar]
- 17.Sylow L., et al. , Rac1 signaling is required for insulin-stimulated glucose uptake and is dysregulated in insulin-resistant murine and human skeletal muscle. Diabetes 62, 1865–1875 (2013). [DOI] [PMC free article] [PubMed] [Google Scholar]
- 18.Sylow L., et al. , Akt and Rac1 signaling are jointly required for insulin-stimulated glucose uptake in skeletal muscle and downregulated in insulin resistance. Cell. Signal. 26, 323–331 (2014). [DOI] [PubMed] [Google Scholar]
- 19.Kleinert M., et al. , Quantitative proteomic characterization of cellular pathways associated with altered insulin sensitivity in skeletal muscle following high-fat diet feeding and exercise training. Sci. Rep. 8, 10723 (2018). [DOI] [PMC free article] [PubMed] [Google Scholar]
- 20.Rossman K. L., Der C. J., Sondek J., GEF means go: Turning on RHO GTPases with guanine nucleotide-exchange factors. Nat. Rev. Mol. Cell Biol. 6, 167–180 (2005). [DOI] [PubMed] [Google Scholar]
- 21.Bos J. L., Rehmann H., Wittinghofer A., GEFs and GAPs: Critical elements in the control of small g proteins. Cell 129, 865–877 (2007). [DOI] [PubMed] [Google Scholar]
- 22.Takenaka N., et al. , Role of the guanine nucleotide exchange factor in Akt2-mediated plasma membrane translocation of GLUT4 in insulin-stimulated skeletal muscle. Cell. Signal. 26, 2460–2469 (2014). [DOI] [PubMed] [Google Scholar]
- 23.Rodríguez-Fdez S., et al. , Vav2 catalysis-dependent pathways contribute to skeletal muscle growth and metabolic homeostasis. Nat. Commun. 11, 1–26 (2020). [DOI] [PMC free article] [PubMed] [Google Scholar]
- 24.DerMardirossian C., Bokoch G. M., GDIs: Central regulatory molecules in Rho GTPase activation. Trends Cell Biol. 15, 356–363 (2005). [DOI] [PubMed] [Google Scholar]
- 25.Golding A. E., Visco I., Bieling P., Bement W. M., Extraction of active rhoGTPases by rhoGDI regulates spatiotemporal patterning of rhogtpases. Elife 8, e50471 (2019), 10.7554/eLife.50471. [DOI] [PMC free article] [PubMed] [Google Scholar]
- 26.Moller L. L. V., et al. , Insulin-stimulated glucose uptake partly relies on p21-activated kinase (PAK)-2, but not PAK1, in mouse skeletal muscle. J. Physiol. 598, 5351–5377 (2020). [DOI] [PMC free article] [PubMed] [Google Scholar]
- 27.Tunduguru R., et al. , Signaling of the p21-activated kinase (PAK1) coordinates insulin-stimulated actin remodeling and glucose uptake in skeletal muscle cells. Biochem. Pharmacol. 92, 380–388 (2014). [DOI] [PMC free article] [PubMed] [Google Scholar]
- 28.Takenaka N., et al. , Role for RalA downstream of Rac1 in skeletal muscle insulin signalling. Biochem. J. 469, 445–454 (2015). [DOI] [PubMed] [Google Scholar]
- 29.Roberts P. J., et al. , Rho Family GTPase modification and dependence on CAAX motif-signaled posttranslational modification. J. Biol. Chem. 283, 25150–25163 (2008). [DOI] [PMC free article] [PubMed] [Google Scholar]
- 30.Esposito G., et al. , Dermcidin: a skeletal muscle myokine modulating cardiomyocyte survival and infarct size after coronary artery ligation. Cardiovasc. Res. 107, 431–441 (2015). [DOI] [PubMed] [Google Scholar]
- 31.Bokoch G. M., Bohl B. P., Chuang T. H., Guanine nucleotide exchange regulates membrane translocation of Rac/Rho GTP-binding proteins. J. Biol. Chem. 269, 31674–31679 (1994). [PubMed] [Google Scholar]
- 32.Wang Z., Thurmond D. C., Differential phosphorylation of RhoGDI mediates the distinct cycling of Cdc42 and Rac1 to regulate second-phase insulin secretion. J. Biol. Chem. 285, 6186–6197 (2010). [DOI] [PMC free article] [PubMed] [Google Scholar]
- 33.Deshmukh A. S., et al. , Deep muscle-proteomic analysis of freeze-dried human muscle biopsies reveals fiber type-specific adaptations to exercise training. Nat. Commun. 12, 304 (2021). [DOI] [PMC free article] [PubMed] [Google Scholar]
- 34.Murgia M., et al. , Single muscle fiber proteomics reveals fiber-type-specific features of human muscle aging. Cell Rep. 19, 2396–2409 (2017). [DOI] [PubMed] [Google Scholar]
- 35.Lord S. J., Velle K. B., Mullins R. D., Fritz-Laylin L. K., SuperPlots: Communicating reproducibility and variability in cell biology. J. Cell Biol. 219, e202001064 (2020). [DOI] [PMC free article] [PubMed] [Google Scholar]
- 36.Rose A. J., Jeppesen J., Kiens B., Richter E. A., Effects of contraction on localization of GLUT4 and v-SNARE isoforms in rat skeletal muscle. Am. J. Physiol. Regul. Integr. Comp. Physiol. 297, 1228–1237 (2009). [DOI] [PubMed] [Google Scholar]
- 37.Garcia-Mata R., Boulter E., Burridge K., The “invisible hand”: Regulation of RHO GTPases by RHOGDIs. Nat. Rev. Mol. Cell Biol. 12, 493–504 (2011). [DOI] [PMC free article] [PubMed] [Google Scholar]
- 38.Manser E., Leung T., Salihuddin H., Zhao Z., Lim L., A brain serine/threonine protein kinase activated by Cdc42 and Rac1. Nature 367, 40–46 (1994). [DOI] [PubMed] [Google Scholar]
- 39.Manser E., et al. , Molecular cloning of a new member of the p21-Cdc42/Rac-activated kinase (PAK) family. J. Biol. Chem. 270, 25070–25078 (1995). [DOI] [PubMed] [Google Scholar]
- 40.Tsakiridis T., Taha C., Grinsteinl S., Klip A., Insulin activates a p21-activated kinase in muscle cells via phosphatidylinositol 3-kinase. J. Biol. Chem. 271, 19664–19667 (1996). [DOI] [PubMed] [Google Scholar]
- 41.Møller L. L. V., Klip A., Sylow L., Rho GTPases—emerging regulators of glucose homeostasis and metabolic health. Cells 8, 434 (2019). [DOI] [PMC free article] [PubMed] [Google Scholar]
- 42.Chiu T. T., Sun Y., Koshkina A., Klip A., Rac-1 superactivation triggers insulin-independent glucose transporter 4 (GLUT4) translocation that bypasses signaling defects exerted by c-Jun N-terminal kinase (JNK)- and ceramide-induced insulin resistance. J. Biol. Chem. 288, 17520–17531 (2013). [DOI] [PMC free article] [PubMed] [Google Scholar]
- 43.Raun S. H., et al. , Rac1 muscle knockout exacerbates the detrimental effect of high-fat diet on insulin-stimulated muscle glucose uptake independently of Akt. J. Physiol. 596, 2283–2299 (2018). [DOI] [PMC free article] [PubMed] [Google Scholar]
- 44.Hajduch E., et al. , Ceramide impairs the insulin-dependent membrane recruitment of protein kinase B leading to a loss in downstream signalling in L6 skeletal muscle cells. Diabetologia 44, 173–183 (2001). [DOI] [PubMed] [Google Scholar]
- 45.Tong P., et al. , Insulin-induced cortical actin remodeling promotes GLUT4 insertion at muscle cell membrane ruffles. J. Clin. Invest. 108, 371–381 (2001). [DOI] [PMC free article] [PubMed] [Google Scholar]
- 46.Brozinick J. T., Hawkins E. D., Strawbridge A. B., Elmendorf J. S., Disruption of cortical actin in skeletal muscle demonstrates an essential role of the cytoskeleton in glucose transporter 4 translocation in insulin-sensitive tissues. J. Biol. Chem. 279, 40699–40706 (2004). [DOI] [PMC free article] [PubMed] [Google Scholar]
- 47.Sylow L., et al. , Rac1 is a novel regulator of contraction-stimulated glucose uptake in skeletal muscle. Diabetes 62, 1139–1151 (2013). [DOI] [PMC free article] [PubMed] [Google Scholar]
- 48.Sylow L., Møller L. L. V., Kleinert M., Richter E. A., Jensen T. E., Rac1 - a novel regulator of contraction-stimulated glucose uptake in skeletal muscle. Exp. Physiol. 99, 1574–1580 (2014). [DOI] [PubMed] [Google Scholar]
- 49.Boulter E., et al. , Regulation of Rho GTPase crosstalk, degradation and activity by RhoGDI1. Nat. Cell Biol. 12, 477–483 (2010). [DOI] [PMC free article] [PubMed] [Google Scholar]
- 50.Takenaka N., et al. , A critical role of the small GTPase Rac1 in Akt2-mediated GLUT4 translocation in mouse skeletal muscle. FEBS J. 281, 1493–1504 (2014). [DOI] [PubMed] [Google Scholar]
- 51.Halseth A. E., Bracy D. P., Wasserman D. H., Overexpression of hexokinase II increases insulinand exercise-stimulated muscle glucose uptake in vivo. Am. J. Physiol. Metab. 276, E70–E77 (1999). [DOI] [PubMed] [Google Scholar]
- 52.Dikalov S., Cross talk between mitochondria and NADPH oxidases. Free Radic. Biol. Med. 51, 1289–1301 (2011). [DOI] [PMC free article] [PubMed] [Google Scholar]
- 53.Cross D. A. E., et al. , The inhibition of glycogen synthase kinase-3 by insulin or insulin-like growth factor 1 in the rat skeletal muscle cell line L6 is blocked by wortmannin, but not by rapamycin: evidence that wortmannin blocks activation of the mitogen-activated protein kin. Biochem. J. 303, 21–26 (1994). [DOI] [PMC free article] [PubMed] [Google Scholar]
- 54.Højlund K., et al. , Dysregulation of glycogen synthase COOH- and NH2-Terminal phosphorylation by insulin in obesity and Type 2 diabetes mellitus. J. Clin. Endocrinol. Metab. 94, 4547–4556 (2009). [DOI] [PubMed] [Google Scholar]
- 55.Handberg A., Levin K., Højlund K., Beck-Nielsen H., Identification of the oxidized low-density lipoprotein scavenger receptor CD36 in plasma: A novel marker of insulin resistance. Circulation 114, 1169–1176 (2006). [DOI] [PubMed] [Google Scholar]
- 56.Abo A., et al. , Activation of the NADPH oxidase involves the small GTP-binding protein p21rac1. Nature 353, 668–670 (1991). [DOI] [PubMed] [Google Scholar]
- 57.Moissoglu K., Slepchenko B. M., Meller N., Horwitz A. F., Schwartz M. A., In vivo dynamics of Rac-membrane interactions. Mol. Biol. Cell 17, 2770–2779 (2006). [DOI] [PMC free article] [PubMed] [Google Scholar]
- 58.Shibata S., et al. , Modification of mineralocorticoid receptor function by Rac1 GTPase: Implication in proteinuric kidney disease. Nat. Med. 14, 1370–1376 (2008). [DOI] [PubMed] [Google Scholar]
- 59.DerMardirossian C., Schnelzer A., Bokoch G. M., Phosphorylation of RhoGDI by Pak1 Mediates Dissociation of Rac GTPase. Mol. Cell 15, 117–127 (2004). [DOI] [PubMed] [Google Scholar]
- 60.Johnson J. L., et al. , An atlas of substrate specificities for the human serine/threonine kinome. Nat. 2023, 1–8 (2023). [DOI] [PMC free article] [PubMed] [Google Scholar]
- 61.Torrino S., et al. , The E3 ubiquitin-ligase HACE1 catalyzes the ubiquitylation of active Rac1. Dev. Cell 21, 959–965 (2011). [DOI] [PubMed] [Google Scholar]
- 62.Chiu T. T., Patel N., Shaw A. E., Bamburg J. R., Klip A., Arp2/3- and cofilin-coordinated actin dynamics is required for insulin-mediated GLUT4 translocation to the surface of muscle cells. Mol. Biol. Cell 21, 3529–3539 (2010). [DOI] [PMC free article] [PubMed] [Google Scholar]
Associated Data
This section collects any data citations, data availability statements, or supplementary materials included in this article.
Supplementary Materials
Appendix 01 (PDF)
Dataset S01 (XLSX)
Data Availability Statement
The authors confirm that the data supporting the findings of this study are available within the article and/or supporting information. The mass spectrometry proteomic dataset from the Flag-Rac1 interactome in L6 myoblasts is provided in Dataset S1.