Abstract
Aim
To evaluate and compare the performance of six dental age estimation methods (Moorrees, Fanning and Hunt, Demirjian, Gleiser and Hunt, Nolla, Chaillet et al., and Nicodemo et al.) on a sample of Saudi children.
Method
This cross-sectional study was based on the evaluation of a sample of 400 archived digital panoramic radiographs of healthy Saudi children (200 each from boys and girls) aged 6 to 15.99 years. Panoramic radiographs acquired during 2018–2021 were obtained from the information technology department of the dental clinics at King Saud University, Riyadh, Saudi Arabia. Dental age was evaluated using the six dental age estimation methods on the developing permanent dentition in both jaws of the left side. The accuracy of each method was assessed in relation to chronological age, and a comparison between these methods was made.
Result
For all the tested methods, significant differences were found between chronological and dental age (P<0.001). The mean difference between dental and chronological age was (-2.19 years) for Chaillet et al. method, (0.15 years) for the Demirjian method, (-1.01 years) for the Moorrees, Fanning and Hunt method, (-1.72 years) for Nicodemo et al. method, (-1.29 years) for Nolla method, and (-1.00 years) for Gleiser and Hunt method.
Conclusion
Among the tested methods, the accuracy in Saudi subjects was the highest for Demirjian’s method, followed by the Moorrees, Fanning and Hunt method. The methods proposed by Nicodemo et al., and Chaillet et al., were the least accurate.
Keywords: Age estimation,
Keywords: Saudi Arabia,
Keywords: Forensic odontology
INTRODUCTION
Age is determined by a person's date of birth and the amount of time or years elapsed from that date to any point in time and is termed chronological age (CA) (1). The CA can be estimated by determining the physiological age (1). Physiological age, also known as biological age, is based on the degree of maturation of different tissue systems. (2) Several biological ages have been developed, including skeletal, morphological, secondary sexual, and dental age (DA). (2)
DA is of particular interest to many scientific and clinical fields of application, including orthodontists and pediatric dentistry in choosing a timing and treatment plan, and in forensic dentistry, and pediatric endocrinology studies. (2) DA estimation is more reliable and genetically controlled than age estimation using skeletal indicators such as cervical vertebrae and hand-wrist bones. (3)
Additionally, DA can be determined by assessing tooth emergence or eruption in the oral cavity and observing the mineralization of developing teeth on radiographs. (4) Tooth mineralization is a more reliable indicator of dental maturity than emergence because it is not affected by factors such as ankylosis, early or delayed extraction of primary teeth, impaction, or crowding of permanent teeth. (2, 4)
Among all the methods used to estimate DA, such as visual, radiological, morphological, biochemical, and histological methods, the radiological method is a less invasive, simple, and reproducible and can be employed on both living and unknown dead. (5) Several radiological methods have been developed and studied to analyze dental mineralization as age indicator. The Demirjian method is the most widely used radiological method. Demirjian et al. (2) developed an eight-stage system in 1973 based on an analysis of French Canadian children. Chaillet et al. (6) obtained high accuracy in estimating DA in a Belgian population after adapting the Demirjian scores and using Belgian weighted scores. In 2005, Chaillet et al. (7) published international maturity curves for age estimation based on the evaluation of samples from eight different populations to overcome variations among different populations and use them when the ethnic origin of individuals is unknown. Nolla (8) created a DA system with 11 developmental stages, including tooth crypt staging, before the initial calcification.
Additionally, Gleiser and Hunt (9) devised a thirteen-stage system in 1955. Moorrees, Fanning, and Hunt (MFH) (4) evaluated dental development in 14 stages of mineralization, ranging from “cusp formation” to “root apex closure,” for the development of single and multirooted permanent teeth. In 1991, Smith (10) used MFH charts to develop tables showing the age at which each tooth reached each stage and a formula for age estimation, which made the MFH method easier to use. Nicodemo et al., in 1974 (11), provided a representative chart of the mineralization of all permanent teeth using eight developmental stages, with four stages each for the crown and the root.
Most DA estimation studies in the Saudi population have focused on the Demirjian method alone, and few studies have used and compared more than one method. Therefore, this study aimed to evaluate and compare the performance of six DA estimation methods that utilize the development of permanent teeth (MFH, Demirjian, Gleiser and Hunt, Nolla, Chaillet et al., and Nicodemo et al.) in a sample of Saudi children.
MATERIALS AND METHODS
Ethical Approval
The Institutional Review Board (E-21-6175) approved this study, followed by the approval of the College of Dentistry Research Center (PR 0124) at King Saud University.
Sample Selection And Size
This was a retrospective cross-sectional study involving children aged 6-15.99 years. Each chronological year was assigned to an individual group. A list of all Saudi patients aged (6–15.99 years) who had a panoramic radiograph acquired between 2018 and 2021 was obtained from the Information Technology department of the dental clinics at King Saud University. The inclusion and exclusion criteria were applied to the radiographs in reverse chronological order (from newest to oldest) until 400 cases were included. If a patient had multiple radiographs in the file, the oldest and most recent one that reflected the selection criteria were included.
The sample size was calculated for an effect size of 0.188 based on the Cohen equation and previous studies (12), at a level of significance of 0.05 and statistical power of 0.9. An analysis of variance (ANOVA) was performed for repeated measurements for ten age groups and the six methods, using GPower software. (13) The sample size in each age group was determined to be 40, which was subdivided into 20 boys and 20 girls; therefore, 400 digital panoramic radiographs (200 each from boys and girls) were used. The radiographs were initially assessed for the presence of radiographically visible exclusion criteria. The Salud file was then checked for other exclusion criteria in patients with acceptable radiographs. The radiographs were selected by ascending file number until each age group was completed.
Inclusion Criteria
The participants were selected following three main inclusion criteria: (1) Saudi patients, (2) children aged 6 to 15.99 years, and (3) presence of a panoramic radiograph in the Romexis server of the KSU College of Dentistry.
Exclusion Criteria
The exclusion criteria were as follows: (1) poor quality radiographs: the overlap of structures and presence of artifacts at the region of interest, (2) non-Saudi patients, (3) the presence of any systemic diseases or developmental conditions, (4) abnormal dental development including amelogenesis/dentinogenesis imperfecta, taurodontism, hypodontia, and hyperdontia, (5) presence of gross pathology related to the left side of the jaw or teeth, (6) presence of gross caries and periapical pathosis on the left side of the jaw, (7) presence of large restorations or crowns on the left side of the jaw, (8) early tooth extraction on the left side of the jaw, and (9) known previous orthodontic treatment.
Data Collection
Digital radiographs were analyzed with the naked eye for DA estimation. Planmeca Romexis 3.6.0.R software available at KSU was used. Each participant’s CA was calculated by subtracting the date of birth registered in the file from the date the radiograph was obtained and converted into a decimal system using the Eveleth and Tanner’s method. (14) The observer blinded the CA and entered them into a different spreadsheet until all 400 panoramic radiographs were assessed.
Each permanent tooth on the left side was evaluated to determine its developmental stage using the following methods: MFH (4), Nolla (8), Demirjian (2), Chaillet et al. (6), Gleiser and Hunt (15) and Nicodemo et al. (11)
Radiograph viewing conditions were standardized as follows:(1) if image adjustments had been made on the panoramic radiograph before data collection, all adjustments were undone; (2) viewing was done in a dimly-lit room; (3) the zoom level was standardized between methods; and (4) all age estimation methods were applied using the same contrast and density settings.
Statistical Analysis
All statistical analyses were performed using IBM SPSS Statistics for Windows version 28. The primary observer was trained and calibrated by a field expert. The main observer performed all measurements. To calculate the intra- and inter-examiner values, a 10% random sample of the digital radiographs was selected using random allocation software and re-evaluated after 2 weeks. Cohen’s kappa test was used to verify intra- and inter-observer agreements for all methods. (16)
The accuracy of each method was determined by the mean difference between DA and CA (bias). The DA was compared with the CA for each participant. The CA was subtracted from the DA, and a positive result indicated an overestimation, whereas a negative result indicated an underestimation. This difference and the absolute mean difference for each radiograph were tabulated. The absolute mean difference was used to assess the accuracy range by removing the canceling effect of equal, over, and underestimation. The standard deviation for each CA–year interval was also calculated. One-sample and paired t-tests were used to assess the accuracy of each method in each year interval for the entire sample.
An independent samples t-test was used to compare mean differences in CA and DA between the sexes. Repeated-measures ANOVA and post hoc analysis were used to compare DA and CA among five methods (excluding the Gleiser and Hunt method). The Bland–Altman plot was used to assess the agreement between each method and CA. Statistical significance was set at P<0.05.
RESULTS
Reliability Test
Intra-examiner Kappa values were 0.88 (MFH), 0.96 (Demirjian), 1.00 (Gleiser and Hunt), 0.97 (Nolla), 0.96 (Chaillet et al.), and 0.97 (Nicodemo et al.). For inter-examiner agreement, the Kappa values were 0.80 (MFH), 0.81 (Demirjian), 0.87 (Gleiser and Hunt), 0.78 (Nolla), 0.81 (Chaillet et al.), and 0.73 (Nicodemo et al.). These values are “substantial” or “almost perfect”. (16)
Description of Sample
A total of 400 digital radiographs were analyzed (200 each from boys and girls). All participants were divided into ten groups based on their CA and sex, with each group having an equal number of boys and girls (Table 1).
Table 1. Distribution of the study sample by chronological age (CA) and gender.
| Group | Chronological Age (CA)/years | Males No. | Females No. | Total |
|---|---|---|---|---|
| 1 | 6.00 – 6.99 | 20 | 20 | 40 |
| 2 | 7.00 – 7.99 | 20 | 20 | 40 |
| 3 | 8.00 – 8.99 | 20 | 20 | 40 |
| 4 | 9.00 – 9.99 | 20 | 20 | 40 |
| 5 | 10.00 – 10.99 | 20 | 20 | 40 |
| 6 | 11.00 – 11.99 | 20 | 20 | 40 |
| 7 | 12.00 – 12.99 | 20 | 20 | 40 |
| 8 | 13.00 – 13.99 | 20 | 20 | 40 |
| 9 | 14.00 – 14.99 | 20 | 20 | 40 |
| 10 | 15.00 – 15.99 | 20 | 20 | 40 |
| Total | 200 | 200 | 400 |
Accuracy of Each Method
The Chaillet et al. method underestimated CA by -2.03 years for boys and -2.35 years for girls (average, -2.19 years; P<0.001) (Tables 2 and 3) (Figs. 1, 2, and 3). The Chaillet et al. method underestimated the age of both sexes in all age groups (Table 4) (Fig. 4). A significant difference was found between boys and girls in the age groups of 12,13,14 and 15 years, where the mean difference was lower in boys than in girls (P=0.035, P=0.006, P<0.001, P<0.001, respectively) (Table 4).
Table 2. The accuracy of all methods for the entire sample expressed by Bias (the mean difference between dental age (DA) and chronological age (CA) in years) and the absolute mean difference between estimated and Real Age in years) using a one sample t-test.
| Method | Measure of Accuracy | Mean | SD | p-value | 95% C.I | |
|---|---|---|---|---|---|---|
| Lower | Upper | |||||
| Chaillet et al | Bias | -2.19 | 0.98 | <0.001 | -2.28 | -2.09 |
| Absolute difference | 2.22 | 0.89 | <0.001 | 2.14 | 2.31 | |
| Demirjian | Bias | 0.15 | 0.63 | <0.001 | 0.08 | 0.21 |
| Absolute difference | 0.49 | 0.43 | <0.001 | 0.44 | 0.53 | |
| Gleiser and Hunt | Bias | -1.00 | 1.20 | <0.001 | -1.15 | -0.85 |
| Absolute difference | 1.22 | 0.98 | <0.001 | 1.20 | 1.34 | |
| MFH | Bias | -1.01 | 0.82 | <0.001 | -1.09 | -0.93 |
| Absolute difference | 1.06 | 0.75 | <0.001 | 0.99 | 1.14 | |
| Nicodemo et al. | Bias | -1.72 | 1.86 | <0.001 | -1.91 | -1.54 |
| Absolute difference | 1.93 | 1.64 | <0.001 | 1.76 | 2.09 | |
| Nolla | Bias | -1.29 | 0.83 | <0.001 | -1.37 | -1.20 |
| Absolute difference | 1.31 | 0.78 | <0.001 | 1.24 | 1.39 | |
Table 3. The Accuracy for Males and Females.
| Method | Measure of Accuracy | Gender | Mean | SD | P-value |
|---|---|---|---|---|---|
| Chaillet et al. | Bias | Female | -2.35 | 1.16 | 0.002 |
| Male | -2.03 | 0.74 | |||
| Absolute difference | Female | 2.42 | 0.98 | <0.001 | |
| Male | 2.02 | 0.74 | |||
| Demirjian | Bias | Female | 0.11 | 0.65 | 0.219 |
| Male | 0.18 | 0.61 | |||
| Absolute difference | Female | 0.49 | 0.44 | 0.838 | |
| Male | 0.48 | 0.42 | |||
| Gleiser and Hunt | Bias | Female | -1.16 | 1.19 | 0.042 |
| Male | -0.84 | 1.20 | |||
| Absolute difference | Female | 1.31 | 0.02 | 0.162 | |
| Male | 1.13 | 0.93 | |||
| MFH | Bias | Female | -1.14 | 0.85 | 0.001 |
| Male | -0.88 | 0.76 | |||
| Absolute difference | Female | 1.18 | 0.79 | 0.001 | |
| Male | 0.94 | 0.68 | |||
| Nicodemo et al. | Bias | Female | -1.65 | 1.87 | 0.401 |
| Male | -1.80 | 1.85 | |||
| Absolute difference | Female | 1.88 | 1.63 | 0.579 | |
| Male | 1.97 | 1.66 | |||
| Nolla | Bias | Female | -1.50 | 0.89 | <0.001 |
| Male | -1.07 | 0.70 | |||
| Absolute difference | Female | 1.53 | 0.84 | <0.001 | |
| Male | 1.10 | 0.66 |
Figure 1.
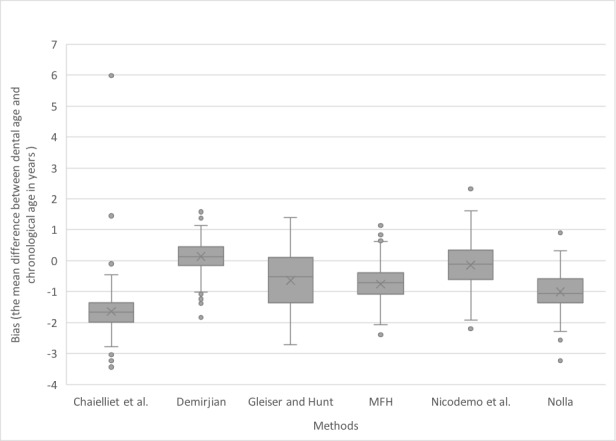
Box plot for the bias observed for each method
Figure 2.
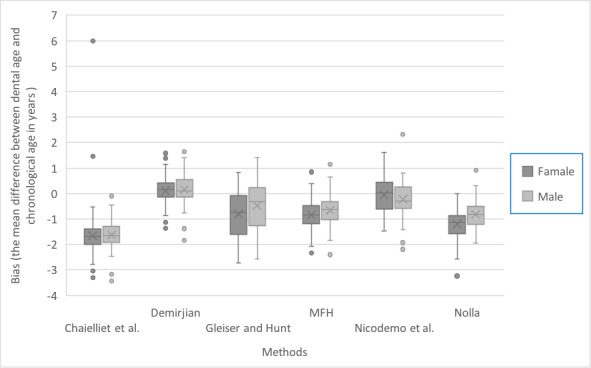
Box plot for the bias observed for each method stratified by sex
Figure 3.
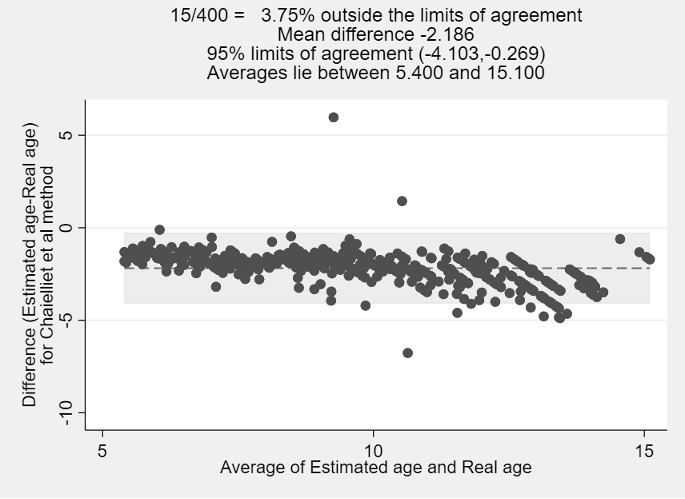
Bland-Altman plot the real age and estimated age for Chaillet et al. method
Table 4. The accuracy of Age Intervals of all methods for Males and females.
| Categorical age midpoint | Method | Gender | N | Mean | SD | P-value | 95% C.I | ||
|---|---|---|---|---|---|---|---|---|---|
| Lower | Upper | ||||||||
| 6.5 | Chaillet et al. | Female | 20 | -1.10 | 1.69 | 0.764 | -0.66 | 0.90 | |
| Male | 20 | -1.22 | 0.36 | ||||||
| Demirjian | Female | 20 | 0.43 | 0.26 | 0.178 | -0.33 | 0.06 | ||
| Male | 20 | 0.56 | 0.35 | ||||||
| Gleiser and Hunt | Female | 20 | 0.08 | 0.38 | 0.010 | -0.69 | -0.10 | ||
| Male | 20 | 0.48 | 0.53 | ||||||
| MFH | Female | 20 | -0.57 | 0.36 | 0.165 | -0.45 | 0.08 | ||
| Male | 20 | -0.38 | 0.46 | ||||||
| Nicodemo et al. | Female | 20 | 0.55 | 0.40 | 0.672 | -0.25 | 0.38 | ||
| Male | 20 | 0.48 | 0.57 | ||||||
| Nolla | Female | 20 | -0.90 | 0.42 | 0.001 | -0.76 | -0.20 | ||
| Male | 20 | -0.42 | 0.45 | ||||||
| 7.5 | Chaillet et al. | Female | 20 | -1.62 | 0.41 | 0.857 | -0.28 | 0.23 | |
| Male | 20 | -1.60 | 0.39 | ||||||
| Demirjian | Female | 20 | 0.14 | 0.35 | 0.856 | -0.20 | 0.24 | ||
| Male | 20 | 0.12 | 0.32 | ||||||
| Gleiser and Hunt | Female | 20 | -0.02 | 0.64 | 0.311 | -0.53 | 0.17 | ||
| Male | 20 | 0.16 | 0.43 | ||||||
| MFH | Female | 20 | -0.68 | 0.58 | 0.687 | -0.41 | 0.27 | ||
| Male | 20 | -0.61 | 0.49 | ||||||
| Nicodemo et al. | Female | 20 | 0.39 | 0.43 | 0.048 | 0.00 | 0.55 | ||
| Male | 20 | 0.11 | 0.43 | ||||||
| Nolla | Female | 20 | -1.08 | 0.47 | 0.071 | -0.60 | 0.03 | ||
| Male | 20 | -0.80 | 0.50 | ||||||
| 8.5 | Chaillet et al. | Female | 20 | -1.87 | 0.33 | 0.751 | -0.34 | 0.25 | |
| Male | 20 | -1.83 | 0.57 | ||||||
| Demirjian | Female | 20 | -0.19 | 0.41 | 0.290 | -0.45 | 0.14 | ||
| Male | 20 | -0.03 | 0.50 | ||||||
| Gleiser and Hunt | Female | 20 | -0.65 | 0.32 | <0.001 | -0.72 | -0.24 | ||
| Male | 20 | -0.16 | 0.43 | ||||||
| MFH | Female | 20 | -0.89 | 0.39 | 0.095 | -0.58 | 0.05 | ||
| Male | 20 | -0.62 | 0.57 | ||||||
| Nicodemo et al. | Female | 20 | -0.01 | 0.42 | 0.311 | -0.12 | 0.36 | ||
| Male | 20 | -0.13 | 0.33 | ||||||
| Nolla | Female | 20 | -1.44 | 0.40 | <0.001 | -0.84 | -0.23 | ||
| Male | 20 | -0.90 | 0.53 | ||||||
| 9.5 | Chaillet et al. | Female | 20 | -1.63 | 0.90 | 0.870 | -0.48 | 0.41 | |
| Male | 20 | -1.60 | 0.38 | ||||||
| Demirjian | Female | 20 | 0.03 | 0.62 | 0.808 | -0.40 | 0.32 | ||
| Male | 20 | 0.08 | 0.49 | ||||||
| Gleiser and Hunt | Female | 20 | -1.36 | 0.55 | 0.016 | -0.63 | -0.07 | ||
| Male | 20 | -1.01 | 0.26 | ||||||
| MFH | Female | 20 | -0.96 | 0.52 | 0.239 | -0.50 | 0.13 | ||
| Male | 20 | -0.78 | 0.46 | ||||||
| Nicodemo et al. | Female | 20 | -0.34 | 0.40 | 0.088 | -0.03 | 0.41 | ||
| Male | 20 | -0.53 | 0.25 | ||||||
| Nolla | Female | 20 | -1.08 | 0.58 | 0.176 | -0.57 | 0.08 | ||
| Male | 20 | -0.84 | 0.41 | ||||||
| 10.5 | Chaillet et al. | Female | 20 | -2.03 | 0.63 | 0.477 | -0.52 | 0.25 | |
| Male | 20 | -1.90 | 0.56 | ||||||
| Demirjian | Female | 20 | 0.15 | 0.83 | 0.634 | -0.39 | 0.64 | ||
| Male | 20 | 0.03 | 0.79 | ||||||
| Gleiser and Hunt | Female | 20 | -2.05 | 0.40 | 0.155 | -0.43 | 0.07 | ||
| Male | 20 | -1.87 | 0.38 | ||||||
| MFH | Female | 20 | -1.14 | 0.73 | 0.321 | -0.70 | 0.24 | ||
| Male | 20 | -0.91 | 0.73 | ||||||
| Nicodemo et al. | Female | 20 | -0.89 | 0.38 | 0.094 | -0.04 | 0.48 | ||
| Male | 20 | -1.11 | 0.43 | ||||||
| Nolla | Female | 20 | -1.47 | 0.70 | 0.083 | -0.74 | 0.05 | ||
| Male | 20 | -1.12 | 0.53 | ||||||
| 11.5 | Chaillet et al. | Female | 20 | -2.27 | 0.57 | 0.469 | -0.55 | 0.26 | |
| Male | 20 | -2.12 | 0.68 | ||||||
| Demirjian | Female | 20 | 0.36 | 0.96 | 0.422 | -0.37 | 0.85 | ||
| Male | 20 | 0.12 | 0.95 | ||||||
| Gleiser and Hunt | Female | 20 | -2.96 | 0.31 | 0.002 | -0.50 | -0.11 | ||
| Male | 20 | -2.66 | 0.30 | ||||||
| MFH | Female | 20 | -1.13 | 0.81 | 0.342 | -0.77 | 0.27 | ||
| Male | 20 | -0.88 | 0.82 | ||||||
| Nicodemo et al. | Female | 20 | -1.62 | 0.29 | 0.151 | -0.06 | 0.37 | ||
| Male | 20 | -1.77 | 0.37 | ||||||
| Nolla | Female | 20 | -2.02 | 0.88 | 0.012 | -1.18 | -0.16 | ||
| Male | 20 | -1.35 | 0.71 | ||||||
| 12.5 | Chaillet et al. | Female | 20 | -2.47 | 0.51 | 0.035 | -0.67 | -0.03 | |
| Male | 20 | -2.12 | 0.50 | ||||||
| Demirjian | Female | 20 | 0.52 | 0.63 | 0.315 | -0.19 | 0.57 | ||
| Male | 20 | 0.33 | 0.54 | ||||||
| MFH | Female | 20 | -1.32 | 0.65 | 0.054 | -0.90 | 0.01 | ||
| Male | 20 | -0.87 | 0.77 | ||||||
| Nicodemo et al. | Female | 20 | -2.37 | 0.34 | 0.113 | -0.04 | 0.36 | ||
| Male | 20 | -2.53 | 0.29 | ||||||
| Nolla | Female | 20 | -1.90 | 0.96 | 0.079 | -0.95 | 0.05 | ||
| Male | 20 | -1.45 | 0.57 | ||||||
| 13.5 | Chaillet et al. | Female | 20 | -3.04 | 0.51 | 0.006 | -0.93 | -0.09 | |
| Male | 20 | -2.48 | 0.77 | ||||||
| Demirjian | Female | 20 | 0.09 | 0.39 | 0.772 | -0.48 | 0.36 | ||
| Male | 20 | 0.15 | 0.85 | ||||||
| MFH | Female | 20 | -1.67 | 0.61 | 0.121 | -0.95 | 0.12 | ||
| Male | 20 | -1.26 | 0.99 | ||||||
| Nicodemo et al. | Female | 20 | -3.21 | 0.29 | 0.147 | -0.05 | 0.34 | ||
| Male | 20 | -3.35 | 0.32 | ||||||
| Nolla | Female | 20 | -2.00 | 0.78 | 0.209 | -0.96 | 0.22 | ||
| Male | 20 | -1.63 | 1.04 | ||||||
| 14.5 | Chaillet et al. | Female | 20 | -3.48 | 0.84 | <0.001 | -1.38 | -0.46 | |
| Male | 20 | -2.56 | 0.58 | ||||||
| Demirjian | Female | 20 | 0.04 | 0.47 | 0.080 | -0.60 | 0.04 | ||
| Male | 20 | 0.32 | 0.52 | ||||||
| MFH | Female | 20 | -1.57 | 1.00 | 0.115 | -0.95 | 0.11 | ||
| Male | 20 | -1.14 | 0.60 | ||||||
| Nicodemo et al. | Female | 20 | -3.99 | 0.27 | 0.084 | -0.02 | 0.34 | ||
| Male | 20 | -4.15 | 0.30 | ||||||
| Nolla | Female | 20 | -1.68 | 0.89 | 0.009 | -1.07 | -0.17 | ||
| Male | 20 | -1.06 | 0.46 | ||||||
| 15.5 | Chaillet et al. | Female | 20 | -4.00 | 0.49 | <0.001 | -1.60 | -0.76 | |
| Male | 20 | -2.82 | 0.80 | ||||||
| Demirjian | Female | 20 | -0.50 | 0.67 | <0.001 | -1.02 | -0.33 | ||
| Male | 20 | 0.18 | 0.37 | ||||||
| MFH | Female | 20 | -1.50 | 1.52 | 0.719 | -0.99 | 0.69 | ||
| Male | 20 | -1.35 | 1.04 | ||||||
| Nicodemo et al. | Female | 20 | -4.97 | 0.26 | 0.406 | -0.09 | 0.22 | ||
| Male | 20 | -5.04 | 0.22 | ||||||
| Nolla | Female | 20 | -1.44 | 1.48 | 0.409 | -1.09 | 0.46 | ||
| Male | 20 | -1.12 | 0.82 | ||||||
Figure 4.
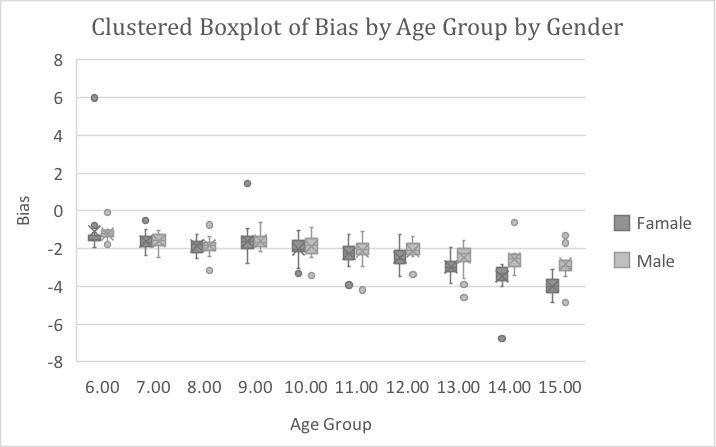
Box plot for the bias of Chaillet et al method stratified by sex and age
The Demirjian method overestimated CA by 0.18 years for boys and 0.11 years for girls (average, 0.15 years; P<0.001) (Tables 2 and 3) (Figs.1, 2 and 5). Overestimations were significant for the age groups of 6, 7, 12, and 14 years (P<0.001, P=0.034, P<0.001, and P=0.018, respectively). The Demirjian method overestimated CA for both sexes in all age groups, except for boys aged 8 years and girls aged 8 and 15 years, for whom an underestimation was observed (Table 4) (Fig.6). A significant difference was only found between boys and girls in the age group of 15 years, where the mean difference was lower in boys than in girls (P<0.001) (Table 4).
Figure 5.
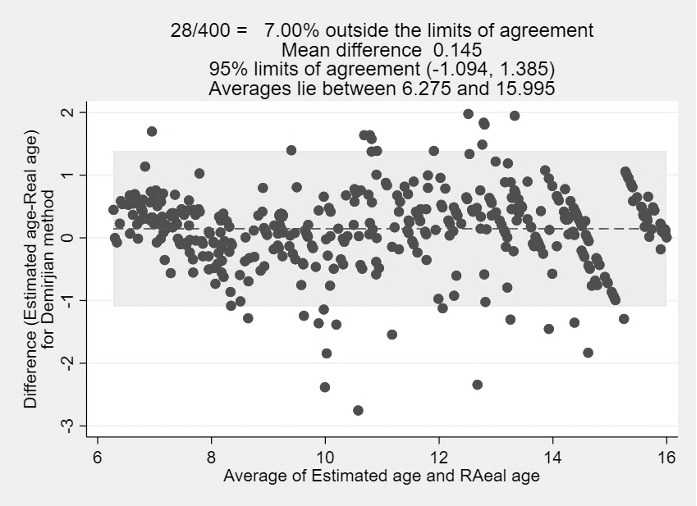
Bland-Altman plot the real age and estimated age for Demirjian method
Figure 6.
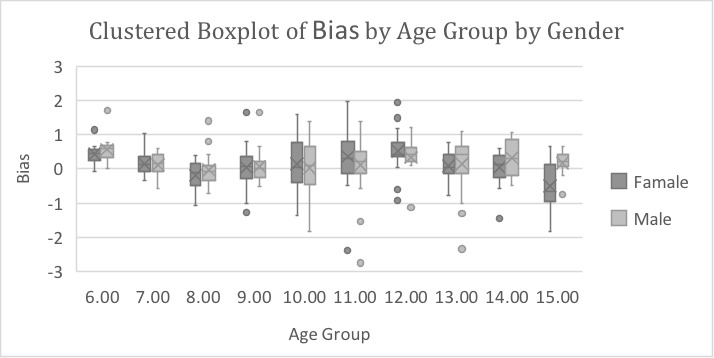
Box plot for the bias of Demirjian method stratified by sex and age
The MFH method also underestimated age by -0.88 years for boys and -1.14 years for girls (average, -1.01 years; P<0.001) (Tables 2 and 3) (Figs. 1,2 and 7). Underestimations were observed for both sexes in all age groups (Table 4) (Fig.8).
Figure 7.
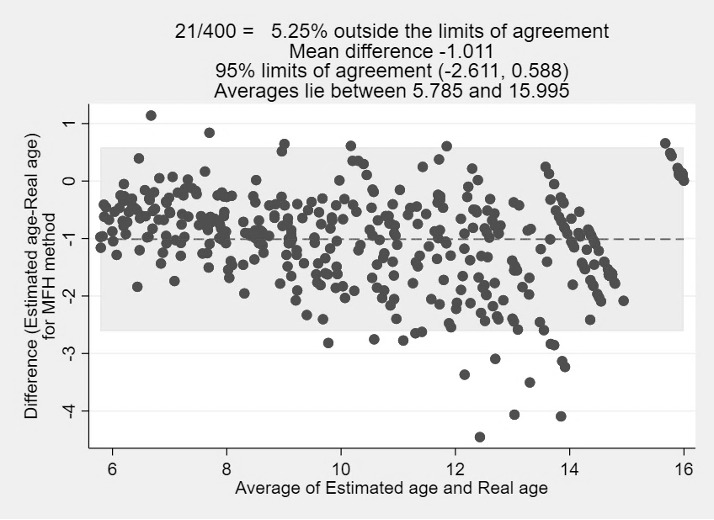
Bland-Altman plot the real age and estimated age for MFH method
Figure 8.
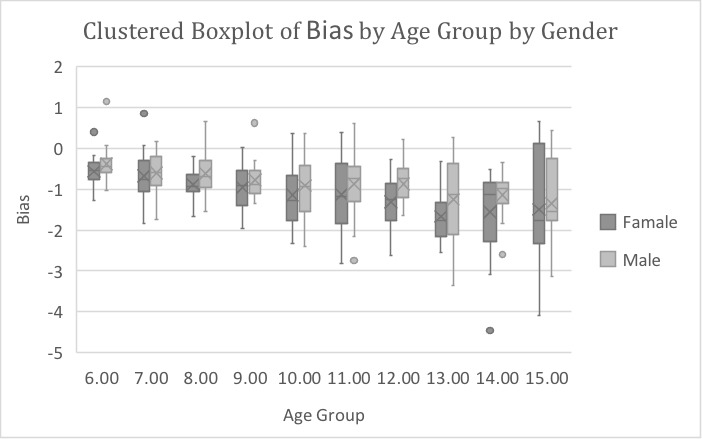
Box plot for the bias of MFH method stratified by sex and age
The Nicodemo et al. method underestimated CA by -1.80 years for boys and -1.65 years for girls (average, -1.72 years; P<0.001) (Tables 2 and 3) (Figs.1,2, and 9).
Figure 9.
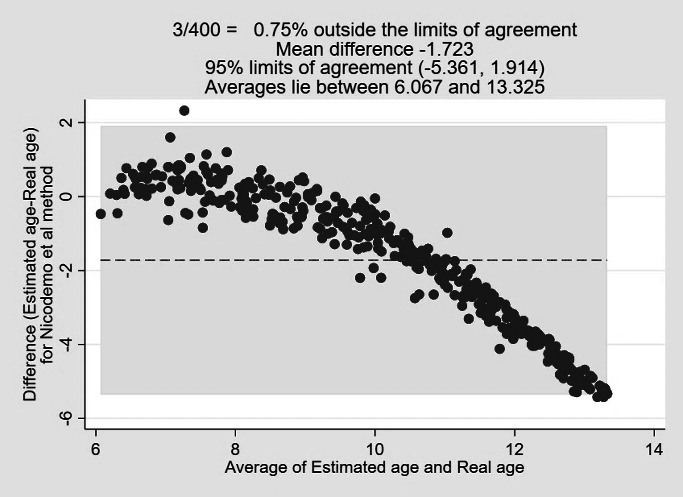
Bland-Altman plot the real age and estimated age for Nicodemo et al method
Underestimations were significant for the age groups of 9, 10, 11, 12, 13, 14, and 15 years (P<0.001). However, age was significantly overestimated in the age groups of 6 and 7 years (P≤0.001, P=0.001,respectively). A significant difference was found between boys and girls in the age group of 7 years, where the mean difference was lower in boys than in girls (P=0.048) (Table 4) (Fig.10).
Figure 10.
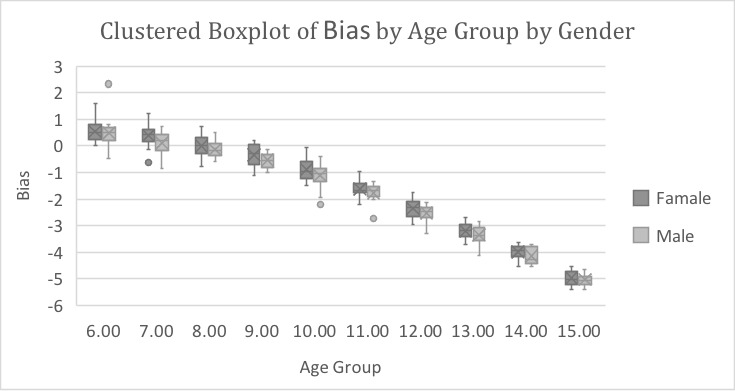
Box plot for the bias of Nicodemo et al. method stratified by sex and age
The Nolla method underestimated CA by -1.07 years for boys and -1.50 years for girls (average, -1.29 years; P<0.001) (Tables 2 and 3) (Figs. 1, 2 and 11). The Nolla method underestimated CA for both sexes in all age groups (Table 4) (Fig.12). A significant difference was found between boys and girls of age groups 6, 8, 11, and 14 years, where the mean difference was lower in boys than in girls (P=0.001, P<0.001, P=0.012, respectively). P=0.009, respectively) (Table 4).
Figure 11.
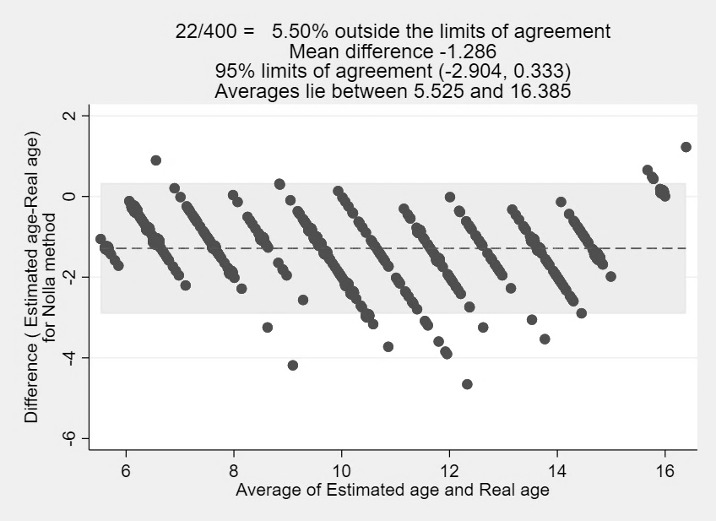
Bland-Altman plot the real age and estimated age for Nolla method
Figure 12.
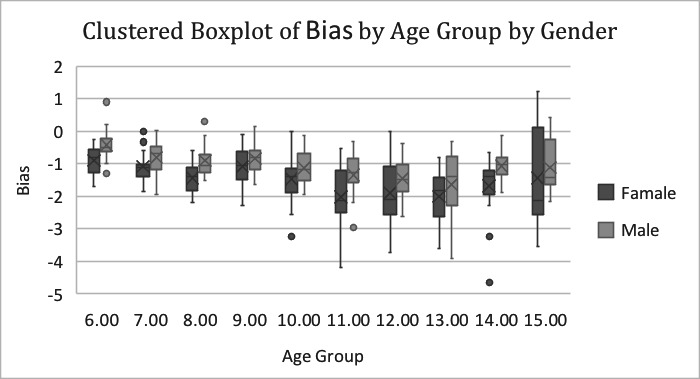
Box plot for the bias of Nolla method stratified by sex and age
The Gleiser and Hunt method underestimated CA by -0.84 years for boys and -1.16 years for girls (average, -1.00 years; P<0.001) (Tables 2 and 3) (Figs. 1, 2, and 13). The Gleiser and Hunt method underestimated CA for both sexes in all age groups, except for boys aged 6 and 7 years and girls aged 6 years, for whom an overestimation was found (Table 4) (Fig. 14). A significant difference was found between boys and girls of age groups 6, 8, and 9 years, where the mean difference was lower in girls aged 6 years and lower in boys aged 8 and 9 years (P=0.010, P<0.001, P=0.016, respectively) (Table 4).
Figure 13.
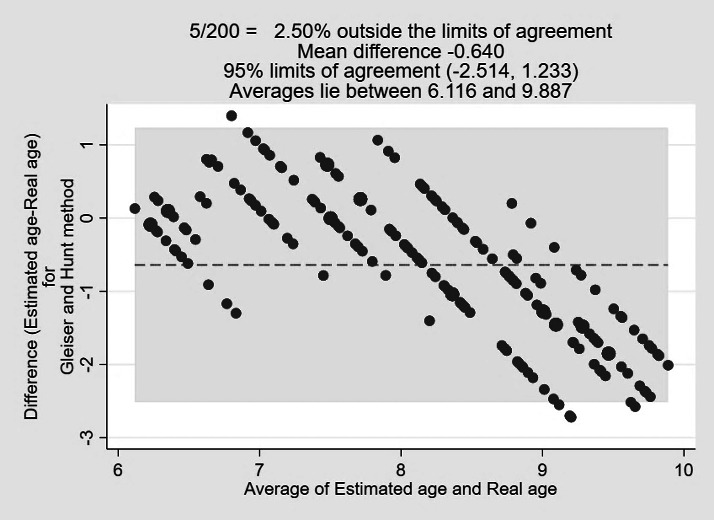
Bland-Altman plot the real age and estimated age for Gleiser and Hunt method
Figure 14.
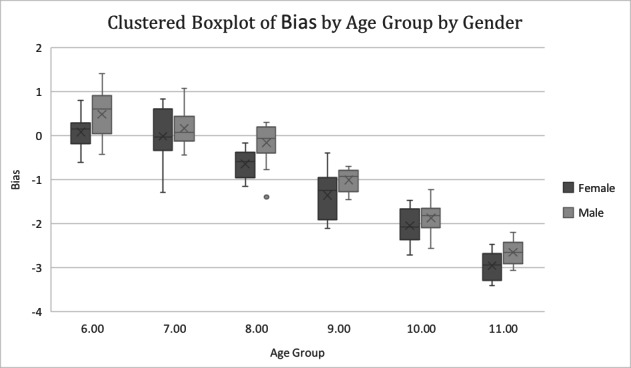
Box plot for the bias of Gleiser and Hunt stratified by sex and age
Comparison of Bias Between Different Methods
Significant differences in bias were found among the different methods. Post-hoc comparisons showed that there was a statistically significant difference in bias between all methods (P<0.001) (Table 5).
Table 5. Comparison of bias between different methods.
| Mean bias | SD | 95% C.I | P-value | ||
|---|---|---|---|---|---|
| Lower Bound | Upper Bound | ||||
| Chaillet et al. | -2.19 | 0.98 | -2.28 | -2.09 | <0.001 |
| Demirjian | 0.15 | 0.63 | 0.08 | 0.21 | |
| MFH | -1.01 | 0.82 | -1.09 | -0.93 | |
| Nicodemo et al. | -1.72 | 1.86 | -1.91 | -1.54 | |
| Nolla | -1.29 | 0.83 | -1.37 | -1.20 | |
* The Gleiser and Hunt method was excluded from this comparison because all statistical analysis for this method was performed when the chronological age of subjects was ≤ 11.99, resulting in missing data above this age.
DISCUSSION
Age estimation is important in both forensic science and clinical practice. Knowing age could be helpful in several legal cases where it is necessary to differentiate a juvenile from an adult, cases of illegal immigration, and wrongly reported or manipulated ages in documents. According to the recommendations of the Study Group on Forensic Age Diagnostics, a forensic age estimate should consist of a physical examination, radiograph of the hand, and dental examination, including evaluation of a panoramic radiograph, if available. (17)
Dental maturation and emergence through the gingiva have long been recognized as the most useful criteria for estimating age. This approach is more favorable because teeth are less affected by environmental factors and hormonal disturbances than bones, and most techniques used are less invasive and simple to use (18). Many methods have been developed, providing results with various levels of accuracy and using different statistical procedures for age estimation based on tooth development in children and adolescents. (19)
Accuracy and precision are essential in DA assessment. Accuracy refers to the proximity of DA to CA. (20) We presented accuracy as the mean difference between DA and CA (bias) and the absolute mean difference between DA and CA. When assessing DA, it is essential to consider the precision of the age estimation method. Precision, also called reliability, is used in intra- and inter-observer reproducibility (21). The choice of tooth stage assessment is an important factor influencing reproducibility. Those described by Nicodemo et al. are the least detailed, thus showing lower precision in this study. The previous finding of lower precision for the Nolla’s method was not observed in this study (22, 23), probably because the addition of fractions to the Nolla score (0.2, 0.5, and 0.7) was not considered in the DA estimation. This was done because an increased number of stages in the Nolla method has been suggested to moderately decrease its precision while complicating the assessment and making it more subjective. (22) Moreover, in the present study, one examiner tested the performance of all the methods with almost perfect intra-examiner kappa values. One examiner controlled for errors attributable to inter-examiner differences.
The Demirjian Method:
The Demirjian method has been tested and applied to different populations for several years. It has been found to consistently overestimate age in various populations such as Croatia, Brazil, France, Italy, Kuwait, North Germany, Northern China, Portugal, Romania, South America, Spain, Sri Lanka and Turkey. (24–33) Liversidge et al. believed that the overestimation of DA in recent findings when Demirjian’s method was used in different populations may be partly explained by a positive secular trend in growth and development during the last 25 years. (36)
In contrast, in Eastern China, underestimation was generally demonstrated in boys and girls, except for the age group of 13–14.99 years in boys and 11–14.99 years in girls. (37) Additionally, Cruz-Landeira et al. reported an underestimation of age using this method in a Venezuelan Amerindian sample; however, they suggested that this finding may be due to the small sample size and ethnic origin of their sample. (38)
In Saudi Arabia, a study assessing DA in Riyadh in children between the ages of 8.5 to 17 years found an overestimation of 0.3 years for boys and 0.4 years for girls (39). Similar results were reported in Saudi children aged 4 to 14 years; however, the overestimation was 0.77 years for boys and 0.83 years for girls. (40) A study performed by Alshihri et al. in the Western Saudi Arabian population concluded that girls are 0.059 ± 1.26 years and boys are 0.66 ± 1.14 years ahead of the French‐Canadian children. (41) Alassiry et al. found that, in a sample of 298 Saudi children and adolescents between the ages of 3 and 15 years, the mean difference between DA and CA was 0.50 ± 1.57 years. The difference was 0.57 ± 1.48 years in boys and 0.44 ± 1.66 years in girls. (42)
In this study, Demirjian's method overestimated CA, consistent with the results of previous studies. The overestimation was more pronounced for the age groups of 6, 7, 12, and 14 years. The only underestimation was for the age groups of 8 and 15 years. The underestimation found in the age group of 15 years was similar to the results reported by Urzel and Bruzek. They explained that most children had reached a total maturity score of 100 and that no further scoring could be performed. (30)
The Nolla Method:
The Nolla method provided mixed results for various populations. When tested on Turkish children, Nolla’s method reported an underestimation of CA, with the mean age differences being -0.003 years for boys and -0.32 years for girls. (27) Maber et al. reported similar results of underestimation of CA by –0.87 years for boys and –1.18 years for girls in their study on 3–16.99 years old children of Bangladesh and British Caucasian ethnic origin (22). Hegde et al. reported a mean difference of -0.13 ± 0.80 years for boys and -0.30 ± 0.82 years for girls in Indian children aged 5 to 15 years. (23) Underestimations have also been found in South American, Portuguese, and Spanish populations. (31, 32)
However, overestimation of CA has also been reported in studies on Malaysian and south Indian populations. (43, 44) Moreover, in the Chinese population, overestimation and underestimation were observed in boys and girls, respectively. (26) In contrast to other studies, Nolla’s method was suitable for estimating CA of Brazilian children with due care, considering that the growth spurt commences at approximately 11 and 12 years. (33)
For the Saudi population, Yassin et al. reported that Nolla’s method underestimated CA in all age groups and both sexes, with an age difference of –2.68 months to –6 months in boys and –2.17 months to –4.24 months in girls. (45) This was similar to our study, where an underestimation was found in all age groups and sexes; however, the difference was more pronounced. The probable reason for these higher age differences in our results could be the different utilization of the method by not adding fractions to the staged scores of mineralization for each tooth.
The MFH method:
The MFH method underestimated CA in this study in all age groups and sexes, consistent with the results of several studies conducted in different populations. A study performed by Martínez GVM et al. in the Venezuela population found consistent age underestimation in all groups and sexes, with the variation ranging from 0.20 ± 1.14 to 7.61 ± 0.231 years. (32) Similar results were reported in three samples of South African children aged 3–16 years. (46)
Additionally, when tested on Mangalorean children, the MFH method significantly underestimated CA, with mean age differences of -3 years for boys and -2.9 years for girls. (47) Underestimation was also found in Kuwaiti children aged 5 to 15 years, with mean age differences of 1.01 years for girls and 0.89 years for boys (48). In a sample of American Caucasian children aged from 9 to 14 years, the MFH method underestimated CA by 2.3 years for girls and 1.9 years for boys. (49)
Contrary to other studies, Corral et al. concluded that the MFH method presented a high correlation coefficient between DA and CA, with a tendency to overestimate CA of Colombian children aged 5–16 years. (50) Although the MFH method has been tested in different populations, a literature search revealed that none of the studies had tested the accuracy of the MFH method for DA assessment in the Saudi population.
The Chaillet method:
In this study, Chaillet’s original standards for Belgian children were used; to obtain an increase in reliability, the 95th percentile of dental maturity was used to calculate DA.
Studies testing the Chaillet’s multi-ethnic international maturity standards method have reported overestimations of 0.28±0.90 and 0.37±1.04 years in boys and (0.09 ± 0.83) and (0.21± 1.07) years in girls of Bosnian-Herzegovinian and Spanish Caucasian populations, respectively. (38) However, underestimation has been reported in several populations, such as Venezuelan, Indians using Chaillet’s original standards for Belgian children and Kosovar populations. (30, 38, 51, 52)
In the present study, the underestimations were higher than those reported in previous studies that used Chaillet’s original standards for Belgian children. This difference between our results and those of the previous studies may be attributed to the 95% percentile being considered in this study. The higher the considered percentile level, the stronger the reliability, and the accuracy decreases as the reliability increases. (7)
The Gleiser and Hunt method:
In this method, age estimation uses the calcification of the permanent mandibular first molar only. In our study, all statistical analyses using the Gleiser and Hunt method were performed when the CA was ≤ 11.99 years. Because DA estimation is limited by tooth maturation, the mandibular first molar achieves its final maturation at 11 years. (53) Unlike the present study, previous studies tested the applicability of the Gleiser and Hunt dental staging system modified by Kohler on the second and third molars. (54, 55) Therefore, comparisons could not be made.
In this study, the Gleiser and Hunt method underestimated CA in both sexes, except for the age groups of 6 and 7 years, for which overestimations were obtained.
The Nicodemo et al. method:
The method proposed by Nicodemo et al. consistently underestimates age in various populations. When tested on Indian children, Nicodemo et al. reported an underestimation of CA for both sexes, and the differences were more pronounced in older groups (56). Kurita et al. and Silva et al. reported similar results of CA underestimation in their studies on the Brazilian population. (57, 58)
Our results are in accordance with previously published studies, where the Nicodemo et al. method underestimated CA for both sexes. Underestimations were also more pronounced in the older age groups. The only overestimation was for the age groups of 6 and 7 years.
Comparison between the methods:
Chaillet et al. considered a 1-year accuracy sufficient in forensic anthropology, whereas McKenna et al. commended ±0.5 years as more acceptable. (59, 60) An age estimation method is considered accurate if it predicts CA as closely as possible. In our study, the most accurate method was the Demirjian’s method, followed by the MFH method, whereas the Nicodemo et al. and Chaillet et al. methods were the least accurate. Moreover, repeated measures ANOVA verified the significant differences among the tested methods.
Most studies on DA estimation have compared only two different methods; few have studied the accuracy of six different methods simultaneously. Kelmendi et al. evaluated the accuracy of four Demirjian, Chaillet, and Willems methods for age estimation in Kosovo children. Their results indicated that the Demirjian method from 1973 was the least accurate among the six methods. (61) Kumaresan et al. tested the accuracy of five DA estimation methods (Demirjian, Willems, Nolla, Haavikko, and Cameriere) in 426 Malaysian children aged 5–15 years. The Demirjian method exhibited the lowest precision and accuracy among those tested. (44)
Several studies have compared the Demirjian and Nolla methods. Melo and Ata-Ali compared these two methods in a Spanish population and stated that both methods were accurate in estimating CA in a Spanish population, with an overestimation of age using the Demirjian method and an underestimation using the Nolla method. (62) Tomás et al. reported similar results for the Portuguese and Spanish samples. (31) Duruk et al. found that Nolla’s method was more accurate for CA estimation than Demirjian’s method in an Eastern Turkish population (27). Similar results were reported by Lopes et al. in Brazilian children aged 7–13 years. (33)
Additionally, Han et al. studied the accuracy of the Demirjian, Willems, and Nolla methods in a northern Chinese population. Among the three methods, the accuracy was the highest for the Nolla method. (26) However, Cortés et al. found that the Willems method was more appropriate when the three methods were tested in a Spanish ethnicity population. (63)
Additionally, Mohammed et al. concluded that Nolla’s method was more accurate in estimating DA in southern Indian children than Demirjian, Willems, and Haavikko’s methods. (43) Gutiérrez and Ortega-Pertuz studied the accuracy of three methods (Nolla, Moorrees et al. and Demirjian) in 512 Venezuelan children aged 6–18 years; their results indicated that the Demirjian method was the most accurate; whereas the Moorrees et al. method was the least accurate (32). In contrast, Tony et al. stated that neither the Demirjian nor the Moorrees et al. methods accurately estimated CA in their sample of contemporary American Caucasian children aged 9–14 years. (49)
Furthermore, Chaillet’s method was more appropriate for Spanish and Venezuelan children than the Demirjian method. (38) Nevertheless, Pinchi et al. found Willems and Demirjian methods as the most accurate, though they overestimated CA, compared to Cameriere and Haavikko's methods in the Italian population. (64)
The different results in various populations can be attributed to genetic variations, ethnicities, climate, and environmental factors, such as nutrition, dietary habits, and lifestyle, significantly influencing tooth development. Moreover, the uneven sample size of each age group may affect the accuracy of DA estimation. A previous finding that age can be more accurately predicted in younger children than in older children was observed in the present study for both sexes. This is mainly because more teeth continue to develop in this period, which can provide more information for DA estimation. For older age groups, most teeth had already completed their development; therefore, only a few teeth attributed to DA estimation, resulting in a large mean difference between DA and CA. Thus, DA estimation may be more accurate in studies with larger samples of younger patients.
Another possible reason could be age mimicry, a phenomenon in which the target population’s estimates tend to mimic the reference population’s age structure (the population upon which a method is based). (65) Liversidge et al. used this phenomenon to explain the poor performance of the MFH 1963 method in their study, which is one of the few radiographic studies from birth to the age of 25 years. (20)
Another explanation is the complexity of some of these methods. The methods of Demirjian, Chaillet, and Nolla involve a complex process of double numerical conversion. Additionally, not all maturity score values could be found in the conversion tables provided by Demirjian (1973), Chaillet (2004), and Nolla (1960); in these cases, we had to estimate the DA based on the closest smaller maturity score values, which might influence the accuracy of these methods. Moreover, the MFH method involves demanding steps for interpolating the attained values from the graphs, followed by calculating the predicted values from these interpolated values. The problem of inter-observer error in interpolation from graphs influences the accuracy of this method. However, the MFH method was more straightforward when the Smith tables were used.
One limitation of this study is that it was conducted in a geographically restricted sample. This study was conducted in Riyadh, Saudi Arabia and did not include other regions of Saudi Arabia. Hence, the results of this study cannot be generalized to the Saudi population. Further studies applying these methods to other Saudi Arabian regions would be beneficial. Additionally, computerized tools for calculating DA could be used instead of the classic method for a better workflow.
ACKNOWLEDGMENTS
The authors would like to thank the College of Dentistry at King Saud University, Riyadh, Saudi Arabia, for providing the facilities, equipment, and personnel that helped perform this research. This manuscript is part of a dissertation on DScDs by King Saud University in Riyadh, Saudi Arabia.
Footnotes
The authors declare that they have no conflict of interest.
REFERENCES
- 1.Adams C, Carabott R, Evans S. Forensic Odontology: An Essential Guide. Wiley; 2014. [Google Scholar]
- 2.Demirjian A, Goldstein H, Tanner JM. A new system of dental age assessment. Hum Biol. 1973;45(2):211–27. [PubMed] [Google Scholar]
- 3.Miklosi A, Miklósi Á. The genetic contribution to behaviour. Dog Behav Evol Cogn. 2015;76(7):346–68. [Google Scholar]
- 4.Moorrees CFA, Fanning EA, Hunt EE. Age variation of formation stages for ten permanent teeth. J Dent Res. 1963;42(6):1490–502. 10.1177/00220345630420062701 [DOI] [PubMed] [Google Scholar]
- 5.Uzuner FD, Kaygısız E, Darendeliler N. Defining dental age for chronological age determination. Post Mortem Examination and Autopsy - Current Issues From Death to Laboratory Analysis. 2018. [Google Scholar]
- 6.Chaillet N, Willems G, Demirjian A. Dental maturity in Belgian children using Demirjian’s method and polynomial functions: New standard curves for forensic and clinical use. J Forensic Odontostomatol. 2004;22(2):18–27. [PubMed] [Google Scholar]
- 7.Chaillet N, Nyström M, Demirjian A. Comparison of dental maturity in children of different ethnic origins: International maturity curves for clinicians. J Forensic Sci. 2005;50(5):1164–74. 10.1520/JFS2005020 [DOI] [PubMed] [Google Scholar]
- 8.Nolla CM. The development of the permanent teeth. ASDC J Dent Child. 1960;27:254–66. [Google Scholar]
- 9.Gleiser I, Hunt EE. The estimation of age and sex of preadolescent children from bones and teeth. Am J Phys Anthropol. 1955;13(2):253–83. 10.1002/ajpa.1330130206 [DOI] [PubMed] [Google Scholar]
- 10.Smith BH. Standards of human tooth formation and dental age assessment. Advances in Dental Anthropology. 1991. p. 143–68. [Google Scholar]
- 11.Nicodemo RA, de Moraes LC, Médici Filho E. Chronological table of mineralization of permanent teeth among Brazilians. Rev Fac Odontol Sao Jose Dos Campos. 1974;55–6. [cited 2020 February 26] Available from https://www.scirp.org/(S(351jmbntvnsjt1aadkposzje))/reference/ReferencesPapers.aspx?ReferenceID=869979 [Internet] [PubMed] [Google Scholar]
- 12.Alsudairi DM, AlQahtani SJ. Testing and comparing the accuracy of two dental age estimation methods on saudi children: Measurements of open apices in teeth and the London Atlas of Tooth Development. Forensic Sci Int. 2019;295:226.e1–9. [Internet] 10.1016/j.forsciint.2018.11.011 [DOI] [PubMed] [Google Scholar]
- 13.Mayr S, Erdfelder E, Buchner A, Faul F. A short tutorial of GPower. Tutor Quant Methods Psychol. 2007;3(2):51–9. 10.20982/tqmp.03.2.p051 [DOI] [Google Scholar]
- 14.Eveleth PB, Tanner JM. Worldwide Variation in Human Growth (Cambridge Studies in Biological & Evolutionary Anthropology). 2nd ed. Cambridge university; 1990. 397 p. [Google Scholar]
- 15.Gleiser I, Hunt EE. The permanent mandibular first molar : its calcification, eruption and decsy. Am J Phys Anthropol. 1955. 10.1002/ajpa.1330130206 [DOI] [PubMed] [Google Scholar]
- 16.McHugh ML. Lessons in biostatistics interrater reliability : the kappa statistic. Biochem Med (Zagreb). 2012;22(3):276–82. Available from https: hrcak.srce.hr/89395 [Internet] 10.11613/BM.2012.031 [DOI] [PMC free article] [PubMed] [Google Scholar]
- 17.Schmeling A, Olze A, Reisinger W, Geserick G. Forensic age diagnostics of living people undergoing criminal proceedings. Forensic Sci Int. 2004;144(2–3):243–5. 10.1016/j.forsciint.2004.04.059 [DOI] [PubMed] [Google Scholar]
- 18.Demirjian A, Buschang PH, Tanguay R, Patterson DK. Interrelationships among measures of somatic, skeletal, dental, and sexual maturity. Am J Orthod. 1985;88(5):433–8. 10.1016/0002-9416(85)90070-3 [DOI] [PubMed] [Google Scholar]
- 19.Cunha E, Baccino E, Martrille L, Ramsthaler F, Prieto J, Schuliar Y, et al. The problem of aging human remains and living individuals: A review. Forensic Sci Int. 2009;193(1–3):1–13. 10.1016/j.forsciint.2009.09.008 [DOI] [PubMed] [Google Scholar]
- 20.Liversidge HM, Smith BH, Maber M. Bias and accuracy of age estimation using developing teeth in 946 children. Am J Phys Anthropol. 2010;143(4):545–54. 10.1002/ajpa.21349 [DOI] [PubMed] [Google Scholar]
- 21.Ferrante L, Cameriere R. Statistical methods to assess the reliability of measurements in the procedures for forensic age estimation. Int J Legal Med. 2009;123(4):277–83. 10.1007/s00414-009-0349-4 [DOI] [PubMed] [Google Scholar]
- 22.Maber M, Liversidge HM, Hector MP. Accuracy of age estimation of radiographic methods using developing teeth. Forensic Sci Int. 2006;159(1):S68–73. 10.1016/j.forsciint.2006.02.019 [DOI] [PubMed] [Google Scholar]
- 23.Hegde S, Patodia A, Dixit U. A comparison of the validity of the Demirjian, Willems, Nolla and Häävikko methods in determination of chronological age of 5–15 year-old Indian children. J Forensic Leg Med. 2017;50:49–57. [Internet] 10.1016/j.jflm.2017.07.007 [DOI] [PubMed] [Google Scholar]
- 24.Bedek I. Applicability of the Demirjian, Willems and Haavikko methods in Croatian children. 2022;40. [PMC free article] [PubMed]
- 25.Moca AE, Ciavoi G, Todor BI, Negruțiu BM, Cuc EA, Dima R, et al. Validity of the Demirjian method for dental age estimation in Romanian children. Children (Basel). 2022;9(4):1–11. 10.3390/children9040567 [DOI] [PMC free article] [PubMed] [Google Scholar]
- 26.Han M qi, Jia S xuan, Wang CX, Chu G, Chen T, Zhou H, et al. Accuracy of the Demirjian, Willems and Nolla methods for dental age estimation in a northern Chinese population. Arch Oral Biol [Internet]. 2020;118(June):104875. Available from: 10.1016/j.archoralbio.2020.104875 10.1016/j.archoralbio.2020.104875 [DOI] [PubMed]
- 27.Duruk G, Ozdal TPG, Duman S. Accuracy of age estimation with Demirjian and Nolla methods in Eastern Turkish children aged 3-17 years old. Eur Oral Res. 2022;56(2):80–7. [DOI] [PMC free article] [PubMed] [Google Scholar]
- 28.Cameriere R, Ferrante L, Liversidge HM, Prieto JL, Brkic H. Accuracy of age estimation in children using radiograph of developing teeth. Forensic Sci Int. 2008;176(2–3):173–7. 10.1016/j.forsciint.2007.09.001 [DOI] [PubMed] [Google Scholar]
- 29.Qudeimat MA, Behbehani F. Dental age assessment for Kuwaiti children using Demirjian’s method. Ann Hum Biol. 2009;36(6):695–704. 10.3109/03014460902988702 [DOI] [PubMed] [Google Scholar]
- 30.Urzel V, Bruzek J. Dental age assessment in children: A comparison of four methods in a recent French population. J Forensic Sci. 2013;58(5):1341–7. 10.1111/1556-4029.12221 [DOI] [PubMed] [Google Scholar]
- 31.Tomás LF, Mónico LSM, Tomás I, Varela-Patiño P, Martin-Biedma B. The accuracy of estimating chronological age from Demirjian and Nolla methods in a Portuguese and Spanish sample. BMC Oral Health. 2014;14(1):160. 10.1186/1472-6831-14-160 [DOI] [PMC free article] [PubMed] [Google Scholar]
- 32.Gutiérrez V, Ortega-Pertuz A. Comparison of Nolla, Demirjian and Moorrees methods for dental age calculation for forensic purposes. Rev Mex Ortod. 2017;21(3):151–9. 10.1016/j.rodmex.2017.09.011 [DOI] [Google Scholar]
- 33.Lopes LJ, Nascimento HAR, Lima GP, dos Santos LAN, Queluz D de P, Freitas DQ. Dental age assessment: Which is the most applicable method? Forensic Sci Int. 2018;284:97–100. [Internet] 10.1016/j.forsciint.2017.12.044 [DOI] [PubMed] [Google Scholar]
- 34.Khdairi N, Halilah T, Khandakji MN, Jost-Brinkmann PG, Bartzela T. The adaptation of Demirjian’s dental age estimation method on North German children. Forensic Sci Int. 2019;303:109927. [Internet] 10.1016/j.forsciint.2019.109927 [DOI] [PubMed] [Google Scholar]
- 35.Ranasinghe S, Perera J, Taylor JA, Tennakoon A, Pallewatte A, Jayasinghe R. Dental age estimation using radiographs: Towards the best method for Sri Lankan children. Forensic Sci Int. 2019;298:64–70. [Internet] 10.1016/j.forsciint.2019.02.053 [DOI] [PubMed] [Google Scholar]
- 36.Liversidge HM. Dental maturation in British children: are Demirjian’s standards applicable? Int J Paediatr Dent. 1999;9(4):263. [DOI] [PubMed] [Google Scholar]
- 37.Wang J, Bai X, Wang M, Zhou Z, Bian X, Qiu C, et al. Applicability and accuracy of Demirjian and Willems methods in a population of Eastern Chinese subadults. Forensic Sci Int. 2018;292:90–6. [Internet] 10.1016/j.forsciint.2018.09.006 [DOI] [PubMed] [Google Scholar]
- 38.Cruz-Landeira A, Linares-Argote J, Martínez-Rodríguez M, Rodríguez-Calvo MS, Otero XL, Concheiro L. Dental age estimation in Spanish and Venezuelan children. Comparison of Demirjian and Chaillet’s scores. Int J Legal Med. 2010;124(2):105–12. 10.1007/s00414-009-0380-5 [DOI] [PubMed] [Google Scholar]
- 39.Al-Emran S. Dental age assessment of 8. 5 to 17 year-old Saudi children using Demirjian ’ s method. J Contemp Dent Pract. 2008;9(3):64–71. 10.5005/jcdp-9-3-64 [DOI] [PubMed] [Google Scholar]
- 40.Baghdadi ZD. Dental maturity in Saudi children using the Demirjian method: A comparative study and new prediction models. ISRN Dent. 2013;2013:390314. 10.1155/2013/390314 [DOI] [PMC free article] [PubMed] [Google Scholar]
- 41.Alshihri AM, Kruger E, Tennant M. Dental age assessment of 4-16 year old Western Saudi children and adolescents using Demirjian’s method for forensic dentistry. Egypt J Forensic Sci. 2016;6(2):152–6. [Internet] 10.1016/j.ejfs.2015.03.003 [DOI] [Google Scholar]
- 42.Alassiry A, Alshomrani K, Al Hasi S, Albasri A, Alkhathami SS, Althobaiti MA. Dental age assessment of 3–15-year-old Saudi children and adolescents using Demirjian’s method—A radiographic study. Clin Exp Dent Res. 2019;5(4):336–42. 10.1002/cre2.186 [DOI] [PMC free article] [PubMed] [Google Scholar]
- 43.Mohammed RB, Sanghvi P, Perumalla KK, Srinivasaraju D, Srinivas J, Siva Kalyan U, et al. Accuracy of four dental age estimation methods in Southern Indian children. J Clin Diagn Res. 2015;9(1):HC01–08. 10.7860/JCDR/2015/10141.5495 [DOI] [PMC free article] [PubMed] [Google Scholar]
- 44.Kumaresan R, Cugati N, Chandrasekaran B, Karthikeyan P. Reliability and validity of five radiographic dental-age estimation methods in a population of Malaysian children. J Investig Clin Dent. 2016;7(1):102–9. 10.1111/jicd.12116 [DOI] [PubMed] [Google Scholar]
- 45.Yassin SM, Calikoglu EO, Kosan Z. Accuracy of estimating chronological age from Nolla’s method of dental age estimation in a population of Southern Saudi Arabian children. Niger J Clin Pract. 2020;23:1753–58. 10.4103/njcp.njcp_648_19 [DOI] [PubMed] [Google Scholar]
- 46.Phillips VM, Van Wyk Kotze TJ. Testing standard methods of dental age estimation by moorrees, fanning and hunt and demirjian, goldstein and tanner on three south african children samples. J Forensic Odontostomatol. 2009;27(2):20–8. [PubMed] [Google Scholar]
- 47.Sharma B, Surgery M, Medical G, Surgery M, Dentistry P, Surgery M, et al. Dental age estimation by Moorrees, Fanning and Hunt Method-A radiographic study. Int J Dent Sci Innov Res. 2019;423(2):1–5. [Google Scholar]
- 48.Alkandiri F, Karimi A, Draft D, Lucas VS, Roberts G. Dental age estimation: A comparison of three methods of estimating dental age in a population of Kuwaiti children and adolescents. Forensic Sci Int Reports [Internet]. 2021;3:100214. 10.1016/j.fsir.2021.100214 [DOI] [Google Scholar]
- 49.Tony LS. H, Maness, A AD, EF H. A comparison of two dental age estimation techniques in contemporary American whites: The Moorrees and Demirjian approaches. Int J Forensic Sci Pathol. 2016;4:243–8. 10.19070/2332-287X-1600058 [DOI] [Google Scholar]
- 50.Corral C, García F, García J, León P, Herrera A, Martínez C, et al. Chronological versus dental age in subjects from 5 to 19 years: A comparative study with forensic implications. Colomb Med (Cali). 2010;41(3):215–23. [Google Scholar]
- 51.Kelmendi J, Vodanović M, Koçani F, Bimbashi V, Mehmeti B, Galić I. Dental age estimation using four Demirjian’s, Chaillet’s and Willems’ methods in Kosovar children. Leg Med (Tokyo). 2018;33(April):23–31. 10.1016/j.legalmed.2018.04.006 [DOI] [PubMed] [Google Scholar]
- 52.Hegde S, Patodia A, Shah K, Dixit U. The applicability of the Demirjian, Willems and Chaillet standards to age estimation of 5-15 year old Indian children. J Forensic Odontostomatol. 2019;37(1):40–50. [PMC free article] [PubMed] [Google Scholar]
- 53.AlQahtani SJ, Hector MP, Liversidge HM. Brief communication: The London atlas of human tooth development and eruption. Am J Phys Anthropol. 2010;142(3):481–90. 10.1002/ajpa.21258 [DOI] [PubMed] [Google Scholar]
- 54.Arthanari A, Doggalli N, Vidhya A, Rudraswamy S. Age estimation from second & third molar by modified gleiser and hunt method: A retrospective study. Indian J Forensic Med Toxicol. 2020;14(4):1–8. [Google Scholar]
- 55.Franco RPAV, Franco A, Turkina A, Arakelyan M, Arzukanyan A, Velenko P, et al. Third molar classification using Gleiser and Hunt system modified by Khöler in Russian adolescents – Age threshold of 14 and 16. Forensic Imaging. 2021;25(March).
- 56.Rai B. The evaluation of two radiographic methods for age determination of children in an Indian population. J Forensic Odontostomatol. 2008;26(2):30–3. [PubMed] [Google Scholar]
- 57.Kurita LM, Menezes AV, Casanova MS, Haiter-Neto F. Dental maturity as an indicator of chronological age : Radiographic assessment. J Appl Oral Sci. 2007;15(2):99–104. 10.1590/S1678-77572007000200005 [DOI] [PMC free article] [PubMed] [Google Scholar]
- 58.Duarte da Silva R, André Duarte da Silva M, Yumi Uezono A, Borges Braga dos Santos Queiroz S, Nogueira de Oliveira R. Estimating age of Brazilians using the methods of Demirjian and Nicodemo, Moraes and Médici: A comparative analysis. Forensic Med Anat Res. 2013;01(03):57–62. 10.4236/fmar.2013.13011 [DOI] [Google Scholar]
- 59.Chaillet N, Nyström M, Matti K, Demirjian A. Dental maturity curves in Finnish children: Demirjian’s method revisited and polynomial functions for age estimation. J Forensic Sci. 2004. 10.1520/JFS2004211 [DOI] [PubMed] [Google Scholar]
- 60.McKenna CJ, James H, Taylor JA, Townsend GC. Tooth development standards for South Australia. Aust Dent J. 2002;47(3):223–7. 10.1111/j.1834-7819.2002.tb00333.x [DOI] [PubMed] [Google Scholar]
- 61.Kelmendi J, Vodanović M, Koçani F, Bimbashi V, Mehmeti B, Galić I. Dental age estimation using four Demirjian’s, Chaillet’s and Willems’ methods in Kosovar children. Leg Med (Tokyo). 2018. November;33:23–31. [DOI] [PubMed] [Google Scholar]
- 62.Melo M, Ata-Ali J. Accuracy of the estimation of dental age in comparison with chronological age in a Spanish sample of 2641 living subjects using the Demirjian and Nolla methods. Forensic Sci Int. 2017;270:276.e1–7. [Internet] 10.1016/j.forsciint.2016.10.001 [DOI] [PubMed] [Google Scholar]
- 63.Paz Cortés MM, Rojo R, Alía García E, Mourelle Martínez MR. Accuracy assessment of dental age estimation with the Willems, Demirjian and Nolla methods in Spanish children: Comparative cross-sectional study. BMC Pediatr. 2020;20(1):361–9. 10.1186/s12887-020-02247-x [DOI] [PMC free article] [PubMed] [Google Scholar]
- 64.Pinchi V, Norelli GA, Pradella F, Vitale G, Rugo D, Nieri M. Comparison of the applicability of four odontological methods for age estimation of the 14 years legal threshold in a sample of Italian adolescents. J Forensic Odontostomatol. 2012;30(2):17–25. [PMC free article] [PubMed] [Google Scholar]
- 65.Bocquet-Appel JP, Masset C. Farewell to paleodemography. J Hum Evol. 1982;11:321–33. 10.1016/S0047-2484(82)80023-7 [DOI] [Google Scholar]


