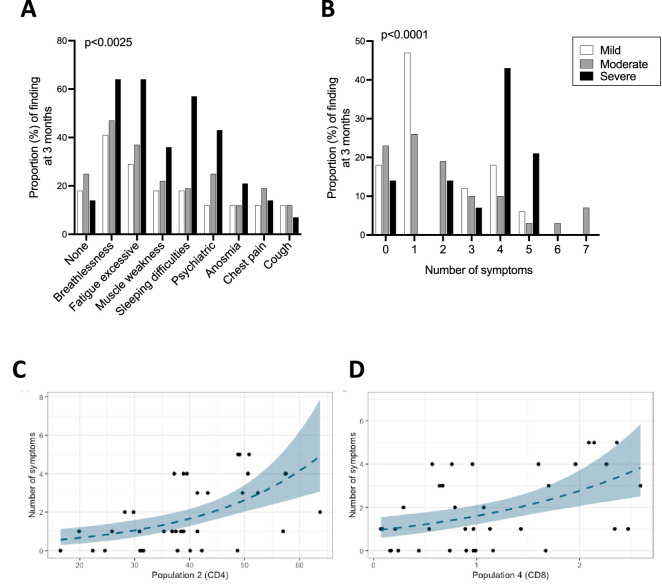
Figure 6. Ongoing symptoms at 3 months and associations with immune profiles.
(A, B) The percentage of patients with mild (N=17), moderate (N=32), and severe (N=14) coronavirus disease-19 (COVID-19) who reported the indicated symptom (A) or number of symptoms (B) at 3 months are indicated with white, grey, and black bars, respectively. Statistics were calculated using a Chi-square test. (C, D) Graphs depicting the association between number of symptoms and uniform manifold approximation and projection (UMAP) T-cells clusters in Poisson models, specifically CD4+ T-cell cluster 2 (C) and CD8+ T-cell cluster 4 (D).

