


Abstract
Single-cell RNA sequencing (scRNA-seq) provides insights into gene expression heterogeneities in diverse cell types underlying homeostasis, development and pathological states. However, the loss of spatial information hinders its applications in deciphering spatially related features, such as cell–cell interactions in a spatial context. Here, we present STellaris (https://spatial.rhesusbase.com), a web server aimed to rapidly assign spatial information to scRNA-seq data based on their transcriptomic similarity with public spatial transcriptomics (ST) data. STellaris is founded on 101 manually curated ST datasets comprising 823 sections across different organs, developmental stages and pathological states from humans and mice. STellaris accepts raw count matrix and cell type annotation of scRNA-seq data as the input, and maps single cells to spatial locations in the tissue architecture of properly matched ST section. Spatially resolved information for intercellular communications, such as spatial distance and ligand-receptor interactions (LRIs), are further characterized between annotated cell types. Moreover, we also expanded the application of STellaris in spatial annotation of multiple regulatory levels with single-cell multiomics data, using the transcriptome as a bridge. STellaris was applied to several case studies to showcase its utility of adding value to the ever-growing scRNA-seq data from a spatial perspective.
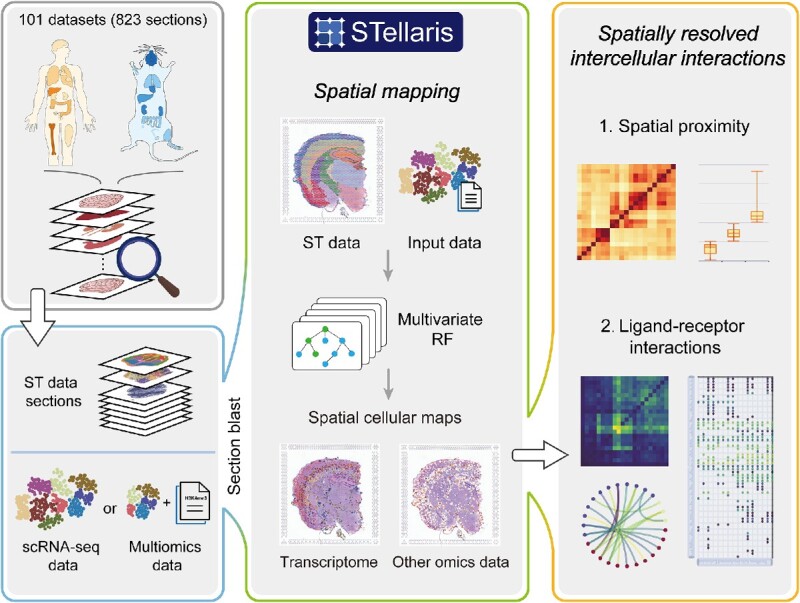
Graphical Abstract
Graphical Abstract.
INTRODUCTION
Single-cell RNA sequencing (scRNA-seq) has enabled comprehensive profiling of molecular signatures of diverse cell types (1,2), which has accelerated the understanding of gene expression programs and the cellular compositions underlying tissue architectures (3,4), developmental processes (5,6) and pathological states (7–9). A large number of scRNA-seq data are currently available and constitute a valuable resource for the scientific community (10). However, the spatial information of individual cells in scRNA-seq data as well as their proximities to each other was lost during the step of tissue dissociation, thereby posing a challenge in delineating the spatial profiles of single cells that are tightly linked to biological functions, such as spatial patterning of gene expression (11,12) and intercellular communications (13,14). It is thus necessary to chart single cells to spatial locations in order to take full advantage of the vast amount of scRNA-seq data that already exist.
Several computational approaches have been designed for the spatial reconstruction of single cells (11,15–20), however, each of them has limitations. For example, many of these methods depend on additional data modalities that are insufficient as reference guides, such as a small set of landmark genes (11,15,16,19,20), or prior knowledge of ligand-receptor interactions (LRIs) (17), or rely on assumptions such as the predefined shape of tissues (18). These limitations may confound the interpretation of in silico spatial mapping results and therefore preclude the widespread use of such methods.
Emerging spatial transcriptomics (ST) technologies provide key opportunities to address this issue by enabling the measurement of gene expression while preserving the spatial information (21,22). The expanding ST datasets offer the potential for serving as a reference atlas for guiding the spatial reconstruction of existing scRNA-seq data. As a result, the subsequent spatial cellular maps will thus increase the value of these data for deciphering intercellular communications in the spatial context.
However, typical algorithms or databases for integrating these two modalities mainly focus on deconvoluting or mapping ST spots using the cell-type-specific gene signatures derived from scRNA-seq data as a reference (23–28), and the computational approaches tailored for spatially annotating single cells in scRNA-seq data are relatively few (27,29–31). Furthermore, while several databases designed for spatial data visualization, deposition and analysis have been reported, such as SpatialDB (32), STomicsDB (33), SOAR (34), Aquila (35) and SODB (36), the online web server designed for this specific purpose is currently missing. To bridge this gap, we present STellaris, a web server that aims for fast and accurate spatial mapping of user-uploaded scRNA-seq data. STellaris implements a retrieval system that enables users to quickly select the properly matched ST section for their scRNA-seq data and several computational approaches that directly assign spatial coordinates to single cells within tissue architecture. Moreover, leveraging the inferred spatial information of individual cells, STellaris can characterize spatial proximity between cell types and identify intercellular LRIs between them. Notably, if provided, the spatial assignment of other single-cell omics data that were jointly profiled with the transcriptome can be resolved simultaneously. The user-friendly interface and flexible parameter settings would facilitate the discovery of novel biological insights and the design of experimental validation for the single-cell omics community.
MATERIALS AND METHODS
Workflow overview
To initiate spatial mapping in STellaris, users are required to submit their own annotated scRNA-seq data, along with the corresponding single-cell omics data if available (Figure 1). Upon submission, STellaris first performs a screening analysis to prioritize ST sections according to their similarity to the user-uploaded scRNA-seq data. Users can thus select a properly matched ST section based on the rank for the subsequent mapping step. Next, STellaris performs spatial mapping by sequentially conducting the following analyses: (i) projecting the scRNA-seq data and the selected ST data into a shared space, (ii) filtering cells that are not well mixed with ST spots and (iii) assigning single cells to spatial locations within the tissue architecture to generate a transcriptome-wide map of spatial patterning at a single-cell resolution. Notably, STellaris implements several public computational methods in the step of spatial mapping, such as CellTrek (29), Tangram (27) and CytoSPACE (31), to ensure the versatility of the web server. Moreover, if the corresponding single-cell omics data is provided, the spatial construction of this data will also be achieved simultaneously. Leveraging the spatial cellular map, spatially resolved intercellular communications will be characterized by (i) calculating the spatial distance between cell type pairs, (ii) categorizing cell type pairs into three groups (‘near,’ ‘medium’ and ‘far’) based on the distance, and (iii) identifying cell–cell LRIs between cell type pairs within each group.
Figure 1.

Schematic overview of the STellaris workflow. STellaris is built upon a collection of manually curated ST data, consisting of 101 datasets and 823 sections from humans and mice, which can be accessed and visualized in the dataset browser. The major function is spatial mapping, which takes user-uploaded single-cell omics data and performs a screening analysis using the MIA approach. Then, the scRNA-seq data and the selected ST data are integrated into a shared latent space, where a multivariate RF model is fitted to map cells to spatial locations. Based on the spatial cellular map, spatial proximity between cell types are characterized, followed by the identification of LRIs. Additionally, with the gene search tool, users can search for spatial expression patterns of genes of interest.
Collection of ST datasets
We searched for ST-related articles using keywords of ‘spatial transcriptomics,’ ‘spatial transcriptomic,’ and ‘spatial omics’ on PubMed, and included ST datasets that contain both gene expression matrices and spatial coordinate information. To ensure the high quality of the database, the ST datasets with both low spot resolution (< 500 spots/cells) and low coverage (< 10,000 detected genes) were discarded. Finally, we collected 100 public ST datasets from humans and mice, with some of these datasets accompanied by imaging data of histological staining. Additionally, we performed Stereo-seq (37) on two sequential coronal sections (10 μm thickness) derived from an embryonic mouse brain at E14.5 (Supplementary Text). These ST data were categorized according to ST technologies, species, strains, organs, tissues, developmental stages and pathological states. This resulted in a compilation of 101 ST datasets comprising 823 sections. The metadata information for these ST datasets is presented in Supplementary Table S1, and the data quality information can be found in Supplementary Figure S1 and Supplementary Table S2.
Spatial mapping of scRNA-seq data
Screening for properly matched ST section
To help users quickly find the ST section that properly matches their scRNA-seq data, we implement a screening method called section blast. This method evaluates the similarity between user-uploaded scRNA-seq data and the ST datasets in our local database, as inspired by the multimodal intersection analysis (MIA) approach described in (23). Briefly, we use a hypergeometric test to measure the overlap level of marker genes between all scRNA-seq cell types and all clusters in the ST data, and this ultimately results in a metric called MIA score, which measures the similarity between the scRNA-seq and the examined ST data.
Integration of scRNA-seq data and ST data
We use Seurat (16) to project these two modalities into shared latent space. To attenuate the confounding effects caused by the incompatibility between the two modalities, we implement a filtering method called coembedding filtering. This method filters out cells that are not well-mixed with ST spots in the shared UMAP space. Specifically, the average Euclidean distance between each spot and its 50 nearest neighbours (which can be adjusted through advanced parameters) is calculated. Then, we determine the mean of these average distances as a threshold that measures the overall proximity of cells to ST spots. Cells that are not within the scope of any ST spots were removed.
Mapping single cells to spatial locations
To construct a transcriptome-wide map of spatial patterning, we adopted a metric learning approach using a multivariate random forest (RF) model as the default option, as described in CellTrek (29). Briefly, this method trains a multivariate RF model on ST data in the shared latent space and then applies the model to the coembedding data of the scRNA-seq data and the ST data, thereby assigning single cells to the reciprocal nearest ST spots based on the RF distance metric. We made several adaptations for thorough evaluation, higher reliability and faster speed, including: (i) using 50 PCs when training the RF model, (ii) adding advanced options to flexibly control for the redundancy level of spatial mapping in order to suit different scRNA-seq data, including the number of nearest spots (default: 10) and cells (default: 10) and the maximum redundancy for a single cell (default: 1), (iii) replacing point repulsion with the introduction of uniform noise to eliminate the impact of neighbouring cells on the spatial coordinates and (iv) providing a summary of the spatial mapping for assessing mapping reliability. Besides CellTrek, we also implemented other public algorithms for spatial mapping, including Tangram and CytoSPACE. For Tangram, we used Scanpy (38) to identify marker genes in the scRNA-seq data. These marker genes were then used as training genes to find the optimal spatial alignment for single cells through the ‘cell’ mapping mode. Subsequently, we mapped each single cell to the most probable ST spot. For CytoSPACE, we used the default solver lapjv for a fast implementation of the Jonker-Volgenant shortest augmenting path assignment algorithm. To achieve parallel processing, we used the spot subsampling mode and set the number of subsampled cells per partition to the default value of 5000. Advanced users can modify this option by adjusting the advanced parameters.
A detailed explanation of the spatial mapping method is provided on STellaris help page (https://spatial.rhesusbase.com/help/manual/mapping).
Spatially resolved cell–cell interactions
The Euclidean distance is calculated between two cell types, as described in (39). We then perform k-means clustering (k = 3) on the spatial distances of all cell type pairs, and categorize them into three distance groups: ‘near,’ ‘medium’ and ‘far.’ Next, we identify LRIs using CellPhoneDB v4 (40) for each cell type pair within each distance group. We add support for mouse by converting gene symbols to their corresponding orthologs in human. The LRIs with P values ≤ 0.01 were retained as significant interactions.
Single-cell omics data analysis
We preprocess the corresponding single-cell omics data using SnapATAC2 (41), which involves selecting variable features, removing potential doublets and aggregating signals for regions in peak file (if provided). We then transfer the spatial locations generated from the transcriptome-based spatial mapping results to the corresponding cells in the single-cell omics data for spatial construction. Only cells shared between the scRNA-seq data and the single-cell omics data are retained.
RESULTS
The STellaris web server
The STellaris website is freely available to all users, and there is no login requirement. The key functional module of STellaris, the spatial mapping tool, is built upon a manually curated compilation of public ST datasets from humans and mice (Figure 2A). It can be accessed on the home page (Figure 2B). STellaris accepts two types of single-cell sequencing data as input: users can upload scRNA-seq data only, or both the scRNA-seq data and additional single-cell omics data, such as single-cell epigenomic data, that were jointly profiled with the transcriptome. For scRNA-seq data, two files are required: (i) a cell-by-gene raw count matrix and (ii) a cell type annotation file containing categorical annotations, such as clusters, cell types, or cell states. For the corresponding single-cell omics data, users are required to provide a fragment file containing raw counts detected in genomic regions. It is highly recommended to provide a peak file specifying the genomic loci where signals should be aggregated. To submit a job, users need to enter a job title and select the species, organ and tissue for the submitted single-cell omics data. Upon submission, the first step is to screen the ST sections. This returns a bar plot of MIA scores in descending order, followed by the meta information of the corresponding ST sections (Figure 2C). Users can click the ‘select’ button on the right to select a desired ST section for spatial mapping. Several advanced parameters can be set to control the filtering threshold and the redundancy level. The result page of spatial mapping is divided into three sections. It starts with a summary of preprocessing of the scRNA-seq data and filtering of cells in the shared latent space (Figure 2D). The second section displays the spatial mapping result of single cells in the right panel, which is compared to the selected ST section in the left panel (Figure 2E). The interactive view of the spatial cellular map at a single-cell resolution enables users to explore the spatial patterning of specific cell types or genes. Notably, an additional tab displaying the spatial construction of single-cell omics data will also be shown if these data are provided in the submission stage (Figure 2F). The last section presents an atlas of spatially resolved LRIs (Figure 2G). The distances between cell type pairs are represented as a heatmap. All cell type pairs are clustered into ‘near,’ ‘medium’ and ‘far’ distance groups, as shown in a box plot. This is followed by an atlas of LRIs presented as a heatmap. Users can select a cell type and view the associated LRI atlas, which includes a dot plot displaying the LRIs associated with the selected cell type, as well as a chord graph displaying detailed LRIs for specific cell type pair.
Figure 2.

Features of STellaris. (A) A summary of ST datasets and sections. (B) Job submission page. (C) Result page of section blast. (D) A summary of preprocessing and filtering at the beginning of the spatial mapping result page. Spatial cellular maps for the scRNA-seq data (E) and the corresponding single-cell omics data (F). (G) Spatial proximity between cell types annotated in the scRNA-seq data and the LRIs atlas between them.
In addition to the spatial mapping tool, we also provide a dataset browser tool for navigating ST datasets collected in our local database, as well as a gene search tool for retrieving gene expression characteristics from a spatial perspective (Figure 1). By using the dataset browser, users can select ST datasets based on ST technology, organ and pathological state and then explore the spatial patterning for genes of interest (Supplementary Figure S2). The gene search tool is built on top of our ST dataset catalog and provides gene expression information, such as spatially variable gene expression and tissue-wide gene expression, that is summarized from the integration of curated ST datasets (Supplementary Figure S3).
Case study 1: dissecting the spatial organization of the developing mouse cerebral cortex
The functions of complex tissues are tightly bound to the spatial organization of distinct cell types (42). The spatiotemporal dynamics of neuronal cell types that coordinate with proliferation and differentiation events are crucial for building proper brain functions (5,43). Here, we used public scRNA-seq data derived from the developing mouse cerebral cortex at E14.5 (44) to showcase the utility of STellaris in generating spatially resolved cellular maps at a single-cell resolution. After submitting the job, the section blast step reported a total of 104 ST sections (Supplementary Figure S4A). The top-ranked section was derived from the coronal plane of the E14.5 embryonic mouse brain, which was generated using Stereo-seq in this study. Notably, this section precisely matches the developmental stage of the uploaded scRNA-seq data (Supplementary Figure S4B). We then selected this section for subsequent spatial mapping analysis. Since the scRNA-seq data was in good agreement with the selected ST section, the filtering step did not result in significant loss of cells, and the majority of cells survived the mapping step. Figure 3A shows the mapping results within the spatial context of the coronal plane. To demonstrate the reliability of this cellular map, we inspected the spatial patterning of representative cell types (Figure 3B). For example, radial glial cells in the cerebral cortex line the ventricles. Ganglionic eminence cells, the progenitor cells of the ventral telencephalon, are located precisely in the ventral part of the brain. Thalamic cells are also positioned in the right place, although they are rarely captured in the scRNA-seq data. In addition to precise patterning of diverse cell types, the expression profiles of their marker genes, such as Hes5, Dlx2 and Syt13, also recapitulate those in the initial ST section (Figure 3C).
Figure 3.

Highlighted results of case studies 1 and 2. (A) Spatial mapping result of the scRNA-seq data from E14.5 embryonic mouse brain (right), which is compared to the selected ST section (left). (B) Spatial arrangements of representative cell types. (C) Spatial patterning of marker genes for cell types shown in (B) in the selected ST section (left) and mapping result (right). (D) Spatial mapping result of the scRNA-seq data from human cSCC (right), which is compared to the selected ST section (left). The dotted line highlights the leading edges. (E) Euclidean distances between cell types. (F) Euclidean distances of cell type pairs that are divided into three groups using k-means clustering (k= 3). The distances between TSK-fibroblasts and TSK-endothelial cells are highlighted. (G) A summary of detected LRIs between cell types. The TSK cell type is highlighted in red. (H) LRIs between TSK cells (ligands) and fibroblasts (receptors).
Case study 2: mapping intercellular crosstalk at tumor leading edges of human squamous cell carcinoma
The tumor microenvironment (TME) is a complex ecosystem involving various interactions between cancer cells and their microenvironment, ultimately contributing to tumor progression, metastasis and drug resistance (45). Understanding the cell–cell interactions that occur within the TME can facilitate the development of new therapeutic strategies (46). We used the scRNA-seq data derived from the diseased skin tissue of a patient with cutaneous squamous cell carcinoma (cSCC) (47) and mapped the single cells to the ST section (GSM4284318) that ranked first in the section blast results (Figure 3D, Supplementary Figure S4C and D). It has been reported that the tumor-specific keratinocyte (TSK) population is enriched in the leading edges of cSCC and functions as a hub for intercellular communications within a fibrovascular niche (47). Consistently, we observed a significant enrichment of TSKs in the tumor leading edges, where they colocalize with distinct TME cell types, such as fibroblasts and endothelial cells (Figure 3D). This was further validated by the spatial distances between cell type pairs, where TSK-fibroblasts was determined to be in the ‘near’ group and TSK-endothelial cells was determined to be in the ‘medium’ group (Figure 3E and F). Next, we investigated the LRIs within the TSK-fibrovascular TME. We observed that TSKs are engaged in extensive interactions with distinct stromal cell types in the TME (Figure 3G). For example, TSKs may modulate cancer-associated fibroblasts (CAFs) through several ligand-receptor pairs in the leading edges, including MDK-LRP1, CCL5-ACKR4 and VEGFA-NRP2 (Figure 3H). Moreover, we observed that TGFB1, a known CAF activator gene that is mainly expressed in TSKs in the leading edges, may participate in the induction of CAFs (Figure 3H). These results are consistent with previous findings (47,48).
Case study 3: spatial patterning of H3K4me3 modification in the mouse brain
Understanding the epigenomic landscape in the tissue of origin is crucial for deciphering the spatial regulation of gene expression (49). We used the single-cell multiomics data from the mouse frontal cortex and hippocampus generated by Paired-Tag technology, which consists of both transcriptomic and H3K4me3 epigenomic data that were jointly profiled in single cells (50). Notably, in addition to the regular scRNA-seq data, we also uploaded the epigenomic profiling of H3K4me3 modification, including a fragment file containing read counts detected in genomic regions (50) and a peak file containing genomic positions of active promoters of 127 genes (51). Based on the section blast results and the quality of ST sections, we selected the third-ranked section (ST8059048) from the mouse brain at P56 (24). We then performed spatial mapping and obtained a tissue-wide transcriptomic map, along with a spatial atlas of H3K4me3 modification in the active promoters of 127 genes (Supplementary Figure S5A). Next, to validate the accuracy of the epigenomic map generated using STellaris, we compared the spatial signature of H3K4me3 modification with that profiled using epigenomic MERFISH, a recently reported method that enables spatially resolved single-cell epigenomic profiling in complex tissues (51). To this end, we extracted the cortex region using polynomial regression and assessed the spatial distributions of layer-enriched active promoters interrogated in the epigenomic MERFISH paper. For each promoter, we calculated the distance of the centroid of H3K4me3 signals to the superficial layer of the cortex (Supplementary Figure S5B). We observed that the distribution patterns of H3K4me3 signals recapitulate those directly profiled using epigenomic MERFISH (Supplementary Figure S5C). Based on the accurate spatial patterning of H3K4me3 modification, we then investigated whether the H3K4me3 signals of promoter loci exhibited consistent layer enrichment with the expression of their corresponding genes. For example, the spatial pattern of gene expression of Bcl11b, a marker of early-born deep-layer neurons, are in good agreement with the H3K4me3 epigenomic signals in its promoter, suggesting the potential regulation of gene expression at the tissue scale (Supplementary Figure S5D). Taken together, these results demonstrate the feasibility of STellaris in characterizing gene regulatory mechanisms for single-cell multiomics data in the spatial context.
DISCUSSION
STellaris is a web server designed for accurate and flexible spatial mapping of single-cell omics data based on ST data. To our knowledge, this is the first web-based tool for spatial mapping of scRNA-seq data, followed by identification of cell–cell LRIs in the spatial context. The mapping functionality of STellaris is built upon manually curated ST datasets spanning diverse organs or tissues. Moreover, STellaris can characterize spatially resolved intercellular interactions between distinct cell types. In addition, using transcriptomic data as a bridge, STellaris enables the spatial assignment of corresponding single-cell omics data, e.g. single-cell epigenomic data. STellaris thus provides a user-friendly web server to facilitate the single-cell studies at the spatial level.
It's worth noting that the datasets we integrated are still not complete to include all possible tissue types and development/disease status, misleading results may thus occur when the user-uploaded scRNA-seq data does not match well with the existing ST datasets deposited in the database. To prevent misleading results, we implemented a systematic evaluation framework. First, we adopted a screening strategy (section blast) to select the properly matched ST sections that match the user-uploaded scRNA-seq as much as possible. In addition, before spatial mapping, we introduced a filtering method (coembedding filtering) to exclude single cells not well mixed with ST spots, avoiding potential mismatches that may lead to misleading results. Finally, after spatial mapping, we provided a metric (RF distance) to further evaluate the reliability of the final mapping results. With these quality control steps, we were able to quantify and evaluate the degree of correspondence between the scRNA-seq data and the ST section. Based on our practices, our quality control steps perform well to avoid misleading annotations, when analyzing the scRNA-seq data with unmatched tissue types with the ST dataset. As an example, we mapped the mouse liver scRNA-seq data to two ST data from the mouse liver and brain, respectively. During the coembedding filtering step, we observed that more cells were excluded in the brain compared to the liver due to not being well mixed with ST spots, which resulted in an obviously lower proportion of cells mapped to the brain ST section than the liver ST section (25.2% versus 79.7%) (Supplementary Figure S6A and B). To further assess the reliability of the two mapping results, we found that the RF distance is significantly smaller in the liver-to-liver mapping compared to the liver-to-brain mapping, indicating a more reliable mapping in the liver (Supplementary Figure S6C). In conclusion, we recommend users to select the top-ranked ST sections with matched tissue types or developmental stages for spatial mapping, and the following quality control steps could further help users to prevent misinterpretation of the results from unmatched biological states.
Meanwhile, as spatial transcriptomics techniques are varied in spot resolution and sequencing depth, mapping the same single-cell data to ST datasets generated with different techniques may result in different annotations. To further explore this issue, we mapped the single-cell data from the adult mouse brain used in case study 3 to three ST datasets from the top three techniques reported in the section blast step, including 10x Visium (Analysis 1: https://spatial.rhesusbase.com/mapping/resultPage/5722a340-de93-11ed-adc4-89347291db6a), Space-TREX (Analysis 2: https://spatial.rhesusbase.com/mapping/resultPage/213f4b20-de66-11ed-aa68-738869f8e887) and ST (Analysis 3: https://spatial.rhesusbase.com/mapping/resultPage/679f4360-de64-11ed-a102-d3dd38d83307) techniques, and then summarized the mapping results (Supplementary Table S3). Overall, based on the RF distance metric and the number of failed cells, the mapping results of Analysis 1 and Analysis 2 are comparable, which are better than that of Analysis 3. The unsatisfactory results of Analysis 3 could be attributed to the inconsistency of developmental stage between the ST section (P14) and the scRNA-seq data (adult). Regarding Analysis 1 and Analysis 2, the higher sequencing depth of Analysis 2 may explain the lower number of filtered cells compared to Analysis 1 during the coembedding filtering step (1,255 versus 1,930), as high transcriptomic coverage can achieve better integration of scRNA-seq with ST data. Meanwhile, the higher spot resolution of Analysis 1 may account for the lower number of unmapped cells compared to Analysis 2 during the spatial mapping step (782 versus 1,325), as high cell purities could facilitate precise assignment of the locations to single cells. Taken together, while different techniques may introduce some differences in the mapping results, it is not as significant as biological variation. Furthermore, our systematic evaluation procedures could effectively assess the differences caused by inherent factors of different techniques, such as the spot resolution and the sequencing depth. Notably, the current comparison is based on a limited number of datasets, and a systematic evaluation of the effects of different techniques requires further investigation.
Our method has been successfully applied to dissect the spatial organization in a variety of biological systems, including adult tissue (case study 3), developmental stage (case study 1), and diseased tissue (case study 2), demonstrating the generalizability of our method to a certain extent. However, there are some limitations of STellaris when applied to tissues with extreme spatial organizations: (i) for extremely dense tissues, the accuracy of spatial mapping based on transcriptomic similarity may decrease due to relative low cell purities in ST data; (ii) for tissues with excessively low cell density, the resulting spatial mapping may be sparse; (iii) for poorly organized tissues, our web server may underestimate the spatial complexity in the mapping results.
Going forward, we aim to continue our efforts to improve STellaris and expand its ecosystem to offer more valuable services. We plan to expand the capabilities of STellaris by (i) incorporating more ST datasets that cover a wider range of organs, developmental stages and pathological states, (ii) adding support for additional model species such as zebrafish, fruit flies and nematodes, (iii) integrating new spatial mapping tools into our web server and (iv) introducing new features that enable users to upload and analyze their own spatial omics data.
DATA AVAILABILITY
STellaris is freely available without registration at https://spatial.rhesusbase.com, including case studies, walk-through tutorials and detailed documentation. The Stereo-seq data are available at the Sequence Read Archive (https://www.ncbi.nlm.nih.gov/sra) under accession number PRJNA948178. The sources of manually curated ST datasets are listed in Supplementary Table S1. The source code used for STellairs is available on FigShare at https://doi.org/10.6084/m9.figshare.22318258.v4.
Supplementary Material
ACKNOWLEDGEMENTS
We thank the development team of Cirrocumulus (52) for their single-cell genomics data visualization tool. We thank Drs. Chuanhui Han, Lei Kong, Xiangfeng Wang, Yong E. Zhang and Fan Mo for their valuable suggestions, as well as Dr. Xiaoming Zhong for assistance with the website testing. We acknowledge Dr. Xin Liu from BGI Research, Ms. Shuang Gao from MGI Tech, Ms. Chunqiong Li from Chinese Institute for Brain Research, and Dr. Jianhuan Qi from the institute of Zoology, Chinese Academy of Sciences for technical support in the Stereo-seq study. We also thank Raygen Health Molecular Medicine Tech Co., Ltd for their help with server maintenance.
Contributor Information
Xiangshang Li, Laboratory of Bioinformatics and Genomic Medicine, Institute of Molecular Medicine, College of Future Technology, Peking University, Beijing 100871, China.
Chunfu Xiao, Laboratory of Bioinformatics and Genomic Medicine, Institute of Molecular Medicine, College of Future Technology, Peking University, Beijing 100871, China.
Juntian Qi, Laboratory of Bioinformatics and Genomic Medicine, Institute of Molecular Medicine, College of Future Technology, Peking University, Beijing 100871, China.
Weizhen Xue, BGI-Beijing, Beijing 102601, China.
Xinwei Xu, Laboratory of Bioinformatics and Genomic Medicine, Institute of Molecular Medicine, College of Future Technology, Peking University, Beijing 100871, China; College of Life Science, Peking University, Beijing 100871, China.
Zelin Mu, Laboratory of Bioinformatics and Genomic Medicine, Institute of Molecular Medicine, College of Future Technology, Peking University, Beijing 100871, China; School of Basic Medical Sciences, Peking University Health Science Center, Beijing 100191, China.
Jie Zhang, Laboratory of Bioinformatics and Genomic Medicine, Institute of Molecular Medicine, College of Future Technology, Peking University, Beijing 100871, China.
Chuan-Yun Li, Laboratory of Bioinformatics and Genomic Medicine, Institute of Molecular Medicine, College of Future Technology, Peking University, Beijing 100871, China; Chinese Institute for Brain Research, Beijing 102206, China.
Wanqiu Ding, Laboratory of Bioinformatics and Genomic Medicine, Institute of Molecular Medicine, College of Future Technology, Peking University, Beijing 100871, China; Bioinformatics Core, Institute of Molecular Medicine, College of Future Technology, Peking University, Beijing 100871, China.
SUPPLEMENTARY DATA
Supplementary Data are available at NAR Online.
FUNDING
National Key Research and Development Program of China [2018YFA0801405, 2019YFA0801801]; National Natural Science Foundation of China [31871272]; Chinese Institute for Brain Research (Beijing) [2020-NKX-XM-11]. Funding for open access charge: National Key Research and Development Program of China [2018YFA0801405].
Conflict of interest statement. None declared.
REFERENCES
- 1. Jovic D., Liang X., Zeng H., Lin L., Xu F., Luo Y.. Single-cell RNA sequencing technologies and applications: a brief overview. Clin. Transl. Med. 2022; 12:e694. [DOI] [PMC free article] [PubMed] [Google Scholar]
- 2. Aldridge S., Teichmann S.A.. Single cell transcriptomics comes of age. Nat. Commun. 2020; 11:4307. [DOI] [PMC free article] [PubMed] [Google Scholar]
- 3. Birnbaum K.D. Power in numbers: single-cell RNA-seq strategies to dissect complex tissues. Annu. Rev. Genet. 2018; 52:203–221. [DOI] [PMC free article] [PubMed] [Google Scholar]
- 4. Regev A., Teichmann S.A., Lander E.S., Amit I., Benoist C., Birney E., Bodenmiller B., Campbell P., Carninci P., Clatworthy M.et al.. The Human cell atlas. Elife. 2017; 6:e27041. [DOI] [PMC free article] [PubMed] [Google Scholar]
- 5. La Manno G., Siletti K., Furlan A., Gyllborg D., Vinsland E., Mossi Albiach A., Mattsson Langseth C., Khven I., Lederer A.R., Dratva L.M.et al.. Molecular architecture of the developing mouse brain. Nature. 2021; 596:92–96. [DOI] [PubMed] [Google Scholar]
- 6. Pijuan-Sala B., Griffiths J.A., Guibentif C., Hiscock T.W., Jawaid W., Calero-Nieto F.J., Mulas C., Ibarra-Soria X., Tyser R.C.V., Ho D.L.L.et al.. A single-cell molecular map of mouse gastrulation and early organogenesis. Nature. 2019; 566:490–495. [DOI] [PMC free article] [PubMed] [Google Scholar]
- 7. Tokura M., Nakayama J., Prieto-Vila M., Shiino S., Yoshida M., Yamamoto T., Watanabe N., Takayama S., Suzuki Y., Okamoto K.et al.. Single-cell transcriptome profiling reveals intratumoral heterogeneity and molecular features of ductal carcinoma In situ. Cancer Res. 2022; 82:3236–3248. [DOI] [PubMed] [Google Scholar]
- 8. Stubbington M.J.T., Rozenblatt-Rosen O., Regev A., Teichmann S.A.. Single-cell transcriptomics to explore the immune system in health and disease. Science. 2017; 358:58–63. [DOI] [PMC free article] [PubMed] [Google Scholar]
- 9. Miranda A.M.A., Janbandhu V., Maatz H., Kanemaru K., Cranley J., Teichmann S.A., Hubner N., Schneider M.D., Harvey R.P., Noseda M.. Single-cell transcriptomics for the assessment of cardiac disease. Nat. Rev. Cardiol. 2022; 20:289–308. [DOI] [PubMed] [Google Scholar]
- 10. Svensson V., da Veiga Beltrame E., Pachter L.. A curated database reveals trends in single-cell transcriptomics. Database (Oxford). 2020; 2020:baaa073. [DOI] [PMC free article] [PubMed] [Google Scholar]
- 11. Moor A.E., Harnik Y., Ben-Moshe S., Massasa E.E., Rozenberg M., Eilam R., Bahar Halpern K., Itzkovitz S.. Spatial reconstruction of single enterocytes uncovers broad zonation along the intestinal villus axis. Cell. 2018; 175:1156–1167. [DOI] [PubMed] [Google Scholar]
- 12. He Z., Han D., Efimova O., Guijarro P., Yu Q., Oleksiak A., Jiang S., Anokhin K., Velichkovsky B., Grunewald S.et al.. Comprehensive transcriptome analysis of neocortical layers in humans, chimpanzees and macaques. Nat. Neurosci. 2017; 20:886–895. [DOI] [PubMed] [Google Scholar]
- 13. Arnol D., Schapiro D., Bodenmiller B., Saez-Rodriguez J., Stegle O.. Modeling cell–cell interactions from spatial molecular data with spatial variance component analysis. Cell Rep. 2019; 29:202–211. [DOI] [PMC free article] [PubMed] [Google Scholar]
- 14. Longo S.K., Guo M.G., Ji A.L., Khavari P.A.. Integrating single-cell and spatial transcriptomics to elucidate intercellular tissue dynamics. Nat. Rev. Genet. 2021; 22:627–644. [DOI] [PMC free article] [PubMed] [Google Scholar]
- 15. Cang Z., Nie Q.. Inferring spatial and signaling relationships between cells from single cell transcriptomic data. Nat. Commun. 2020; 11:2084. [DOI] [PMC free article] [PubMed] [Google Scholar]
- 16. Satija R., Farrell J.A., Gennert D., Schier A.F., Regev A.. Spatial reconstruction of single-cell gene expression data. Nat. Biotechnol. 2015; 33:495–502. [DOI] [PMC free article] [PubMed] [Google Scholar]
- 17. Ren X., Zhong G., Zhang Q., Zhang L., Sun Y., Zhang Z.. Reconstruction of cell spatial organization from single-cell RNA sequencing data based on ligand-receptor mediated self-assembly. Cell Res. 2020; 30:763–778. [DOI] [PMC free article] [PubMed] [Google Scholar]
- 18. Moriel N., Senel E., Friedman N., Rajewsky N., Karaiskos N., Nitzan M.. NovoSpaRc: flexible spatial reconstruction of single-cell gene expression with optimal transport. Nat. Protoc. 2021; 16:4177–4200. [DOI] [PubMed] [Google Scholar]
- 19. Karaiskos N., Wahle P., Alles J., Boltengagen A., Ayoub S., Kipar C., Kocks C., Rajewsky N., Zinzen R.P.. The Drosophila embryo at single-cell transcriptome resolution. Science. 2017; 358:194–199. [DOI] [PubMed] [Google Scholar]
- 20. Achim K., Pettit J.B., Saraiva L.R., Gavriouchkina D., Larsson T., Arendt D., Marioni J.C.. High-throughput spatial mapping of single-cell RNA-seq data to tissue of origin. Nat. Biotechnol. 2015; 33:503–509. [DOI] [PubMed] [Google Scholar]
- 21. Asp M., Bergenstrahle J., Lundeberg J.. Spatially resolved transcriptomes-next generation tools for tissue exploration. Bioessays. 2020; 42:e1900221. [DOI] [PubMed] [Google Scholar]
- 22. Marx V. Method of the Year: spatially resolved transcriptomics. Nat. Methods. 2021; 18:9–14. [DOI] [PubMed] [Google Scholar]
- 23. Moncada R., Barkley D., Wagner F., Chiodin M., Devlin J.C., Baron M., Hajdu C.H., Simeone D.M., Yanai I.. Integrating microarray-based spatial transcriptomics and single-cell RNA-seq reveals tissue architecture in pancreatic ductal adenocarcinomas. Nat. Biotechnol. 2020; 38:333–342. [DOI] [PubMed] [Google Scholar]
- 24. Kleshchevnikov V., Shmatko A., Dann E., Aivazidis A., King H.W., Li T., Elmentaite R., Lomakin A., Kedlian V., Gayoso A.et al.. Cell2location maps fine-grained cell types in spatial transcriptomics. Nat. Biotechnol. 2022; 40:661–671. [DOI] [PubMed] [Google Scholar]
- 25. Cable D.M., Murray E., Zou L.S., Goeva A., Macosko E.Z., Chen F., Irizarry R.A.. Robust decomposition of cell type mixtures in spatial transcriptomics. Nat. Biotechnol. 2022; 40:517–526. [DOI] [PMC free article] [PubMed] [Google Scholar]
- 26. Andersson A., Bergenstrahle J., Asp M., Bergenstrahle L., Jurek A., Fernandez Navarro J., Lundeberg J.. Single-cell and spatial transcriptomics enables probabilistic inference of cell type topography. Commun. Biol. 2020; 3:565. [DOI] [PMC free article] [PubMed] [Google Scholar]
- 27. Biancalani T., Scalia G., Buffoni L., Avasthi R., Lu Z., Sanger A., Tokcan N., Vanderburg C.R., Segerstolpe A., Zhang M.et al.. Deep learning and alignment of spatially resolved single-cell transcriptomes with Tangram. Nat. Methods. 2021; 18:1352–1362. [DOI] [PMC free article] [PubMed] [Google Scholar]
- 28. Fan Z., Luo Y., Lu H., Wang T., Feng Y., Zhao W., Kim P., Zhou X.J.N.A.R.. SPASCER: spatial transcriptomics annotation at single-cell resolution. Nucleic Acids Res. 2023; 51:D1138–D1149. [DOI] [PMC free article] [PubMed] [Google Scholar]
- 29. Wei R., He S., Bai S., Sei E., Hu M., Thompson A., Chen K., Krishnamurthy S., Navin N.E.. Spatial charting of single-cell transcriptomes in tissues. Nat. Biotechnol. 2022; 40:1190–1199. [DOI] [PMC free article] [PubMed] [Google Scholar]
- 30. Maseda F., Cang Z., Nie Q.. DEEPsc: a deep learning-based map connecting single-cell transcriptomics and spatial imaging data. Front. Genet. 2021; 12:636743. [DOI] [PMC free article] [PubMed] [Google Scholar]
- 31. Vahid M.R., Brown E.L., Steen C.B., Zhang W., Jeon H.S., Kang M., Gentles A.J., Newman A.M.J.N.B.. High-resolution alignment of single-cell and spatial transcriptomes with CytoSPACE. Nat. Biotechnol. 2023; 10.1038/s41587-023-01697-9. [DOI] [PMC free article] [PubMed] [Google Scholar]
- 32. Fan Z., Chen R., Chen X.. SpatialDB: a database for spatially resolved transcriptomes. Nucleic Acids Res. 2020; 48:D233–D237. [DOI] [PMC free article] [PubMed] [Google Scholar]
- 33. Xu Z., Wang W., Yang T., Chen J., Huang Y., Gould J., Du W., Yang F., Li L., Lai T.J.b.. STOmicsDB: a database of spatial transcriptomic data. 2022; bioRxiv doi:14 March 2022, preprint: not peer reviewed 10.1101/2022.03.11.481421. [DOI]
- 34. Li Y., Dennis S., Hutch M.R., Li Y., Broad M.S., Zeng Z., Luo Y.. SOAR: a spatial transcriptomics analysis resource to model spatial variability and cell type interactions. 2022; bioRxiv doi:17 April 2022, preprint: not peer reviewed 10.1101/2022.04.17.488596. [DOI]
- 35. Zheng Y., Chen Y., Ding X., Wong K.H., Cheung E.. Aquila: a spatial omics database and analysis platform. Nucleic Acids Res. 2023; 51:D827–D834. [DOI] [PMC free article] [PubMed] [Google Scholar]
- 36. Yuan Z., Pan W., Zhao X., Zhao F., Xu Z., Li X., Zhao Y., Zhang M.Q., Yao J.. SODB facilitates comprehensive exploration of spatial omics data. Nat. Methods. 2023; 20:387–399. [DOI] [PubMed] [Google Scholar]
- 37. Chen A., Liao S., Cheng M., Ma K., Wu L., Lai Y., Qiu X., Yang J., Xu J., Hao S.et al.. Spatiotemporal transcriptomic atlas of mouse organogenesis using DNA nanoball-patterned arrays. Cell. 2022; 185:1777–1792. [DOI] [PubMed] [Google Scholar]
- 38. Wolf F.A., Angerer P., Theis F.J.. SCANPY: large-scale single-cell gene expression data analysis. Genome Biol. 2018; 19:15. [DOI] [PMC free article] [PubMed] [Google Scholar]
- 39. Liu Z., Sun D., Wang C.. Evaluation of cell–cell interaction methods by integrating single-cell RNA sequencing data with spatial information. Genome Biol. 2022; 23:218. [DOI] [PMC free article] [PubMed] [Google Scholar]
- 40. Efremova M., Vento-Tormo M., Teichmann S.A., Vento-Tormo R.. CellPhoneDB: inferring cell–cell communication from combined expression of multi-subunit ligand-receptor complexes. Nat. Protoc. 2020; 15:1484–1506. [DOI] [PubMed] [Google Scholar]
- 41. Zhang K., Hocker J.D., Miller M., Hou X., Chiou J., Poirion O.B., Qiu Y., Li Y.E., Gaulton K.J., Wang A.et al.. A single-cell atlas of chromatin accessibility in the human genome. Cell. 2021; 184:5985–6001. [DOI] [PMC free article] [PubMed] [Google Scholar]
- 42. Rodriques S.G., Stickels R.R., Goeva A., Martin C.A., Murray E., Vanderburg C.R., Welch J., Chen L.M., Chen F., Macosko E.Z.. Slide-seq: a scalable technology for measuring genome-wide expression at high spatial resolution. Science. 2019; 363:1463–1467. [DOI] [PMC free article] [PubMed] [Google Scholar]
- 43. Bhaduri A., Sandoval-Espinosa C., Otero-Garcia M., Oh I., Yin R., Eze U.C., Nowakowski T.J., Kriegstein A.R.. An atlas of cortical arealization identifies dynamic molecular signatures. Nature. 2021; 598:200–204. [DOI] [PMC free article] [PubMed] [Google Scholar]
- 44. Loo L., Simon J.M., Xing L., McCoy E.S., Niehaus J.K., Guo J., Anton E.S., Zylka M.J.. Single-cell transcriptomic analysis of mouse neocortical development. Nat. Commun. 2019; 10:134. [DOI] [PMC free article] [PubMed] [Google Scholar]
- 45. Binnewies M., Roberts E.W., Kersten K., Chan V., Fearon D.F., Merad M., Coussens L.M., Gabrilovich D.I., Ostrand-Rosenberg S., Hedrick C.C.et al.. Understanding the tumor immune microenvironment (TIME) for effective therapy. Nat. Med. 2018; 24:541–550. [DOI] [PMC free article] [PubMed] [Google Scholar]
- 46. Baghban R., Roshangar L., Jahanban-Esfahlan R., Seidi K., Ebrahimi-Kalan A., Jaymand M., Kolahian S., Javaheri T., Zare P.. Tumor microenvironment complexity and therapeutic implications at a glance. Cell Commun Signal. 2020; 18:59. [DOI] [PMC free article] [PubMed] [Google Scholar]
- 47. Ji A.L., Rubin A.J., Thrane K., Jiang S., Reynolds D.L., Meyers R.M., Guo M.G., George B.M., Mollbrink A., Bergenstrahle J.et al.. Multimodal analysis of composition and spatial architecture in Human squamous cell carcinoma. Cell. 2020; 182:497–514. [DOI] [PMC free article] [PubMed] [Google Scholar]
- 48. Kalluri R. The biology and function of fibroblasts in cancer. Nat. Rev. Cancer. 2016; 16:582–598. [DOI] [PubMed] [Google Scholar]
- 49. Koch L. Spatial epigenomics in single cells. Nat. Rev. Genet. 2023; 24:1. [DOI] [PubMed] [Google Scholar]
- 50. Zhu C., Zhang Y., Li Y.E., Lucero J., Behrens M.M., Ren B.. Joint profiling of histone modifications and transcriptome in single cells from mouse brain. Nat. Methods. 2021; 18:283–292. [DOI] [PMC free article] [PubMed] [Google Scholar]
- 51. Lu T., Ang C.E., Zhuang X.. Spatially resolved epigenomic profiling of single cells in complex tissues. Cell. 2022; 185:4448–4464. [DOI] [PMC free article] [PubMed] [Google Scholar]
- 52. Li B., Gould J., Yang Y., Sarkizova S., Tabaka M., Ashenberg O., Rosen Y., Slyper M., Kowalczyk M.S., Villani A.C.et al.. Cumulus provides cloud-based data analysis for large-scale single-cell and single-nucleus RNA-seq. Nat. Methods. 2020; 17:793–798. [DOI] [PMC free article] [PubMed] [Google Scholar]
Associated Data
This section collects any data citations, data availability statements, or supplementary materials included in this article.
Supplementary Materials
Data Availability Statement
STellaris is freely available without registration at https://spatial.rhesusbase.com, including case studies, walk-through tutorials and detailed documentation. The Stereo-seq data are available at the Sequence Read Archive (https://www.ncbi.nlm.nih.gov/sra) under accession number PRJNA948178. The sources of manually curated ST datasets are listed in Supplementary Table S1. The source code used for STellairs is available on FigShare at https://doi.org/10.6084/m9.figshare.22318258.v4.