

Summary
TREX1 encodes a major DNA exonuclease and mutations of this gene are associated with type I interferonopathies in human. Mice with Trex1 deletion or mutation have shortened life spans accompanied by a senescence-associated secretory phenotype. However, the contribution of cellular senescence in TREX1 deficiency-induced type I interferonopathies remains unknown. We found that features of cellular senescence present in Trex1−/− mice are induced by multiple factors, particularly DNA damage. The cGAS-STING and DNA damage response pathways are required for maintaining TREX1 deletion-induced cellular senescence. Inhibition of the DNA damage response, such as with Checkpoint kinase 2 (CHK2) inhibitor, partially alleviated progression of type I interferonopathies and lupus-like features in the mice. These data provide insights into the initiation and development of type I interferonopathies and lupus-like diseases, and may help inform the development of targeted therapeutics.
Subject areas: Disease, Molecular biology, Model organism
Graphical abstract
Highlights
-
•
Deletion of TREX1 accelerates spontaneous cellular senescence
-
•
Deletion of TREX1 activates the DNA damage response
-
•
Inhibition of DNA damage response alleviates interferonopathies of Trex1−/− mice
-
•
Inhibition of DNA damage response alleviates lupus-like features of Trex1−/− mice
Disease; Molecular biology; Model organism
Introduction
Cellular senescence is manifested as an irreversible stagnation of the cell cycle and a loss of proliferation potential.1,2 Morphologically, senescent cells are characterized by an enlarged and flattened cell surface area, dissociation of heterochromatin from the nuclear layer and localization to the interior of the nucleus, and accumulation of senescence-associated heterochromatin foci (SAHFs) in the nucleus,3,4 with cytoplasmic micronuclei appearing in primary nuclear satellites.5 At the molecular level, senescence-associated β-galactosidase (SA-β-Gal) activity increases because of increased acidity in aging cells.6 In addition, senescent cells express a senescence-associated secretory phenotype (SASP) involving autocrine or paracrine signals that cause changes in the tissue microenvironment.7,8 SASP is associated with multiple biological processes, including wound healing,9 tissue repair,10 and tumorigenesis,7 and SASP-related inflammatory responses are thought to underlie many aging-related effects and age-related diseases.
Cellular senescence is accompanied by a weakening of genomic stability11 and the entry of damaged DNA fragments into the cytoplasm in the form of micronuclei. The nuclear envelope of these micronuclei is unstable, which allows DNA binding by the cytosolic DNA sensor cGMP-AMP (cGAMP) synthase (cGAS).12,13 cGAS is activated by binding to double-stranded DNA, including microbial and self-DNA,14,15 which triggers 2′,3′ cyclic GMP-AMP (cGAMP) production14 and subsequent cGAMP binding and activation of the adaptor protein stimulator of interferon genes (STING) (also known as MITA, MPYS, and TMEM173). STING then recruits TANK-binding kinase 1 (TBK1) and IκB kinase to activate IFN regulatory factor 3 (IRF3) and NF-κB, respectively, leading to the production of type I interferons and inflammatory cytokines.14,15 During cell senescence, the cGAS-STING pathway is activated on cGAS recognition of damaged DNA fragments derived from the nucleus.16
The DNA damage response (DDR) also plays a key role in cellular senescence induced by DNA damage. The DDR pathway is mediated by ataxia telangiectasia mutated (ATM)/ataxia telangiectasia and rad3-related protein (ATR) and Checkpoint kinase (CHK1/CHK2) proteins, which stabilize P53 through phosphorylation.17 P53 activates the cell cycle inhibitor P21, which leads to Cdk/Cyclin inhibition and cell-cycle arrest in G1/S phase.17,18 Cdk/Cyclin A, D, and E phosphorylate RB, which blocks the growth inhibitory function of the RB pathway. RB is activated by P21 or P16, both of which inhibit Cdk/cyclin. Active, hypophosphorylated RB binds to E2F protein and inhibits its transcriptional activity, thereby inhibiting cell cycle progression19 and driving cellular senescence.
Three Prime Repair Exonuclease 1 (TREX1) is the major cellular 3′-to-5′ DNA exonuclease in the cytoplasm. TREX1 contains 314 amino acids; its N-terminal has a DNase domain20 required for nucleic acid degradation, whereas its C-terminal domain (CTR) is essential for localization to the endoplasmic reticulum (ER).20,21,22,23 TREX1 is abundantly expressed in mammalian cells, and TREX1 gene mutations are linked to autoimmune diseases including systemic lupus erythematosus (SLE), Aicardi-Goutières syndrome (AGS), familial chilblain lupus (FCL), and leukodystrophy-related retinopathy (retinal vasculopathy with cerebral leukodystrophy, RVCL).24,25,26,27 Activation of the cGAS-STING pathway is required for TREX1 deletion- or mutation-induced type I interferonopathies and lupus-like phenotypes, which can be rescued by cGAS deletion.28,29 Recent studies have reported down-regulation of TREX1 in senescent cells and its association with SASP secretion.30 In this context, we hypothesized that TREX1 deletion may accelerate cellular senescence.
Here, we confirmed that TREX1 deletion in a mouse model (Trex1−/−) accelerates cellular senescence and further found that ablation of cGAS inhibiting the cGAS-STING pathway can mitigate this process. We also found that the DDR plays a critical role in maintaining TREX1 deletion-induced cellular senescence, such that lupus-like phenotypes in Trex1−/− mice can be alleviated by BML-277, an inhibitor of CHK2 (a component of the DDR pathway).
Results
TREX1 deletion accelerates cellular senescence
Human TREX1 is a single-exon gene encoding a protein with an exonuclease domain at the N-terminus (amino acid numbering 1–212) and a single transmembrane helix at the polar C-terminus (amino acid numbering 213–314) connected to the ER.31 Different mutant sites in TREX1 affect different functions of TREX1 while exhibiting different disease features in clinical settings. For example, the TREX1-D18N point mutation causes loss of TREX1 DNA enzymatic activity,29 and the TREX1-V235fs shift code mutant retains TREX1 DNA enzymatic activity but loses the ER localization function.32 The diagram of common mutations in TREX1 associated with various autoimmune and inflammatory diseases is shown in Figure S1A. To better reproduce the disease phenotype in humans, we have constructed a set of Trex1 genetically modified mouse models using CRISPR-Cas9 technology, including Trex1 knockout (Trex1−/−) mice,29,33 a Trex1-D18N point mutant (Trex1D18N) mice,29 and a Trex1-P212fs frameshift mutant (Trex1P212fs) mice (unpublished). Trex1 mouse model gene modification loci sequencing results is shown in Figure S1B. In contrast, Trex1D18N mice showed no significant change in body size compared to wild-type (WT) mice, whereas Trex1−/− and Trex1P212fs mice showed a significant reduction in body size (Figure S1C), a significant reduction in survival rate compared to WT mice for all three mice, and differences between the models (Figure S1D).To focus on the topic of this study, we isolated above mouse embryonic fibroblasts (MEFs) from day 13.5 embryos (E13.5) of each mutant and their WT littermates and performed RNA sequencing (RNA-Seq) analysis (Figure S1E). Compared to WT, MEFs from all three Trex1 gene-modified mouse models showed differential expression of 29 genes; 99 genes were differentially expressed only in Trex1−/− MEFs, 1744 in Trex1D18N/D18N MEFs, and 54 in Trex1P212fs/P212fs MEFs. KEGG enrichment analysis of the 29 differentially expressed genes in common across the Trex1 mutant models indicated that they were mainly associated with antiviral infection and inflammatory responses (Figures S1F and S1G). We also performed KEGG enrichment analysis for the 99 genes differentially expressed only in Trex1−/− MEFs (Figures S1H and S1I). The top-scoring genes were also involved in virus infection-related pathways as well as cellular senescence-related pathways. These data suggest a role for TREX1 in regulating cellular senescence.
In vitro, proliferating cells normally enter the senescence stage because of telomere or external stress34; immortalized cells can be obtained by serial passaging.35 To determine the effect of TREX1 deletion on the timing of cellular senescence, we isolated embryos from littermate in the same Trex1+/− mother that was crossed to a Trex1+/− male and cultured the embryonic fibroblasts in vitro in atmospheric O2 (20%) through serial passages according to a modified 3T3 protocol. Compared with WT MEFs, Trex1−/− MEFs entered the senescence stage at passage 5–6, and the cell proliferation rate was significantly lower. Although WT MEFs could be immortalized by passage 15–16, Trex1−/− MEFs were more difficult to immortalize (Figure 1A). We also compared E13.5 MEFs derived from WT and Trex1−/− mice, as show similar results (Figure 1B). An increase of intracellular acidity in senescent cells leads to an increase in β-galactosidase (β-Gal) activity, making β-Gal is an important indicator of cellular senescence.6 We therefore examined senescence associated (SA-) β-Gal activity of MEFs during serial passages. Trex1−/− MEFs had SA-β-Gal-positive cells at passage 6, whereas WT MEFs had positive cells at passage 8; in subsequent passages, Trex1−/− MEFs had more SA-β-Gal-positive cells than WT MEFs (Figures 1C and 1D). Another feature of senescent cells is the SASP signature, characterized by the secretion of a distinct set of cytokines, chemokines, and metalloproteinases.36 We examined the expression of representative SASP factors, including IL-1β, IL-6, IL-8, Mmp12 and p16 by reverse transcription quantitative polymerase chain reaction (RT-qPCR) (Figures 1E–1I). Expression of each SASP factor was induced by TREX1 deletion, consistent with SA-β-Gal staining data. These data suggest that TREX1 deletion accelerates spontaneous cellular senescence and restrains cellular immortalization.
Figure 1.

TREX1 knockout accelerates cellular senescence in MEFs
(A) Growth curve of MEFs derived from littermate WT and Trex1−/− embryos in the same Trex1+/− mother whereas 20 serial passages according to a modified 3T3 protocol.
(B) Similar to A except that MEFs were from WT and Trex1−/− mice.
(C) Cellular senescence of WT and Trex1−/− MFEs during serial passages was analyzed by SA-β-Gal staining. (D) Histograms indicate the percentage of SA-β-gal-positive cells.
(E–I) Expression of representative SASP factors WT and Trex1−/− MEFs in passages, including IL-6 (E), IL-8 (F), IL-1β (G), Mmp12 (H), p16 (I) by RT-qPCR (n = 3 biological replicates). Data represent mean ± S.E.M. of at least 3 independent experiments. ∗p < 0.05; ∗∗p < 0.01; ∗∗∗p < 0.001, p values were calculated using by one-way ANOVA versus WT with Dunnett’s correction (D–I).
TREX1 deletion-induced cellular senescence is accompanied by DNA damage and oxidative stress
Cellular senescence can be induced by environmental stress leading to DNA damage.11 In our RNA-Seq analysis, we found that the transcripts of the ATM were significantly up-regulated (Figure S1G). As an important regulator of DDR, ATM plays an important role in DNA repair and induction of cellular senescence.37 We examined the presence of another DNA damage marker, γ-H2AX, in passage 8 Trex1−/− MEFs by immunoblotting (Figures 2A and 2B), and its distribution in the nucleus by immunofluorescence (Figures 2C and 2D). More severe DNA damage was present in Trex1−/− MEFs compared to WT MEFs, indicated by greater expression of nuclear γ-H2AX in Trex1−/− MEFs. Notably, TREX1 deletion caused DNA damage to have already been demonstrated in human TREX1-deficient patient cells.23
Figure 2.

The DNA damage response is activated in TREX1 knockout-induced cellular senescence
MEFs were derived from day 13.5 mouse embryos and cellular senescence was induced by serial cell passaging.
(A) Expression of γ-H2AX protein, a marker of DNA damage, detected by immunoblot in passage 8 of MEFs.
(B) Quantitative analysis of (A); GAPDH was used as control (n = 3 biological replicates).
(C and D) Nuclear DNA damage in passage 8 MEFs detected by immunofluorescence (γ-H2AX [red], H2AX [green], 4,6-diamididine-2-phenylindole (DAPI) [blue]), (D) Quantitative analysis of nuclear DNA damage positive cell (n = 3 biological replicates).
(E and F) Micronuclei distribution in passage 8 Trex1−/− MEFs detected by immunofluorescence (dsDNA [red], γ-H2AX [green], 4,6-diamididine-2-phenylindole (DAPI) [blue]); zoom shows an enlarged region of dsDNA, γ-H2AX, and DAPI co-localization in the cytoplasm, (F) Quantitative analysis of Micronuclei positive cell (n = 3 biological replicates).
(G) Expression of DDR and cellular senescence marker proteins at passage 8 MEFs by immunoblotting.
(H) Quantitative analysis of p-RB, p-Chk2, and p16 proteins, with GAPDH as control (n = 3 biological replicates).
(I and J) In passages 8, WT, Trex1−/− MEFs cell cycle was assessed by FACS (n = 3 biological replicates). Data represent mean ± S.E.M. of at least 3 independent experiments. ∗p < 0.05; ∗∗p < 0.01; ∗∗∗p < 0.001, p values were calculated using by one-way ANOVA versus WT with Dunnett’s correction (B, C, F, H, J). For gel source data, see Mendeley Data.
Spontaneous cellular senescence also involves the generation of micronuclei, which resemble satellite nuclei consisting of chromatin surrounded by a nuclear membrane. These micronuclei form in response to genotoxic stress as well as after mis-segregation of DNA during cell division.38 Micronuclei are closely associated with DNA damage and are sensitive biomarkers of genotoxicity39; therefore, we examined the distribution of micronuclei in passage 8 Trex1−/− MEFs by immunofluorescence. Trex1−/− MEFs contained significantly more micronuclei compared with WT MEFs (Figures 2E and 2F).
Classical cellular senescence is primarily regulated by two pathways, namely the DDR pathway37 and the tumor suppressor P16Ink4a pathway.40 Therefore, we next evaluated the changes in protein components of these two pathways in passage 8 Trex1−/− MEFs by immunoblotting (Figures 2G and 2H). p-RB expression was significantly lower in Trex1−/− MEFs than in WT MEFs, whereas the expression levels of p-CHK2 and p16 were significantly higher in Trex1−/− MEFs than WT MEFs. In addition, a greater proportion of passage 8 Trex1−/− MEFs were in cell-cycle arrest (Figures 2I and 2J).
Because oxidative stress is one of the causes of cellular senescence,41 we also examined the level of reactive oxygen species (ROS) in MEFs after Trex1 deletion using the fluorescent probe DCFH-DA by flow cytometry and immunofluorescence. ROS levels in Trex1−/− MEFs were significantly higher than in WT MEFs (Figures S2A–S2D). Studies by others have also confirmed increased levels of ROS generated by TREX1-deficient fibroblasts and keratinocytes in response to UV irradiation.42 Therefore, TREX1 deletion promotes cellular senescence, signified by increased DNA damage and ROS levels.
TREX1 deletion exacerbates cellular senescence induced by multiple factors
Cellular senescence can be affected by diverse factors; therefore, we determined whether TREX1 deletion adds to the effect of these factors on cellular senescence. We induced cellular senescence in 1 or 2 passage Trex1−/− MEFs by treatment with ionizing radiation (IR) or a topoisomerase II inhibitor (etoposide, ETO), both of which cause DNA damage.43,44,45,46 WT and Trex1−/− MEFs were irradiated at 3 Gy and 6 Gy, and expression levels of representative SASP factors were measured by RT-qPCR after three days of culture (Figures 3C–3G). Expression levels of SASP factors were significantly higher in irradiated Trex1−/− MEFs than in WT MEFs, in a dose-dependent manner. We also found elevated SA-β-Gal levels in Trex1−/− MEFs cultured for 6 days after exposure to 6 Gy IR (Figures 3A and 3B). We further explored the effect of IR on micronuclei production as a marker of genotoxicity in WT and Trex1−/− MEFs by immunofluorescence. The results showed that the number of IR-induced micronuclei was significantly higher in Trex1−/− MEFs than in WT MEFs. Of interest, some nuclei in Trex1−/− MEFs also appeared irregular in shape (Figure 3H). We also compared the expression levels of DDR pathway and cellular senescence markers including p-RB, p-CHK2, p21, and γ-H2AX, after IR exposure and observed a further decrease of p-RB, and further increase of p-CHK2, p21, and γ-H2AX in IR-treated Trex1−/− MEFs compared to untreated Trex1−/− MEFs or WT MEFs (Figures 3I and 3J). These data suggest that TREX1 deletion exacerbates IR-induced cellular senescence, manifested as more severe DNA damage and irregular micronuclei in Trex1−/− MEFs. We observed a similar effect of TREX1 deletion on ETO-induced cellular senescence (Figure S3). These results strongly demonstrate that TREX1 deletion accelerates spontaneous cellular senescence induced by IR or DNA damaging drugs.
Figure 3.

TREX1 knockout exacerbates IR-induced cellular senescence in MEFs
Cellular senescence was induced by IR in 1 or 2 passage MEFs derived from E13.5 mouse embryos.
(A) In 1 or 2 passage MEFs were pre-treated with 6 Gy IR for 6 days, then subjected to SA-β-Gal analysis.
(B) Histograms indicate the percentages of SA-β-gal-positive cells (n = 3 biological replicates).
(C–G) Expression level of SASP factors examined by RT-qPCR (n = 3 biological replicates).
(H) Micronuclei distribution of Trex1−/− MEFs were pre-treated with 6 Gy IR detected by immunofluorescence (dsDNA [red], γ-H2AX [green], 4,6-diamididine-2-phenylindole (DAPI) [blue]); zoom shows an enlarged region of dsDNA, γ-H2AX, and DAPI co-localization in the cytoplasm.
(I) Expression of DDR and cellular senescence marker proteins measured by immunoblotting.
(J) Quantitative analysis of p-RB, p-CHK2, p21, and γ-H2AX proteins, with GAPDH as control (n = 3 biological replicates). Data represent mean ± S.E.M. of at least 3 independent experiments. ∗p < 0.05; ∗∗p < 0.01; ∗∗∗p < 0.001, p values calculated using two-way ANOVA with Bonferroni’s correction (B-G, J). For gel source data, see Mendeley Data.
Activation of the cGAS-STING pathway is essential for TREX1 deletion-induced cellular senescence
Previous studies showed that TREX1 deletion leads to DNA accumulation in the cytoplasm and activates the cGAS-STING pathway; the interferon β (IFNβ) immune response signal appears to be a hallmark, as interferon-stimulating genes (ISGs) such as Cxcl10 and Ifi44 are produced downstream of IFNβ activation.28 Therefore, we assessed changes in Cxcl10 and Ifi44 in WT and Trex1−/− MEFs during serial passages by RT-qPCR. Compared with the WT control, Cxcl10 and Ifi44 cytokines from passage 1 Trex1−/− MEF were significantly different. With progressive cell passages Cxcl10 and Ifi44 cytokines tended to increase, followed by a decline in later passages (Figures S4A and S4B). We also noted a simultaneous increase in the expression levels of p-TBK1 and p-IRF3, two majors’ factors downstream of cGAS-STING activation, as shown by immunoblotting (Figures S4C and S4D). Therefore, TREX1 deletion led to cGAS-STING pathway activation, consistent with previous reports.29,42 TREX1 deletion can persistently activate the cGAS-STING pathway and mediate the expression of IFNβ. The induced expression of ISGs along with the reported role of type I IFNs in senescence prompted us to ask if TREX1 deletion-mediated secretion of IFNβ is involved in promoting senescence.16 We found that addition of recombinant IFNβ to cultures of WT MEFs was sufficient to induce p21 expression, SA-β-Gal activity and SASP (Figures S4E–S4G).
Because cGAS plays a major role in cellular senescence,16,47 we asked if TREX1 deletion-induced cellular senescence could be rescued by cGAS knockout. Firstly, we isolated MEFs from Trex1−/−cGas−/− mice and performed cell passaging experiments simultaneously with MEFs of different genotypes from the same period. In comparison, both strains of Trex1−/−cGas−/− MEFs had better value-added ability than WT, Trex1−/− MEFs, but not as good as cGas−/− MEFs (Figure 4A). Examination of SA-β-Gal activity showed that the number of positive cells decreased significantly when cGas was knocked out in Trex1−/− MEF (Figures 4B and 4C). To further determine the role of cGAS in TREX1 deletion-induced cellular senescence, we detected the levels of cytokines (IFNβ, Cxcl10, IL-6, IL-1B etc.) in passage 10 MEFs (Figure 4D), ROS levels (Figures 4E and 4F) and the senescence-related landmark proteins of p-RB, p-CHK2, p-p53, p21, and γ-H2AX were also quantitatively analyzed (Figures 4G and 4H). Compared with Trex1−/− MEFs, we found that Trex1−/−cGas−/− MEFS SASP (IL-6, IL-1B etc.), ROS and senescence-related landmark proteins (p-RB, p-CHK2, p-p53, p21, and γ-H2AX) were significantly decreased. These data strongly suggest that deletion of cGAS can inhibit TREX1 deletion-induced cellular senescence.
Figure 4.

Activation of the cGAS-STING pathway is essential for TREX1 knockout-induced cellular senescence
MEFs were derived from E13.5 mouse embryos.
(A)Proliferation curve of primary WT, Trex1−/−, cGas−/−, and Trex1−/−cGas−/− MEFs cultured under 20% O2.
B) Cellular senescence of WT, Trex1−/−, cGas−/−, Trex1−/−cGas−/− MFEs in 8 passages was analyzed by SA-β-Gal staining.
C) Histograms indicate the percentage of SA-β-gal-positive cells (n = 3 biological replicates).
(D) WT, Trex1−/−, cGas−/−, Trex1−/−cGas−/− MFEs in 10 passages expression of depicted genes was measured via RT-qPCR (n = 3 biological replicates).
(E) ROS levels in WT, Trex1−/−, cGas−/−, Trex1−/−cGas−/− MFEs cells in 8 passages detected by flow cytometry.
(F) Statistical results of flow cytometry (n = 3 biological replicates).
(G) Expression of DDR and cellular senescence marker proteins measured by immunoblotting.
(H) Quantitative analysis of p-RB, p-CHK2, p-p53, p21, and γ-H2AX proteins, with GAPDH as control (n = 3 biological replicates). Data represent mean ± S.E.M. of at least 3 independent experiments. ∗p < 0.05; ∗∗p < 0.01; ∗∗∗p < 0.001, p values were calculated using by one-way ANOVA versus WT with Dunnett’s correction (C, D, F, H). For gel source data, see Mendeley Data.
We next asked if inhibition of the cGAS-SING pathway affects cellular senescence induced by TREX1 deletion. Passage 1 and 2 Trex1−/− MEFs pre-treated with ETO were then treated with the TBK1 inhibitor BX795.48 We evaluated the effect of BX795 on ETO-induced cellular senescence of Trex1−/− MEFs by SA-β-Gal staining (Figures S5A and S5B), RT-qPCR (Figure S5C–S5H) and immunoblotting (Figures S5I and S5J). As shown in (Figure S5), ETO pre-treatment significantly activated the cGAS-STING pathway, whereas BX795 alleviated this activation. In addition, BX795 inhibited the cellular senescence induced by Trex1 deletion, with or without ETO pre-treatment. Collectively, these data suggest that TREX1 deletion-induced cellular senescence involves activation of the cGAS-STING pathway.
Cellular senescence in Trex1 knockout lupus-like mice
Trex1−/− mice have a shortened life span with accelerated appearance of characteristic signs of aging such as arched backs, thinning hair and development of lupus-like disease as early as 4 months of age. Cellular senescence in these mice manifests as diverse histopathologies in various tissues; of these, tissue fibrosis is one of the most important.49 Therefore, we examined fibrosis in the heart and liver of 4-5-month-old WT and Trex1−/− mice by Sirius red staining (Figures 5A and 5B). We observed a large amount of positive staining in the heart and liver of Trex1−/− mice, especially in the heart. Moreover, In the SA-β-GAL staining of mouse kidney tissue, Trex1−/− mice had obvious positive results (Figure 5C). p21 was also at a high level by immunohistochemical analysis (Figure 5D). Immunofluorescence results showed that the signals of γ-H2AX and p16 in Trex1−/− mouse kidneys were stronger, and the distributions were correlated and rounded, like the glomerular structure (Figures 5E and 5F). Trex1−/− mice heart also had higher levels of p-CHK2, p53, p21, and significantly higher γ-H2AX than age-matched WT mice by immunoblotting (Figures 5G and 5H). To better characterize aging in different tissues of Trex1−/− mice, we analyzed the expression of IFNβ, ISGs (Cxcl10, Ifi44, Isg15), SASP (IL-6, IL-1β), and age-related landmark proteins (p16, p19, p21, Gadd45b, Atf3, Btg2) using RT-qPCR. We found that high levels of SASP were detected in different organs including heart (Figures 5I and 5J), kidney (Figures S6A and S6B), liver (Figures S6C and S6D), lung (Figures S6E and S6F), and muscle (Figures S6G and S6H) of Trex1−/− mice compared with mice of the same age. Taken together, these data indicate that Cellular senescence in Trex1 knockout lupus-like mice.
Figure 5.

Cellular senescence in Trex1 knockout lupus-like mice
4-5-month-old WT and Trex1−/− lupus-like mice were compared.
(A and B) Heart (A) and liver (B) fibrosis were examined by Sirius red staining.
(C) Representative images of SA-β-gal staining on kidney from WT, Trex1−/− mouse.
(D) Immunohistochemistry representative images of p21 on kidney from WT, Trex1−/− mouse.
(E and F) Representative images of γ-H2AX and p16 in sit hybridization with immunofluorescence of kidney, (F) Quantitative analysis of γ-H2AX and p16 positive cell (n = 3 biological replicates).
(G) Expression of p-CHK2, p53, p21 and γ-H2AX in the heart was measured by immunoblotting.
(H) Quantitative analysis of p-CHK2, p53, p21 and γ-H2AX with GAPDH as control (n = 3 biological replicates).
(I and J) mRNA expression of IFNβ, ISGs, SASP factors, and aging marker proteins in the heart by RT-qPCR (n > 6 biological replicates). Data represent mean ± S.E.M. of at least 3 independent experiments. ∗p < 0.05; ∗∗p < 0.01; ∗∗∗p < 0.001, p values were calculated using by one-way ANOVA versus WT with Dunnett’s correction (A–D, F, H–J).
BML-277 alleviates lupus-like phenotypes in Trex1−/− mice
The role of cellular senescence in the development and progression of type I interferonopathies and lupus-like disease is unknown. Our data suggests that the DDR plays an essential role in TREX1 deletion-induced cellular senescence. We therefore assessed whether inhibition of DDR, specifically inhibition of CHK2 within the DDR pathway, could alleviate the development of type I interferonopathies or lupus-like disease in mice with TREX1 deletion. Trex1−/− mice 6 to 8 weeks of age were given a daily dose of 1 mg/kg BML-27750 or solvent (5% DMSO 10% PEG300 2.5% Tween-80 in PBS) control by intraperitoneal injection for 4 weeks. Previous study showing BML-277 alleviated T cell apoptosis induced by IR.51 We examined the muscle tissue p-CHK2 levels in BML-277-treated Trex1−/− mice by WB, compared to the down-regulated p-CHK2 levels in Trex1−/− mice after treatment (Figures S7A and S7B). Trex1−/− mice treated with BML-277 showed significant body size increase, shiny hair, and weight improvement (Figures 6A and 6B). The size and weight of the spleen were also significantly reduced compared with the untreated control group (Figures 6C and 6D). Inflammation noted in multiple organs of untreated Trex1−/− mice including the heart, kidney, lung, and muscle was significantly alleviated by BML-277 treatment (Figure 6E). Sustained high levels of autoantibodies are an important hallmark of lupus-like disease; we therefore examined the production of autoantibodies in Trex1−/− mice treated with BML-277 (Figures 6F–6I). Strikingly, multiple autoantibodies including anti-dsDNA IgG1 (Figure 6F), anti-SSDNA IgG (Figure 6G), anti-ANA Total Ig (Figure 6H), and anti-NRNP IgG (Figure 6I) were significantly decreased by BML-277 treatment. In addition, elevated levels of ISGs including IFNβ, Cxcl10, Ifit3; SASP factors such as IL-6 and Mmp12; and age-related landmark proteins p16, were reduced in the heart (Figures S7C and S7D), kidney (Figures S7E and S7F), lung (Figures S8A and S8B), and liver (Figures S8C and S8D) of Trex1−/− mice treated with, relative to their wild-type littermates. These data strongly demonstrate that inhibition of DDR-induced cellular senescence can significantly alleviate TREX1 deletion-induced lupus-like phenotypes in mice.
Figure 6.

BML-277 alleviates lupus-like phenotypes in Trex1-/- mice
Trex1−/− mice 6 to 8 weeks of age were given a daily dose of 1 mg/kg BML-277 or solvent (5% DMSO 10% PEG300 2.5% Tween-80 in PBS) control by intraperitoneal injection for 4 weeks (n > 6 per group).
(A) Representative treated mouse body size.
(B) Body weight in treated and untreated WT and Trex1−/− mice.
(C) Representative treated mouse spleen.
(D) Spleen weight in treated and untreated WT and Trex1−/− mice.
(E) Representative plots of H&E analyses of heart, kidney, lung, and skeletal muscle.
(F–I) Levels of autoantibodies in mouse serum determined by ELISA, (F) anti-dsDNA IgG1, (G) anti-ssDNA IgG, (H) anti-ANA Total Ig, and (I) anti-nRNP IgG. Data represent mean ± S.E.M. of at least 3 independent experiments. ∗p < 0.05; ∗∗p < 0.01; ∗∗∗p < 0.001, p values calculated using two-way ANOVA with Bonferroni’s correction (B, D, F–I).
Spontaneous T cell activation plays an important role in autoimmune diseases,29 so we further evaluated T cell activation in the spleen of Trex1−/− mice treated with BML-277 using flow cytometry. Levels of CD69 in CD4+ and CD8+ T cells of Trex1−/− mice were significantly increased, and Ly6c were reduced, after BML-277 treatment (Figures 7A–7C). We also analyzed the expression levels of CD44hiCD62Llo as a marker of effector memory T cells among CD4+ and CD8+ T cells in Trex1−/− mice. We found that Trex1−/− mice had significantly more effector memory T cells compared to their WT littermates, and that the levels were significantly suppressed by BML-277 treatment (Figures 7D and 7E). These findings provide further evidence that BML-277 treatment can alleviate the autoimmune phenotype of Trex1−/− mice.
Figure 7.

BML-277 inhibits T cell activation in Trex1−/− mice
(A–E) Trex1−/− mice 6 to 8 weeks of age were given a daily dose of 1 mg/kg BML-277 or solvent (5% DMSO 10% PEG300 2.5% Tween-80 in PBS) control by intraperitoneal injection for 4 weeks (n > 6 per group). Representative flow-cytometric plots and quantification of the frequency of (A) activated CD4+ T cells, (B) activated CD8+ T cells, (C) Ly6c CD8+, (D) CD4+ memory T cells, and (E) CD8+ memory T cells. Data represent mean ± S.E.M. of at 2 independent experiments. ∗p < 0.05; ∗∗p < 0.01; ∗∗∗p < 0.001, p values calculated using two-way ANOVA with Bonferroni’s correction (A–E).
Discussion
As a major exonuclease in mammalian cells, TREX1 prevents the abnormal activation of the innate immune system in the host because of DNA accumulation.25 In clinical research, TREX1 gene mutations have been associated with a variety of autoimmune diseases or type I interferonopathies, and Trex1 knockout mice also show a variety of lupus-like disease phenotypes.24,25 Currently, JAK1/2 inhibitors are used clinically to treat autoimmune diseases or type I interferonopathies caused by TREX1 gene mutations.52 We and others have previously shown that knockout of either cGAS or STING gene can rescue lethal autoimmune phenotypes in Trex1-deficient and mutant mice,28,29 suggesting that the development of small-molecule inhibitors targeting cGAS and STING may be an effective strategy for the treatment of autoimmune diseases. Thus far, several cGAS/STING inhibitors have shown good therapeutic effects in mouse autoimmune disease models, identifying new drug targets and candidate molecules for further clinical development of autoimmune disease therapeutics.53,54 However, cGAS also plays an essential role in cellular senescence, suggesting a connection between cellular senescence, inflammation, and autoimmune responses including autoantibody production.
Investigating the mechanisms underlying the role of cellular senescence in the TREX1 deletion-mediated lupus-like phenotype is a topic of intense interest, particularly whether cellular senescence caused by TREX1 gene dysfunction directly leads to lupus-like phenotypes, or if they are indirectly related. The present study demonstrated that deletion of the TREX1 gene accelerates cellular senescence, which can be alleviated by inhibition of cGAS-STING pathway. The cGAS-STING pathway response is likely enhanced by the loss of TREX1 exonuclease-mediated degradation of cytoplasmic DNA as damaged DNA fragments enter the cytoplasm in the form of micronuclei. In general, lupus-like autoimmune diseases are primarily treated by suppressing inflammation and the autoimmune response. Notably, cellular senescence is present in Trex1-deficient lupus-like mice, an aspect of the pathology that has often been neglected in previous studies. Here, we found that activation of the cGAS-STING pathway is necessary to maintain TREX1 deletion-induced cellular senescence. Because the deletion of the cGAS gene rescued not only the lupus-like phenotype, but also the cellular senescence phenotype in Trex1−/− mice, our data suggest that cellular senescence caused by TREX1 gene dysfunction are indirectly related to lupus-like phenotypes. Then, one question may be raised is if DNA damage triggers γ−H2AX which in turn activates cGAS on leakage of damaged DNA in the cytoplasm and micronuclei leading to the downstream activation of γ-H2AX, then why does cGAS inactivation reduces γ-H2AX? One explanation might be that because of the presence of cGAS, DNA free in the cytoplasm continuously activates the cGAS-STING pathway, mediating the production of large amounts of ISG and inflammatory factors. These cytokines will cause a rise in ROS and further aggravate DNA damage, a process that is mutually cyclic and facilitative. However, the deletion of cGAS prevents this process from occurring, and therefore cGAS KO will reduce γ-H2AX production. In the other hand, because cGAS has mutiple functions, cGAS deficiency may either cause cell death or accelerate cell proliferation. We believe that cGAS deficiency is more likely to induce cell proliferation because we did not find evidence that cGAS KO leads to cell death, and most published reports also suggest that cGAS deficiency is more favorable for cell proliferation and low expression of inflammatory factors.16,47
In most cases cGAS is present in the cytoplasm, whereas DDR occurs in the nucleus. However, it has been shown that nuclear cGAS can bind to replication forks during cell replication to affect the replication rate of the cell.55 Our available evidence only demonstrates that activation of the cGAS-STING pathway affects γ-H2AX expression, and the extended idea of whether cGAS in the nucleus is involved in DDR is unclear or if cGAS works as an upstream determinant of DDR pathway needs to be further studied. In the study, TBK1 inhibitor, which blocks activation of the cGAS-STING pathway, can suppress cellular senescence in Trex1−/− mice, but this effect cannot be uncoupled from its role in suppressing inflammation and the autoimmune response. Therefore, we focused on inhibition of the DDR pathway to block cellular senescence and alleviate lupus-like disease phenotypes.
Currently, two strategies are used to inhibit senescence: “senolytics” are used to eliminate senescent cells and “senomophics” are used to eliminate the harmful effects of intercellular communication, including by SASP factors.56 Senescent cells often upregulate negative regulators of apoptosis, including members of the BCL-2 family, to resist apoptosis. Thus, the anti-aging drugs ABT-737 and ABT-263 inhibit the activity of BCL-2 family members, thereby causing apoptosis in senescent cells.57 Antisense oligonucleotides (ASOs) specifically inhibit DDR-stimulating sequences; ASOs effectively reduced DDR activation and SASP factor release in a mouse model of Hutchinson-Gilford progeria syndrome.58 Of note, activation of the DDR pathway correlates with SASP, with ATM/ATR, CHK2, and p53 as the main activated genes (Figure S9A). In the present study, we asked if inhibition of these targets could slow the release of SASP. KU-60019 (ATM inhibitor, IC50 is show in Figure S9B) and VE-821 (ATM/ATR inhibitor, IC50 is show in Figure S9C) did not reduce ISG expression Trex1−/− MEFs, but rather increased it (Figure S9H). It is likely that inhibition of ATM and ATR function led to inefficient DNA repair, thus indirectly aggravating the degree of DNA damage. Treatment of Trex1−/− MEFs with the p53 repressors Pifithrin-α (IC50 is show in Figure S9F) and Pifithrin-μ (IC50 is show in Figure S9G) likewise increased the expression of ISGs (Figure S9J). It has been reported that inhibition of p53 further enhances SASP factor expression, which may contribute to the generation of an inflammatory microenvironment prone to senescence escape and malignant transformation.59 Cellular senescence is a chronic inflammatory process that affects the function of the organism through secretion of autocrine and paracrine factors,7,8 thus, inhibitors of ATM/ATR and p53 may not be ideal for rescuing cellular senescence. In contrast, treatment of Trex1−/− MEFs with BML-277(CHK2 inhibitor, IC50 is show in Figure S9D) and Rabusertib (CHK1 inhibitor, IC50 is show in Figure S9E), a selective inhibitor of CHK2, had no effect on expression of ISGs (Figure S9I). Thus, CHK2 might be a promising target for inhibiting the DDR pathway and rescuing cellular senescence, given that it has no effect on DNA repair. We treated Trex1−/− mice with BML-277, with fascinating results: both markers of cellular senescence and lupus-like phenotypes of Trex1−/− mice were alleviated. Thus, inhibiting the DDR pathway can mitigate lupus-like phenotypes, possibly by slowing down cellular senescence, but also by eliciting changes in the inflammatory environment, the interaction of senescent cells with the immune system, and the transformation of various tissues, organs, systems in lupus-like diseases. It would be intriguing to explore how this systematic and complex process is regulated, and if other types of anti-aging drugs can also be used to alleviate the onset of lupus-like diseases in the future.
Another unanswered question is how phenotypes differ in aging and lupus-like diseases. At the cellular level, senescent cells show high levels of SASP factor expression, whereas lupus-like diseases also show high levels of inflammatory factors, most of which overlap each other. We found that cellular senescence is accompanied by reduced genomic stability, with high levels of γ-H2AX in the heart of Trex1−/− mice (Figure 5G). The most characteristic features of lupus-like disease are the maintenance of high levels of autoantibodies and the spontaneous over-activation of the immune system. Senescent cells can affect the tissue microenvironment through both autocrine and paracrine signaling. Specific SASP chemokines can attract different subsets of immune cells including NK cells, neutrophils, dendritic cells, monocytes/macrophages, B cells, and T cells.56,60 Of these cell types, NK cells, T cells, and macrophages can interact with senescent cells under pathological and physiological conditions.56,61 This response is mediated by SASP factors and a direct interaction between immune cells and senescent cells. The immune system monitors and removes senescent cells, limiting the development of precancerous cells and pathological fibrosis. However, the persistent release of SASP factors from senescent cells can lead to infection, increased autoimmune susceptibility, and the development of malignant tumors.56 An aged immune system drives senescence and aging of solid organs, as can increased autoimmune susceptibility.62 It is therefore difficult to draw a clear line between aging and lupus-like phenotypes, which have distinct characteristics but also intersect with each other.
Therapy of certain cancers with checkpoint inhibitors, given in addition to radiation therapy or chemotherapy, has been shown to improve outcomes.63,64 However, a feared side effect is autoimmunity, in particular in patients with preexisting autoimmune diseases. It is well known that radiation therapy and some chemotherapy drugs can cause DNA damage and thus cause cancer cell death. During this process the cells will initiate a DDR response to repair the damaged DNA to save themselves, thus counteracting the effects of radiotherapy and chemotherapy. Therefore, DDR inhibitors are invoked in the treatment of cancer to inhibit the DDR response to enhance the effect of radiotherapy and chemotherapy. Therefore, the combined use of checkpoint inhibitors and DDR inhibitors in cancer treatment is conceivable. However, this combination if overly aggressive often leads to over activation of the immune system, which causes a storm of inflammatory factors detrimental to patient treatment.65 How do we overcome this aspect if the DDR inhibitors would literally be used for treating the autoimmune phenotypes, particularly when present in cancer patients? In fact, the strategy described in our study for the use of checkpoint inhibitors for the alleviation of lupus-like disease differs from the regimen of using radiotherapy in combination with checkpoint inhibitors in oncology treatment. Firstly, we found that deletion of trex1 accelerated the cellular senescence and focused on the role of DDR in this process as also shown by others in human AGS cells.23 We intent to develop new strategies for the treatment of lupus-like phenotype, i.e. whether the treatment of lupus-like phenotypes can be achieved by alleviating cellular senescence.56 Notably, DDR is not only involved in the DNA repair process, but also mediates cell-cycle arrest. As described in our study, the aim is to prevent the onset of cell-cycle arrest without affecting DNA repair. To this end we screened for DDR targets, we found that not all DDR targets are suitable for use in Trex1−/− mice. We eventually selected CHK2 as the target for DDR inhibition for the treatment of Trex1−/− mice and attained good feedback as described above. We will construct Trex1−/− (or mutant ones)/CHK2−/− double knockout mice to further understand the CHK2 role in TREX1 defects.
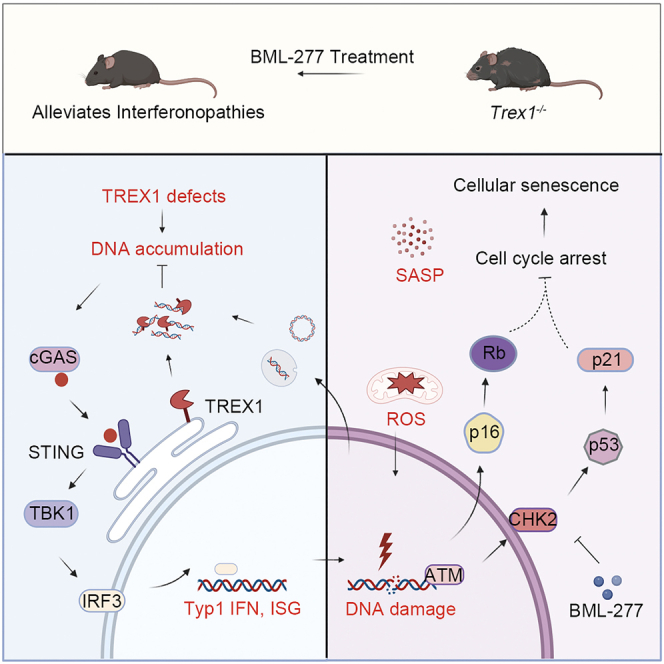
In summary, we demonstrated accelerated cellular senescence in a Trex1−/− mouse, and that inhibition of the DDR pathway can partially alleviate the autoimmune phenotype in these mice. cGAS may interact with the DDR pathway to regulate cellular senescence, because activation of the cGAS-STING pathway can lead to the IFNβ release and production of inflammatory factors and chemokines, many of which overlap with SASP factors. These factors, together with ROS, can cause instability of the genome, which activates the DDR pathway, mediates cell-cycle arrest, and ultimately leads to cellular senescence. A model of TREX1 deletion-induced cellular senescence and its role in lupus-like diseases is shown in graphical abstract. In this model, inhibitors of the cGAS-STING pathway and the DDR pathway can alleviate cellular senescence, which plays an essential role in lupus-like phenotypes and type I interferonopathies. Our studies provide an insight into the mechanisms driving the development of lupus-like diseases or type I interferonopathies and may provide new strategies for developing targeted treatments.
Limitations of the study
We describe the induction of cellular senescence in the absence of TREX1 and its effects on cellular function and health, and demonstrate that the cGAS-STING pathway and DNA damage response play an important role in TREX1 deletion-induced cellular senescence. Treatments with a CHK2 inhibitor (BML-277) attenuate type I interferonopathies and lupus-like phenotypes present in Trex1−/− mice. However, how CHK2 affects Trex1−/− mouse disease progression in vivo required further studies. We need the Trex1−/−Chk2−/− mouse model to explore the underlying mechanisms. Aging of the immune system plays an important role in the abnormalities of the immune system. Although we demonstrated the presence of multi-organ senescence in Trex1−/− mice, however, it is unknown whether there is immune system senescence in Trex1−/− mice and whether it affects disease progression; these questions also need to be further addressed.
STAR★Methods
Key resources table
| REAGENT or RESOURCE | SOURCE | IDENTIFIER |
|---|---|---|
| Antibodies | ||
| Rabbit monoclonal anti-cGAS (D3O8O) | Cell Signaling Technology | Cat# 31659; RRID: AB_2799008 |
| Rabbit monoclonal anti-STING | Cell Signaling Technology | Cat# 80231; RRID: AB_2799947 |
| Rabbit monoclonal anti-TBK1 | Cell Signaling Technology | Cat#3504; RRID: AB_2255663 |
| Rabbit monoclonal anti-IRF3 | Cell Signaling Technology | Cat# 4302; RRID: AB_1904036 |
| Rabbit monoclonal anti-Phospho-TBK1/NAK (Ser172) (D52C2) | Cell Signaling Technology | Cat# 5483; RRID: AB_10693472 |
| Rabbit monoclonal anti-Phospho-IRF-3 (Ser396) (4D4G) | Cell Signaling Technology | Cat# 4947; RRID: AB_823547 |
| Rabbit monoclonal anti-Rb (D20) | Cell Signaling Technology | Cat# 9313;RRID: AB_1904119 |
| Rabbit monoclonal anti-Phospho-Rb (Ser807/811) | Cell Signaling Technology | Cat# 9308; RRID: AB_331472 |
| Mouse monoclonal anti-p53 (1C12) | Cell Signaling Technology | Cat# 2524; RRID: AB_331743 |
| Rabbit monoclonal anti-Phospho-p53 (Ser15) | Cell Signaling Technology | Cat# 9284; RRID: AB_331464 |
| Rabbit monoclonal anti-Histone H2A.X (D17A3) | Cell Signaling Technology | Cat# 7631; RRID: AB_10860771 |
| Rabbit monoclonal anti-Phospho-Histone H2A.X (Ser139) (20E3) | Cell Signaling Technology | Cat# 9718; RRID: AB_2118009 |
| Mouse monoclonal anti-Phospho-Histone H2A.X (Ser139) (D7T2V) | Cell Signaling Technology | Cat# 80312; RRID: AB_2799949 |
| Rabbit monoclonal recombinant anti-CDKN2A/p16INK4a | Abcam | Cat# ab211542; RRID: AB_2891084 |
| Rabbit monoclonal recombinant anti-p21 antibody | Abcam | Cat# ab188224; RRID: AB_2734729 |
| Rabbit monoclonal recombinant anti-CHK2 antibody | Abcam | Cat# ab7433 |
| Rabbit monoclonal anti-phospho-Chk2 (T68) | Abcam | Cat# ab85743; RRID: AB_10858765 |
| Rabbit Polyclonal anti-Tubulin | Proteintech | Cat# 11224-1-AP; RRID: AB_2210206 |
| Mouse monoclonal anti-GAPDH | Proteintech | Cat# 60004-1-Ig; RRID: AB_2107436 |
| Mouse monoclonal anti-dsDNA | Santa Cruz Biotechnology | Cat# sc-58749; RRID: AB_783088 |
| Mouse monoclonal anti-TREX1 | BD Biosciences | Cat# 611986; RRID: AB_399407 |
| Goat anti-Rabbit IgG H&L (IRDye® 800 CW) | Abcam | Cat# ab216773; RRID: AB_2925189 |
| Goat anti-Mouse IgG H&L (IRDye® 680RD) | Abcam | Cat# ab216776; RRID: AB_2933974 |
| Goat anti-Rabbit IgG (H + L) Highly Cross-Adsorbed Secondary Antibody, Alexa Fluor™ Plus 488 | Thermo Fisher Scientific | Cat# A32731; RRID: AB_2633280 |
| Goat anti-Mouse IgG (H + L) Cross-Adsorbed Secondary Antibody, Alexa Fluor™ 594 | Thermo Fisher Scientific | Cat# A-11005; RRID: AB_2534073 |
| Armenian Hamster monoclonal anti-mouse CD3epsilon Brilliant, Violet 421 | BioLegend | Cat# 100341; RRID: AB_2562556 |
| Rabbit monoclonal anti-Mouse CD4, PE-Cy7 | BD Biosciences | Cat# 561099; RRID: AB_2034007 |
| Rabbit monoclonal anti-Mouse CD8, BB515 | BioLegend | Cat# 564422; RRID: AB_2738801 |
| Armenian Hamster monoclonal anti-Mouse CD69, BV711 | BD Biosciences | Cat# 740664; RRID: AB_2740352 |
| Rabbit monoclonal anti-Mouse Ly6c Brilliant Violet 785(TM) | BioLegend | Cat# 128041; RRID: AB_2565852 |
| Rabbit monoclonal anti-Mouse CD44 APC | BD Biosciences | Cat# 559250; RRID: AB_398661 |
| Rabbit monoclonal anti-Mouse CD62L PE | BD Biosciences | Cat# 553151; RRID: AB_394666 |
| Chemicals, peptides, and recombinant proteins | ||
| KU-60019 | Selleck | S1570 CAS: 925701-49-1 |
| VE-821 | Selleck | S8007 CAS: 1232410-49-9 |
| Rabusertib | Selleck | LY2603618 CAS: 911222-45-2 |
| BML-227 | Selleck | S8632 CAS: 516480-79-8 |
| Pifithrin-α (PFTα) HBr | Selleck | S2929 CAS: 63208-82-2 |
| Pifithrin-μ | Selleck | S2930 CAS: 64984-31-2 |
| Etoposide | MCE | HY-13629 CAS: 33419-42-0 |
| BX795 | MCE | HY-10514 CAS: 702675-74-9 |
| IFN-beta Protein, Human, Recombinant | SinoBiologicl | 10704-HNAS |
| Critical commercial assays | ||
| T-PER™ Tissue protein Extraction Reagent | Thermo Fisher Scientific | 78510 |
| Pierce Protease and Phosphatase Inhibitor Mini (without EDTA) | Thermo Fisher Scientific | A32961 |
| Cell Counting Kit-8 | MCE | HY-K0301 |
| Mouse anti-dsDNA IgG1-specific ELISA Kit, 96 tests, Quantitative | Alpha Diagnostics International | 5120-1 |
| Mouse Anti-ssDNA IgG-specific ELISA Kit, 96 tests, Quantitative | Alpha Diagnostics International | 5320 |
| Mouse Anti-Nuclear Antigens (ANA/ENA) Ig’s ELISA Kit, 96 tests, Quantitative | Alpha Diagnostics International | 5210 |
| Mouse Anti-nRNP IgG ELISA Kit, 96 tests, Quantitative | Alpha Diagnostics International | 5415 |
| PrimeScript™ RT reagent Kit with gDNA Eraser (Perfect Real Time) | Takara | RR047B |
| TB Green® Premix Ex Taq™ II (Tli RNaseH Plus) | Takara | RR820B |
| DCFDA/H2DCFDA | Beyotime | S0033S |
| Pierce BCA protein Assay Kit | Beyotime | P0010S |
| Deposited data | ||
| RNA-sqe Raw data | This paper | GSE226512 |
| Gel source data | This paper | https://data.mendeley.com/datasets/twy2gg3kgd/draft?a=c3aa8057-8c00-4383-ba64-3ce132169ca3 |
| Experimental models: Cell lines | ||
| WT MEFs | This paper | N/A |
| Trex1−/− MEFs | This paper | N/A |
| Trex1D18N MEFs | This paper | N/A |
| Trex1P212fs MEFs | This paper | N/A |
| cGas−/− MEFs | This paper | N/A |
| Trex1−/−cGas−/− MFEs | This paper | N/A |
| Experimental models: Organisms/strains | ||
| WT C57BL/6 mouse | This paper | N/A |
| Trex1−/− C57BL/6 mouse | This paper | N/A |
| Oligonucleotides | ||
| qPCR primers for mRNA validation, Table S1 | This paper | N/A |
| Software and algorithms | ||
| ImageJ | NIH | https://imagej.nih.gov/ij/ |
| GraphPad prism | GraphPad Software | https://www.graphpad.com/ |
| FlowJo | FlowJo | https://www.flowjo.com/ |
Resource availability
Lead contact
Further information and requests for resources and reagents should be directed to and will be fulfilled by the lead contact, Qi Chen (chenqi@fjnu.edu.cn)
Materials availability
All materials used in this study are either commercially available or through collaboration, as indicated.
Experimental model and study participant details
Cell lines
MEFs were generated from embryonic day 13.5 (E13.5) embryos of WT, Trex1−/−, cGas−/−, Trex1−/−cGas−/− mutant mice. Cell culture reagents were purchased from ThermoFisher Scientific (CA, USA) unless otherwise indicated. Primary MEFs, spontaneously immortalized MEFs, in Dulbecco’s modified Eagle’s medium (DMEM) plus 10% (v/v) FBS, 2 mM L-glutamine, 10 mM HEPES and 1 mM sodium pyruvate (complete DMEM) with the addition of Pen-Strep and cultured at 37°C with 5% CO2. MEFS were not tested for sex.
Animal experiments
Trex1−/−, cGas−/−, Trex1−/−cGas−/−, Trex1D18N, Trex1P212fs genetically modified mice on the C57BL/6 background were generated with CRISPR-Cas9 technology. Briefly, the Cas9 protein and the D18 N sgRNA were co-injected into the zygotes from C57BL/6 with an 120bp oligo DNA containing the D18N point mutation sequence. cGas−/− mice were created by the CRISPR-Cas9 knockout technology on C57BL/6 background. The sequences of the D18N and cGas single-guide RNA were as follows: sgD18N CCACTGGCCTGCCTTCGTCT and sgcGas CCTTACGACTTTCCGCGCCT29。Trex1P212fs mouse (unpublished, Amino acid codon CCA at 212th of TREX1 protein was modified to CA). Briefly, the Cas9 protein and the P212fs sgRNA were co-injected into the zygotes from C57BL/6 with an 120bp oligo DNA containing the P212fs point mutation sequence. The sequences of the P212fs single-guide RNA were as follows: sg GCCACAGGCCCTACTGCAGT.) which resulted in a frameshift mutation of the Trex1 gene (Figure S1B). C57BL/6 WT mice were purchased from Shanghai SLAC Experimental Animal Company (China). Male and female mice 6 to 8 weeks of age were randomly allocated for all experiments. The efficacy study in Trex1−/− mice was conducted as follows: mice (aged 6–8 weeks) were administered with vehicle (5% DMSO 10% PEG300 2.5% Tween-80 in PBS) or BML-277(1mg kg−1 bodyweight) in 200 μL PBS (containing 5% DMSO, 10% PEG300, and 2.5% Tween-80) once every day for 30 consecutive days. Mice were euthanized via anaesthetization in a CO2 chamber, followed by cervical dislocation. All mice were bred and maintained under specific pathogen-free conditions in the Animal Facility of Fujian Normal University according to the animal care procedures approved by the Animal Ethical and Welfare Committee of Fujian Normal University and Fujian Provincial Office for Experimental Animals.
Method details
Immortalization of MEFs
MEFs were generated from embryonic day 13.5 (E13.5) embryos of WT, Trex1−/−, cGas−/−, Trex1−/−cGas−/− mutant mice under the normal culture conditions that includes 20% oxygen and 5% CO2. For spontaneous immortalization, we followed a modified 3T3 protocol by seeding 1 × 10⁶ cells in a 10-cm dish every 3.5 days.35 Aliquots of the cells at indicated passages were expanded for continuous serial passaging, frozen in liquid nitrogen, or analyzed by β-Gal staining, RT-qPCR and Immunoblot analysis.
SA-β-gal staining
Senescence was induced by spontaneous immortalization, etoposide treatment, or irradiation. Senescent cells were identified by a senescence-associated β-galactosidase kit (Beyotime, Shanghai, China) according to the manufacturer’s protocol. For senescence induced by spontaneous immortalization, MEFs during serial passages were harvested and fixed for SA-β-Gal staining. For etoposide-induced senescence, immortalized MEFs were treated with 10 μM etoposide for 24 h and cultured in normal medium for another 5 days. For IR experiments, MEFs were irradiated with 3 Gy and 6 Gy using an X-ray irradiator. The cells were harvested on day 6 for SA-β-Gal assays. Fresh tissues from 5-month-old WT, Trex1−/− and littermate controls were fixed in 4% Paraformaldehyde for 12 h and then transferred to 30% sucrose overnight. Tissues were then embedded in cryo-embedding medium (OCT) and cryosectioned at 8 μm for staining of SA-β-gal (pH 6.0) at 37°C for 16–24 h in SA-β-gal staining solution. Slides were imaged at 10× with upright microscope (ZEISS).
RNA isolation and real-time quantitative PCR
Total RNA of cells and tissues was extracted by using TRIzol reagent (Takara Dalian, China) according to the manufacturer’s instructions and subjected to reverse transcription with the cDNA Synthesis Kit (Takara Dalian, China). Gene transcripts were measured by real-time quantitative PCR using FastStart Universal SYBR Green Master (Rox) (Roche, Basilea, Switzerland). The thermocycling conditions were as follows: 95°C for 10 min; 40 cycles of 95°C for 15 s, 58°C for 30 s, and 72°C for 30 s. PCR primers used are listed (Table S1).
RNA sequencing
RNA was isolated from the passages 1 WT, Trex1−/−, Trex1D18N, Trex1P212fs MEFs using the TRIzol reagent (Takara Dalian, China). After the total RNA was extracted, the mRNA was enriched with magnetic beads with Oligo(dT), fragmented, cDNA synthesized, and purified by QiaQuick PCR kit (Qiagen, Dusseldorf, Germany). Then, the target size fragments were recovered by agarose gel electrophoresis, and PCR amplification was performed to constract the library. The constructed library was sequenced with Illumina HiSeq2000. Sequencing data were processed using HTSstation online software from the Bioinformatics and Biostatistics Core Facility (EPFL). Heat maps were produced from normalized expression data using Cluster 3.0 for computation and JTreeview for visualization.
Immunoblot analysis
Cells were collected and resuspended in lysis buffer (50 mM Tris-Cl, pH 7.5, 150 mM NaCl, 1 mM EDTA, 0.5 mM EGTA, 10% Glycerol, 0.5%NP40) supplemented with protease and phosphatase inhibitors (ThermoFisher). Cell lysates were then centrifuged at 14,000 rpm for 10 min at 4°C and the supernatants were collected for immunoblotting. The total protein concentration was determined by the BCA protein assay kit (Beyotime). Equal amounts of protein samples were subjected to SDS-PAGE, followed by transfer to polyvinylidene difluoride (PVDF) membranes (Merck, Darmstadt, Germany) using a semi-dry transfer system (Bio-Rad, CA, USA). The PVDF membranes were blocked with 5% non-fat milk in TBST for 1 h at room temperature and incubated with the indicated antibodies. Membranes were probed with primary antibodies as follows: cGAS (1:1000 dilution), STING(1:1000 dilution), TBK1(1:1000 dilution), p-TBK1(1:1000 dilution), IRF3(1:1000 dilution), p-IRF3(1:1000 dilution), TREX1(1:5000 dilution), RB (D20) (1:1000 dilution), p-RB (1:1000 dilution), CHK2 (1:1000 dilution), and p-CHK2 (phospho T68) (1:1000 dilution), p53(1:1000 dilution), p-p53(1:1000 dilution), p21(1:1000 dilution), p16(1:1000 dilution), H2AX(1:1000 dilution), γ-H2AX(1:1000 dilution), GAPDH(1:5000 dilution), Tubulin(1:5000 dilution). The membranes were then washed with TBST buffer three times and incubated with Goat anti-Rabbit IgG H&L (IRDye 800 CW, ThermoFisher) preabsorbed ab216773 and anti-mouse IgG H&L (IRDye 680 CW, ThermoFisher) preabsorbed ab216776 secondary antibodies at 1:10,000 dilution for 1 h at room temperature. The protein signals were analyzed by luminescence.
Cell cytotoxicity assay
Cell viability was determined using CCK-8 Kit (TransGen Biotech, Beijing, China) according to the manufacturer’s protocol. Briefly, cells (100 μL/well, 1 × 10⁴ cells/ml) were seeded on 96-well plates for 24 h, then treated with or without different concentrations of various inhibitors and incubated at 37°C for different times. CCK-8 solution was added to each well of the plates, followed by incubation at 37°C for 1 h. The optical density (OD) was measured at 450 nm using an enzyme-labeled instrument (BMG. FLUO star Optima, Offenburg, Germany). The cell inhibitory rate was calculated by using the following equation:
Cell inhibitory rate = [1 − (OD experiment − OD blank)/(OD control − OD blank)] × 100%.
All experiments were performed in triplicate and repeated three times independently.
Fluorescence microscopy
Passage 8 MEFs during spontaneous aging or MEF cells treated with etoposide or IR were immunofluorescence with an antibody against dsDNA or γ-H2AX according to published protocols.47 Briefly, cells were fixed with 4% paraformaldehyde and permeabilized with 0.1% Triton X-100 for 15 min at room temperature. After blocking with 5% BSA in PBS, cells were stained with a primary antibody against dsDNA or γ-H2AX, followed by a goat anti-mouse IgG conjugated with Alexa Fluor 568 or 633. Nuclei were stained with DAPI in the mounting medium (Vectashield). Images were captured using a Zeiss LSM700 confocal microscope and processed with a Zeiss LSM image browser.
Flow cytometry
Spleens from the indicated mice were collected and dissociated, followed by filtering through a cell strainer in PBS with 1% FBS. Cells were collected by centrifugation at 1500 rpm for 5 min, red blood cells were removed by red blood cell lysis buffer, and the remain cells were resuspended and incubated with antibodies (CD3-BV421, CD4-PECy7, CD8-BB515, CD69-BV711, Ly6c-BV786, CD44-APC, CD62L-PE, all from BD Biosciences) on ice in the dark (or wrap in foil) for 20 min. The strained cells were resuspended in PBS and analyzed with FACSymphony™ A5 instrument (BD Biosciences).
Quantification and statistical analysis
Each representative graph is the result of at least three independent experiments. For microscopic pictures, at least three different field pictures were taken for each sample in each independent experiment. The number of cells counted was determined according to the magnification of the microscope, and in principle was not less than 100 cells. Prism software (Graphpad Software) was used to perform statistical tests and to generate graphs. Statistical significance was determined by one-way ANOVA versus WT with Dunnett’s correction or by two-way ANOVA with Bonferroni’s correction. Values of ∗p < 0.05; ∗∗p < 0.01; ∗∗∗p < 0.001 were considered statistically significant. Data are represented as means ± S.D. or S.E.M. No statistical methods were used to predetermine sample sizes. Sample sizes were instead determined based on previous experimental experience or based on general practices in the field. Replicates are biological replicates. For the in vivo studies, mice were randomly allocated to groups. For histological analysis of tissues, experimenters were blinded to the experimental conditions.
Acknowledgments
We thank Shaoli Cai and Zhang Lin for administrative assistance, Dr. Daliang Li and the laboratory members for technical assistance and helpful discussion. This study was supported by the following funding sources: Fujian Key Laboratories Funds, Fujian Normal University Key Laboratory Construction Funds, Fujian Normal University Start-up Funds, Fujian Province Education Research Project for Young and Middle-aged Teachers (Grant No. JA15130), and Natural Science Foundation of Fujian Province, China (Grant No. 2017J01621).
Author contributions
Conceptualization: Q.C.; Methodology: H.D. and N.X.; Investigation, Data Curation: H.D., S.Z., X.Z., Y.Z., Z.L., Y.F., and M.H. Resources: Q.C., N.X., and S.X.; Writing – Original Draft: H.D.; Writing – Review and Editing: Q.C. and H.D.; Supervision: Q.C.
Declaration of interests
The authors declare no further conflicts of interests.
Inclusion and diversity
We worked to ensure sex balance in the selection of non-human subjects. We worked to ensure diversity in experimental samples through the selection of the cell lines. We worked to ensure diversity in experimental samples through the selection of the genomic datasets.
Published: June 10, 2023
Footnotes
Supplemental information can be found online at https://doi.org/10.1016/j.isci.2023.107090.
Supplemental information
Data and code availability
-
•
RNA sequencing data were deposited in NCBI GEO database under the accession number GSE226512. Original data for figures in the paper are available at Mendeley Data: https://data.mendeley.com/datasets/twy2gg3kgd/draft?a=c3aa8057-8c00-4383-ba64-3ce132169ca3.
-
•
This paper does not report original code.
-
•
Any additional information required to reanalyze the data reported in this paper is available from the lead contact upon request.
References
- 1.Childs B.G., Durik M., Baker D.J., van Deursen J.M. Cellular senescence in aging and age-related disease: from mechanisms to therapy. Nat. Med. 2015;21:1424–1435. doi: 10.1038/nm.4000. [DOI] [PMC free article] [PubMed] [Google Scholar]
- 2.Campisi J. Aging, cellular senescence, and cancer. Annu. Rev. Physiol. 2013;75:685–705. doi: 10.1146/annurev-physiol-030212-183653. [DOI] [PMC free article] [PubMed] [Google Scholar]
- 3.Fenech M., Kirsch-Volders M., Natarajan A.T., Surralles J., Crott J.W., Parry J., Norppa H., Eastmond D.A., Tucker J.D., Thomas P. Molecular mechanisms of micronucleus, nucleoplasmic bridge and nuclear bud formation in mammalian and human cells. Mutagenesis. 2011;26:125–132. doi: 10.1093/mutage/geq052. [DOI] [PubMed] [Google Scholar]
- 4.Di Micco R., Sulli G., Dobreva M., Liontos M., Botrugno O.A., Gargiulo G., dal Zuffo R., Matti V., d'Ario G., Montani E., et al. Interplay between oncogene-induced DNA damage response and heterochromatin in senescence and cancer. Nat. Cell Biol. 2011;13:292–302. doi: 10.1038/ncb2170. [DOI] [PMC free article] [PubMed] [Google Scholar]
- 5.de Leeuw R., Gruenbaum Y., Medalia O. Nuclear lamins: thin filaments with major functions. Trends Cell Biol. 2018;28:34–45. doi: 10.1016/j.tcb.2017.08.004. [DOI] [PubMed] [Google Scholar]
- 6.Dimri G.P., Lee X., Basile G., Acosta M., Scott G., Roskelley C., Medrano E.E., Linskens M., Rubelj I., Pereira-Smith O., et al. A biomarker that identifies senescent human cells in culture and in aging skin in vivo. Proc. Natl. Acad. Sci. USA. 1995;92:9363–9367. doi: 10.1073/pnas.92.20.9363. [DOI] [PMC free article] [PubMed] [Google Scholar]
- 7.Yoshimoto S., Loo T.M., Atarashi K., Kanda H., Sato S., Oyadomari S., Iwakura Y., Oshima K., Morita H., Hattori M., et al. Obesity-induced gut microbial metabolite promotes liver cancer through senescence secretome. Nature. 2013;499:97–101. doi: 10.1038/nature12347. [DOI] [PubMed] [Google Scholar]
- 8.Coppé J.P., Desprez P.Y., Krtolica A., Campisi J. The senescence-associated secretory phenotype: the dark side of tumor suppression. Annu. Rev. Pathol. 2010;5:99–118. doi: 10.1146/annurev-pathol-121808-102144. [DOI] [PMC free article] [PubMed] [Google Scholar]
- 9.Demaria M., Ohtani N., Youssef S.A., Rodier F., Toussaint W., Mitchell J.R., Laberge R.M., Vijg J., Van Steeg H., Dollé M.E.T., et al. An essential role for senescent cells in optimal wound healing through secretion of PDGF-AA. Dev. Cell. 2014;31:722–733. doi: 10.1016/j.devcel.2014.11.012. [DOI] [PMC free article] [PubMed] [Google Scholar]
- 10.Da Silva-Álvarez S., Guerra-Varela J., Sobrido-Cameán D., Quelle A., Barreiro-Iglesias A., Sánchez L., Collado M. Cell senescence contributes to tissue regeneration in zebrafish. Aging Cell. 2020;19:e13052. doi: 10.1111/acel.13052. [DOI] [PMC free article] [PubMed] [Google Scholar]
- 11.Ovadya Y., Landsberger T., Leins H., Vadai E., Gal H., Biran A., Yosef R., Sagiv A., Agrawal A., Shapira A., et al. Impaired immune surveillance accelerates accumulation of senescent cells and aging. Nat. Commun. 2018;9:5435. doi: 10.1038/s41467-018-07825-3. [DOI] [PMC free article] [PubMed] [Google Scholar]
- 12.Harding S.M., Benci J.L., Irianto J., Discher D.E., Minn A.J., Greenberg R.A. Mitotic progression following DNA damage enables pattern recognition within micronuclei. Nature. 2017;548:466–470. doi: 10.1038/nature23470. [DOI] [PMC free article] [PubMed] [Google Scholar]
- 13.Mackenzie K.J., Carroll P., Martin C.A., Murina O., Fluteau A., Simpson D.J., Olova N., Sutcliffe H., Rainger J.K., Leitch A., et al. cGAS surveillance of micronuclei links genome instability to innate immunity. Nature. 2017;548:461–465. doi: 10.1038/nature23449. [DOI] [PMC free article] [PubMed] [Google Scholar]
- 14.Wu J., Sun L., Chen X., Du F., Shi H., Chen C., Chen Z.J. Cyclic GMP-AMP is an endogenous second messenger in innate immune signaling by cytosolic DNA. Science. 2013;339:826–830. doi: 10.1126/science.1229963. [DOI] [PMC free article] [PubMed] [Google Scholar]
- 15.Sun L., Wu J., Du F., Chen X., Chen Z.J. Cyclic GMP-AMP synthase is a cytosolic DNA sensor that activates the type I interferon pathway. Science. 2013;339:786–791. doi: 10.1126/science.1232458. [DOI] [PMC free article] [PubMed] [Google Scholar]
- 16.Glück S., Guey B., Gulen M.F., Wolter K., Kang T.W., Schmacke N.A., Bridgeman A., Rehwinkel J., Zender L., Ablasser A. Innate immune sensing of cytosolic chromatin fragments through cGAS promotes senescence. Nat. Cell Biol. 2017;19:1061–1070. doi: 10.1038/ncb3586. [DOI] [PMC free article] [PubMed] [Google Scholar]
- 17.Kumari R., Jat P. Mechanisms of cellular senescence: cell cycle arrest and senescence associated secretory phenotype. Front. Cell Dev. Biol. 2021;9 doi: 10.3389/fcell.2021.645593. [DOI] [PMC free article] [PubMed] [Google Scholar]
- 18.Karimian A., Ahmadi Y., Yousefi B. Multiple functions of p21 in cell cycle, apoptosis and transcriptional regulation after DNA damage. DNA Repair. 2016;42:63–71. doi: 10.1016/j.dnarep.2016.04.008. [DOI] [PubMed] [Google Scholar]
- 19.Kent L.N., Leone G. The broken cycle: E2F dysfunction in cancer. Nat. Rev. Cancer. 2019;19:326–338. doi: 10.1038/s41568-019-0143-7. [DOI] [PubMed] [Google Scholar]
- 20.Höss M., Robins P., Naven T.J., Pappin D.J., Sgouros J., Lindahl T. A human DNA editing enzyme homologous to the Escherichia coli DnaQ/MutD protein. EMBO J. 1999;18:3868–3875. doi: 10.1093/emboj/18.13.3868. [DOI] [PMC free article] [PubMed] [Google Scholar]
- 21.Orebaugh C.D., Fye J.M., Harvey S., Hollis T., Wilkinson J.C., Perrino F.W. The TREX1 C-terminal region controls cellular localization through ubiquitination. J. Biol. Chem. 2013;288:28881–28892. doi: 10.1074/jbc.M113.503391. [DOI] [PMC free article] [PubMed] [Google Scholar]
- 22.Mazur D.J., Perrino F.W. Identification and expression of the TREX1 and TREX2 cDNA sequences encoding mammalian 3'-->5' exonucleases. J. Biol. Chem. 1999;274:19655–19660. doi: 10.1074/jbc.274.28.19655. [DOI] [PubMed] [Google Scholar]
- 23.Wolf C., Rapp A., Berndt N., Staroske W., Schuster M., Dobrick-Mattheuer M., Kretschmer S., König N., Kurth T., Wieczorek D., et al. RPA and Rad51 constitute a cell intrinsic mechanism to protect the cytosol from self DNA. Nat. Commun. 2016;7:11752. doi: 10.1038/ncomms11752. [DOI] [PMC free article] [PubMed] [Google Scholar]
- 24.Crow Y.J., Hayward B.E., Parmar R., Robins P., Leitch A., Ali M., Black D.N., van Bokhoven H., Brunner H.G., Hamel B.C., et al. Mutations in the gene encoding the 3'-5' DNA exonuclease TREX1 cause Aicardi-Goutieres syndrome at the AGS1 locus. Nat. Genet. 2006;38:917–920. doi: 10.1038/ng1845. [DOI] [PubMed] [Google Scholar]
- 25.Lee-Kirsch M.A., Gong M., Chowdhury D., Senenko L., Engel K., Lee Y.A., de Silva U., Bailey S.L., Witte T., Vyse T.J., et al. Mutations in the gene encoding the 3'-5' DNA exonuclease TREX1 are associated with systemic lupus erythematosus. Nat. Genet. 2007;39:1065–1067. doi: 10.1038/ng2091. [DOI] [PubMed] [Google Scholar]
- 26.Crow Y.J., Rehwinkel J. Aicardi-Goutieres syndrome and related phenotypes: linking nucleic acid metabolism with autoimmunity. Hum. Mol. Genet. 2009;18:R130–R136. doi: 10.1093/hmg/ddp293. [DOI] [PMC free article] [PubMed] [Google Scholar]
- 27.Peschke K., Friebe F., Zimmermann N., Wahlicht T., Schumann T., Achleitner M., Berndt N., Luksch H., Behrendt R., Lee-Kirsch M.A., et al. Deregulated type I IFN response in TREX1-associated familial chilblain lupus. J. Invest. Dermatol. 2014;134:1456–1459. doi: 10.1038/jid.2013.496. [DOI] [PubMed] [Google Scholar]
- 28.Gao D., Li T., Li X.D., Chen X., Li Q.Z., Wight-Carter M., Chen Z.J. Activation of cyclic GMP-AMP synthase by self-DNA causes autoimmune diseases. Proc. Natl. Acad. Sci. USA. 2015;112:E5699–E5705. doi: 10.1073/pnas.1516465112. [DOI] [PMC free article] [PubMed] [Google Scholar]
- 29.Xiao N., Wei J., Xu S., Du H., Huang M., Zhang S., Ye W., Sun L., Chen Q. cGAS activation causes lupus-like autoimmune disorders in a TREX1 mutant mouse model. J. Autoimmun. 2019;100:84–94. doi: 10.1016/j.jaut.2019.03.001. [DOI] [PubMed] [Google Scholar]
- 30.Takahashi A., Loo T.M., Okada R., Kamachi F., Watanabe Y., Wakita M., Watanabe S., Kawamoto S., Miyata K., Barber G.N., et al. Downregulation of cytoplasmic DNases is implicated in cytoplasmic DNA accumulation and SASP in senescent cells. Nat. Commun. 2018;9:1249. doi: 10.1038/s41467-018-03555-8. [DOI] [PMC free article] [PubMed] [Google Scholar]
- 31.Yan N. Immune diseases associated with TREX1 and STING dysfunction. Journal of interferon & cytokine research. J. Interferon Cytokine Res. 2017;37:198–206. doi: 10.1089/jir.2016.0086. [DOI] [PMC free article] [PubMed] [Google Scholar]
- 32.Hasan M., Fermaintt C.S., Gao N., Sakai T., Miyazaki T., Jiang S., Li Q.Z., Atkinson J.P., Morse H.C., 3rd, Lehrman M.A., Yan N. Cytosolic nuclease TREX1 regulates oligosaccharyltransferase activity independent of nuclease activity to suppress immune activation. Immunity. 2015;43:463–474. doi: 10.1016/j.immuni.2015.07.022. [DOI] [PMC free article] [PubMed] [Google Scholar]
- 33.Liu Y., Xiao N., Du H., Kou M., Lin L., Huang M., Zhang S., Xu S., Li D., Chen Q. Celastrol ameliorates autoimmune disorders in Trex1-deficient mice. Biochem. Pharmacol. 2020;178:114090. doi: 10.1016/j.bcp.2020.114090. [DOI] [PubMed] [Google Scholar]
- 34.Hayflick L., Moorhead P.S. The serial cultivation of human diploid cell strains. Exp. Cell Res. 1961;25:585–621. doi: 10.1016/0014-4827(61)90192-6. [DOI] [PubMed] [Google Scholar]
- 35.Todaro G.J., Green H. Quantitative studies of the growth of mouse embryo cells in culture and their development into established lines. J. Cell Biol. 1963;17:299–313. doi: 10.1083/jcb.17.2.299. [DOI] [PMC free article] [PubMed] [Google Scholar]
- 36.Acosta J.C., Banito A., Wuestefeld T., Georgilis A., Janich P., Morton J.P., Athineos D., Kang T.W., Lasitschka F., Andrulis M., et al. A complex secretory program orchestrated by the inflammasome controls paracrine senescence. Nat. Cell Biol. 2013;15:978–990. doi: 10.1038/ncb2784. [DOI] [PMC free article] [PubMed] [Google Scholar]
- 37.Jackson S.P., Bartek J. The DNA-damage response in human biology and disease. Nature. 2009;461:1071–1078. doi: 10.1038/nature08467. [DOI] [PMC free article] [PubMed] [Google Scholar]
- 38.Zhang C.Z., Spektor A., Cornils H., Francis J.M., Jackson E.K., Liu S., Meyerson M., Pellman D. Chromothripsis from DNA damage in micronuclei. Nature. 2015;522:179–184. doi: 10.1038/nature14493. [DOI] [PMC free article] [PubMed] [Google Scholar]
- 39.Crasta K., Ganem N.J., Dagher R., Lantermann A.B., Ivanova E.V., Pan Y., Nezi L., Protopopov A., Chowdhury D., Pellman D. DNA breaks and chromosome pulverization from errors in mitosis. Nature. 2012;482:53–58. doi: 10.1038/nature10802. [DOI] [PMC free article] [PubMed] [Google Scholar]
- 40.Serrano M., Lin A.W., McCurrach M.E., Beach D., Lowe S.W. Oncogenic ras provokes premature cell senescence associated with accumulation of p53 and p16INK4a. Cell. 1997;88:593–602. doi: 10.1016/s0092-8674(00)81902-9. [DOI] [PubMed] [Google Scholar]
- 41.Ogrunc M., Di Micco R., Liontos M., Bombardelli L., Mione M., Fumagalli M., Gorgoulis V.G., d'Adda di Fagagna F. Oncogene-induced reactive oxygen species fuel hyperproliferation and DNA damage response activation. Cell Death Differ. 2014;21:998–1012. doi: 10.1038/cdd.2014.16. [DOI] [PMC free article] [PubMed] [Google Scholar]
- 42.Berndt N., Wolf C., Fischer K., Cura Costa E., Knuschke P., Zimmermann N., Schmidt F., Merkel M., Chara O., Lee-Kirsch M.A., Günther C. Photosensitivity and cGAS-dependent IFN-1 activation in patients with lupus and TREX1 deficiency. J. Invest. Dermatol. 2022;142:633–640.e6. doi: 10.1016/j.jid.2021.04.037. [DOI] [PubMed] [Google Scholar]
- 43.Li T., Kon N., Jiang L., Tan M., Ludwig T., Zhao Y., Baer R., Gu W. Tumor suppression in the absence of p53-mediated cell-cycle arrest, apoptosis, and senescence. Cell. 2012;149:1269–1283. doi: 10.1016/j.cell.2012.04.026. [DOI] [PMC free article] [PubMed] [Google Scholar]
- 44.Flor A.C., Doshi A.P., Kron S.J. Modulation of therapy-induced senescence by reactive lipid aldehydes. Cell Death Dis. 2016;2:16045-. doi: 10.1038/cddiscovery.2016.45. [DOI] [PMC free article] [PubMed] [Google Scholar]
- 45.Pommier Y., Leo E., Zhang H., Marchand C. DNA topoisomerases and their poisoning by anticancer and antibacterial drugs. Chem. Biol. 2010;17:421–433. doi: 10.1016/j.chembiol.2010.04.012. [DOI] [PMC free article] [PubMed] [Google Scholar]
- 46.te Poele R.H., Okorokov A.L., Jardine L., Cummings J., Joel S.P. DNA damage is able to induce senescence in tumor cells in vitro and in vivo. Cancer Res. 2002;62:1876–1883. [PubMed] [Google Scholar]
- 47.Yang H., Wang H., Ren J., Chen Q., Chen Z.J. cGAS is essential for cellular senescence. Proc. Natl. Acad. Sci. USA. 2017;114:4612–4620. doi: 10.1073/pnas.1705499114. [DOI] [PMC free article] [PubMed] [Google Scholar]
- 48.Feldman R.I., Wu J.M., Polokoff M.A., Kochanny M.J., Dinter H., Zhu D., Biroc S.L., Alicke B., Bryant J., Yuan S., et al. Novel small molecule inhibitors of 3-phosphoinositide-dependent kinase-1. J. Biol. Chem. 2005;280:19867–19874. doi: 10.1074/jbc.M501367200. [DOI] [PubMed] [Google Scholar]
- 49.Krizhanovsky V., Yon M., Dickins R.A., Hearn S., Simon J., Miething C., Yee H., Zender L., Lowe S.W. Senescence of activated stellate cells limits liver fibrosis. Cell. 2008;134:657–667. doi: 10.1016/j.cell.2008.06.049. [DOI] [PMC free article] [PubMed] [Google Scholar]
- 50.Dai B., Zhao X.F., Mazan-Mamczarz K., Hagner P., Corl S., Bahassi E.M., Lu S., Stambrook P.J., Shapiro P., Gartenhaus R.B. Functional and molecular interactions between ERK and CHK2 in diffuse large B-cell lymphoma. Nat. Commun. 2011;2:402. doi: 10.1038/ncomms1404. [DOI] [PMC free article] [PubMed] [Google Scholar]
- 51.Arienti K.L., Brunmark A., Axe F.U., McClure K., Lee A., Blevitt J., Neff D.K., Huang L., Crawford S., Pandit C.R., et al. Checkpoint kinase inhibitors: SAR and radioprotective properties of a series of 2-arylbenzimidazoles. J. Med. Chem. 2005;48:1873–1885. doi: 10.1021/jm0495935. [DOI] [PubMed] [Google Scholar]
- 52.Briand C., Frémond M.L., Bessis D., Carbasse A., Rice G.I., Bondet V., Duffy D., Chatenoud L., Blanche S., Crow Y.J., Neven B. Efficacy of JAK1/2 inhibition in the treatment of chilblain lupus due to TREX1 deficiency. Ann. Rheum. Dis. 2019;78:431–433. doi: 10.1136/annrheumdis-2018-214037. [DOI] [PubMed] [Google Scholar]
- 53.Haag S.M., Gulen M.F., Reymond L., Gibelin A., Abrami L., Decout A., Heymann M., van der Goot F.G., Turcatti G., Behrendt R., Ablasser A. Targeting STING with covalent small-molecule inhibitors. Nature. 2018;559:269–273. doi: 10.1038/s41586-018-0287-8. [DOI] [PubMed] [Google Scholar]
- 54.Decout A., Katz J.D., Venkatraman S., Ablasser A. The cGAS-STING pathway as a therapeutic target in inflammatory diseases. Nat. Rev. Immunol. 2021;21:548–569. doi: 10.1038/s41577-021-00524-z. [DOI] [PMC free article] [PubMed] [Google Scholar]
- 55.Chen H., Chen H., Zhang J., Wang Y., Simoneau A., Yang H., Levine A.S., Zou L., Chen Z., Lan L. cGAS suppresses genomic instability as a decelerator of replication forks. Sci. Adv. 2020;6:eabb8941. doi: 10.1126/sciadv.abb8941. [DOI] [PMC free article] [PubMed] [Google Scholar]
- 56.Di Micco R., Krizhanovsky V., Baker D., d'Adda di Fagagna F. Cellular senescence in ageing: from mechanisms to therapeutic opportunities. Nat. Rev. Mol. Cell Biol. 2021;22:75–95. doi: 10.1038/s41580-020-00314-w. [DOI] [PMC free article] [PubMed] [Google Scholar]
- 57.Zhu Y., Doornebal E.J., Pirtskhalava T., Giorgadze N., Wentworth M., Fuhrmann-Stroissnigg H., Niedernhofer L.J., Robbins P.D., Tchkonia T., Kirkland J.L. New agents that target senescent cells: the flavone, fisetin, and the BCL-X(L) inhibitors, A1331852 and A1155463. Aging (Albany NY) 2017;9:955–963. doi: 10.18632/aging.101202. [DOI] [PMC free article] [PubMed] [Google Scholar]
- 58.Aguado J., Sola-Carvajal A., Cancila V., Revêchon G., Ong P.F., Jones-Weinert C.W., Wallén Arzt E., Lattanzi G., Dreesen O., Tripodo C., et al. Inhibition of DNA damage response at telomeres improves the detrimental phenotypes of Hutchinson-Gilford Progeria Syndrome. Nat. Commun. 2019;10:4990. doi: 10.1038/s41467-019-13018-3. [DOI] [PMC free article] [PubMed] [Google Scholar]
- 59.Li M., He Y., Dubois W., Wu X., Shi J., Huang J. Distinct regulatory mechanisms and functions for p53-activated and p53-repressed DNA damage response genes in embryonic stem cells. Mol. Cell. 2012;46:30–42. doi: 10.1016/j.molcel.2012.01.020. [DOI] [PMC free article] [PubMed] [Google Scholar]
- 60.Sagiv A., Krizhanovsky V. Immunosurveillance of senescent cells: the bright side of the senescence program. Biogerontology. 2013;14:617–628. doi: 10.1007/s10522-013-9473-0. [DOI] [PubMed] [Google Scholar]
- 61.Storer M., Mas A., Robert-Moreno A., Pecoraro M., Ortells M.C., Di Giacomo V., Yosef R., Pilpel N., Krizhanovsky V., Sharpe J., Keyes W.M. Senescence is a developmental mechanism that contributes to embryonic growth and patterning. Cell. 2013;155:1119–1130. doi: 10.1016/j.cell.2013.10.041. [DOI] [PubMed] [Google Scholar]
- 62.Yousefzadeh M.J., Flores R.R., Zhu Y., Schmiechen Z.C., Brooks R.W., Trussoni C.E., Cui Y., Angelini L., Lee K.A., McGowan S.J., et al. An aged immune system drives senescence and ageing of solid organs. Nature. 2021;594:100–105. doi: 10.1038/s41586-021-03547-7. [DOI] [PMC free article] [PubMed] [Google Scholar]
- 63.Hu M., Zhou M., Bao X., Pan D., Jiao M., Liu X., Li F., Li C.Y. ATM inhibition enhances cancer immunotherapy by promoting mtDNA leakage and cGAS/STING activation. J. Clin. Invest. 2021;131:e139333. doi: 10.1172/jci139333. [DOI] [PMC free article] [PubMed] [Google Scholar]
- 64.Blackford A.N., Jackson S.P. ATM, ATR, and DNA-PK: the trinity at the heart of the DNA damage response. Mol. Cell. 2017;66:801–817. doi: 10.1016/j.molcel.2017.05.015. [DOI] [PubMed] [Google Scholar]
- 65.Yahyapour R., Amini P., Rezapour S., Cheki M., Rezaeyan A., Farhood B., Shabeeb D., Musa A.E., Fallah H., Najafi M. Radiation-induced inflammation and autoimmune diseases. Mil. Med. Res. 2018;5:9. doi: 10.1186/s40779-018-0156-7. [DOI] [PMC free article] [PubMed] [Google Scholar]
Associated Data
This section collects any data citations, data availability statements, or supplementary materials included in this article.
Supplementary Materials
Data Availability Statement
-
•
RNA sequencing data were deposited in NCBI GEO database under the accession number GSE226512. Original data for figures in the paper are available at Mendeley Data: https://data.mendeley.com/datasets/twy2gg3kgd/draft?a=c3aa8057-8c00-4383-ba64-3ce132169ca3.
-
•
This paper does not report original code.
-
•
Any additional information required to reanalyze the data reported in this paper is available from the lead contact upon request.