

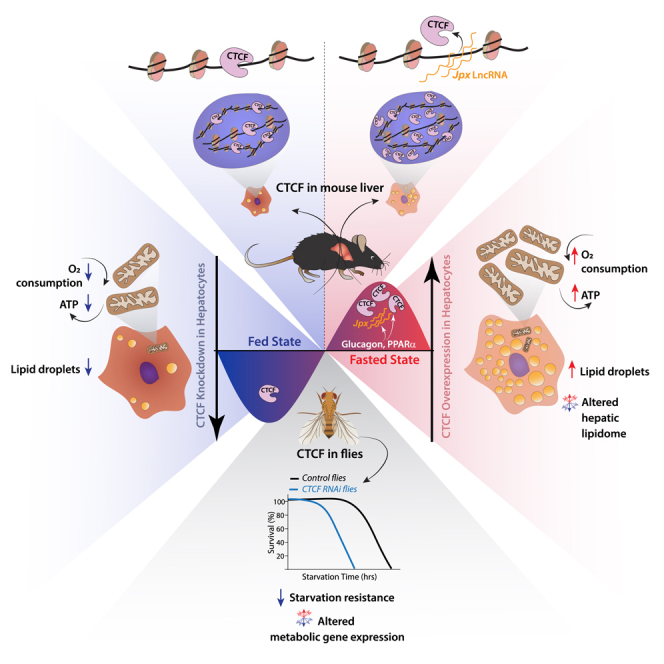
Summary
Coordinated temporal control of gene expression is essential for physiological homeostasis, especially during metabolic transitions. However, the interplay between chromatin architectural proteins and metabolism in regulating transcription is less understood. Here, we demonstrate a conserved bidirectional interplay between CTCF (CCCTC-binding factor) expression/function and metabolic inputs during feed-fast cycles. Our results indicate that its loci-specific functional diversity is associated with physiological plasticity in mouse hepatocytes. CTCF differential expression and long non-coding RNA-Jpx mediated changes in chromatin occupancy, unraveled its paradoxical yet tuneable functions, which are governed by metabolic inputs. We illustrate the key role of CTCF in controlling temporal cascade of transcriptional response, with effects on hepatic mitochondrial energetics and lipidome. Underscoring the evolutionary conservation of CTCF-dependent metabolic homeostasis, CTCF knockdown in flies abrogated starvation resistance. In summary, we demonstrate the interplay between CTCF and metabolic inputs that highlights the coupled plasticity of physiological responses and chromatin function.
Subject areas: Natural sciences, Biological sciences
Graphical abstract
Highlights
-
•
Fed-fast cues dictate CTCF expression and chromatin association in mice liver
-
•
Altered CTCF expression affects hepatic transcription, energetics, and lipidome
-
•
Starvation-induced lncRNA-Jpx antagonizes CTCF chromatin occupancy
-
•
CTCFRNAi flies have altered metabolic gene expression and starvation survival
Natural sciences; Biological sciences
Introduction
Plasticity of chromatin organization and transcriptional responses are necessary to reprogram gene expression cascades.1 Recruitment of transcription factors, co-activators, and co-repressors are intrinsically dependent on both local and global changes in chromatin organizations.2,3,4,5 Even though topologically associated domains (TADs) and sub-TADs have been implicated in orchestrating gene expression, recent reports have indicated that this organizational hierarchy may not dictate the extent of activation and repression of transcription.6 CTCF (CCCTC-binding factor) and its paralogs are known to regulate gene expression and chromatin organization, across biological contexts, which seems to be evolutionarily conserved.7,8,9,10 However, whether binding specificities and/or differential localization of CTCF onto proximal/distal regulatory elements and TADs/sub-TADs to modulate active transcriptional responses is still poorly understood. Specifically, the role of CTCF in mediating dynamic and reversible physiological transitions remains to be addressed.
Complexity of CTCF-dependent genome transactions, including transcription, seems to have diversified from invertebrates to vertebrates.7,11 Irrespective of this, recent reports have in fact highlighted evolutionarily conserved roles of CTCF, which have been instrumental in appreciating CTCF functions in mammals.7,12,13,14 However, despite the well-established recruitment of CTCF at proximal and distal transcriptional regulatory sites, conflicting reports have questioned the global influence of CTCF on gene expression at steady state.6 It is however likely that CTCF-dependent transcriptional control is rather complex and/or dynamic because ChIP-seq and computational analyses have indicated that CTCF-bound sites overlap with TF consensus motifs and regulatory histone marks.9,15,16,17,18,19,20,21 In this context, molecular factors that dictate loci-specific CTCF-mediated control of transcription need further investigation.
Attempts to reveal the importance of CTCF in transcription are largely limited to cell fate-determination events, wherein it has emerged as a key component for rewiring differentiation-induced gene expression programs.22,23,24,25,26 Studies have also shown the conservation of CTCF functions from flies to humans.7,27 Although the presence or absence of CTCF has been shown to influence stress responses,28,29,30,31,32 mechanistic underpinnings, especially in the context of active modulation of transcription, are still limited. Therefore, even though surprising, whether or not TAD and looping independent CTCF binding contribute to effective transcription control remains to be addressed. Nonetheless, it is tantalising to hypothesize distinct CTCF functionalities to be coupled with binding specificities and/or affinities. Notably, a recent report unraveled a non-coding RNA-dependent regulation of CTCF recruitment at weak binding sites.33 Together, this brings to the fore, a significant gap in our understanding of the interplay between physiological contexts and CTCF-dependent gene expression programs.
Feed-fast cycles, indispensable for the survival of higher eukaryotes, require plasticity of cellular pathways that maintain metabolic homeostasis. Notably, this demands a precise temporal control of multiple mechanisms that impinge on gene expression, which is tuned as a function of cellular metabolic status and is necessary to potentiate anabolic and catabolic pathways.34,35,36 Others and we have clearly demonstrated that transcriptional and post-transcriptional mechanisms play a pivotal role in dictating gene expression profiles during fed-fast transitions.34,37,38,39,40,41 However, upstream/master regulators of transcription, such as SIRT1 and p300/CBP, have been shown to exert control over activation/repression of genes involved in metabolic transitions.42,43 Moreover, impaired transcription-dependent metabolic insufficiency is known to reduce starvation survival, as illustrated by studies in invertebrates.44,45 Despite this, there is a paucity of information on factors that govern chromatin architecture. Specifically, if/how differential CTCF-binding is associated with reprogramming of gene expression during dynamic physiological transitions, as a cause or consequence, has not been addressed thus far.
In this study, we have unraveled an intricate bidirectional crosstalk between CTCF and metabolism that is evolutionarily conserved. Serendipitously, we have found that CTCF expression is modulated by fed and fasted states in both flies and mice. Paradoxical differential chromatin binding of CTCF, corroborated by ChIP-seq analyses, is seen to be associated with hepatic gene expression cascades. We have provided compelling mechanistic insights into this differential affinity to chromatin that is orchestrated by the long non-coding RNA, Jpx, which itself is downstream to starvation inputs. In addition to illustrating CTCF dosage-dependent alteration of transcription and metabolism in mouse hepatocytes, our findings from flies also show physiological relevance at an organismal level. Therefore, our study brings to the fore the importance of the interplay between metabolism and chromatin architectural protein in governing both hepatic and organismal physiology.
Results
Genome-wide CTCF occupancy in mice liver
Even though CTCF loss of function has been recently reported to cause perturbed liver physiology,46 CTCF target genes and the potential interplay with metabolism, vis-à-vis hepatic gene expression, are still unclear. Toward this, we carried out ChIP-Seq analyses of CTCF in liver isolated under ad-libitum fed conditions from three independent mice, which showed a high degree of correlation among themselves (Figure S1A). We found a total of 44,907 CTCF binding sites on the liver genome (Figure S1B), similar to what has been observed earlier.47 Globally, we found maximal CTCF occupancy at the promoter and transcription start sites (TSS) followed by intronic and intergenic regions (Figure 1A). As described later, we validated some of these CTCF-binding sites using ChIP-qPCR and found concordance between independent chromatin immunoprecipitation assays. Not surprisingly, CTCF-bound loci overlapped with regions occupied by components of the cohesin complex in the liver (67.8% and 64.9% for SMC3 and RAD21, respectively) (Figures 1B and S1C) based on previously published ChIP-seq datasets. In addition, some of the CTCF binding superimposed with active RNA POL-II (Figures 1B and S1C).
Figure 1.

Global chromatin association of CTCF in ad-libitum fed mice liver
(A) Genome-wide distribution of CTCF peaks.
(B–D) Heatmaps displaying overlapping binding specificities (expressed as a percentage) for (B) RAD21, SMC3, RNA POL-II Ser5-P(CT16), RNA POL-II 8WG16 (CT16), CBP (CT16) and p300 (CT16) binding sites in liver with CTCF (C) CTCF with histone modifications (Encode Database) (D) Histone modifications with CTCF peaks.
(E) Known motifs enriched in CTCF ChIP-seq peaks.
(F) Circular bar plot showing the presence of TF binding sites within CTCF peaks. UTR-Untranslated region, TSS-Transcription Start Site, TTS-Transcription Termination Site.
Given that CTCF is known to both activate and repress transcription and has been associated with epigenetic modifications, we next checked if chromatin/genetic loci bound by CTCF in the liver correlated with histone modifications, based on ENCODE database. Two-way comparison of CTCF-bound regions with enrichment of histone modifications that overlap with CTCF binding, revealed a skewed abundance of activatory marks (Figures 1C and 1D). Specifically, although CTCF-bound loci showed enrichment of H3K4me1 and H3K9ac (Figure 1C), we also found a high abundance of CTCF in chromatin regions having H3K4me3 and H3K9ac marks (Figure 1D), suggesting the presence of CTCF at hepatic enhancers and re-affirming its occupancy at promoters (Figure 1A).
As expected, motif analysis showed enriched consensus CTCF binding elements in our ChIP-Seq (Figure 1E, and Table S1). Of interest, we also found Transcription Factor (TF) binding sequences, which are known regulators of liver physiology, including THRb and ERRα, as prominent cis-elements that were associated with CTCF-bound regions (Figure 1E, and Table S1).48,49 This prompted us to specifically look for co-occupancy of CTCF with TFs that are central in establishing hepatic transcriptional network (Figures 1F and S1D). In addition to substantial convergence of CTCF-TF co-occupancies, it was surprising to see that nearly 54% of SREBP2 target loci/regions were also bound by CTCF (Figure 1F). This was particularly intriguing because our ChIP-seq was from fed livers and SREBP2 is a key transcriptional regulator of hepatic cholesterol and lipid metabolism that is required for mounting anabolic response in a fed state.50 Furthermore, 32% of starvation-dependent CREB-bound regions, implicated in hepatic glucose and lipid metabolism,51 overlapped with CTCF binding (Figure 1F). These suggested a possible interplay between CTCF and key TFs that regulate hepatic lipid and glucose metabolism.
Consistent with the literature, genome-wide abundance of CTCF varied widely, as depicted by peak scores (Figure S1E). Whether this reflects low and high-affinity binding sites or divergent functions of CTCF remains unclear and is an outstanding question in the field. Nonetheless, we binned the bound loci into quartiles based on peak scores (Figure S1E), which did not reveal any correlation between high/low-affinity sites (Figure S1F) and specific genomic contexts/loci (Figure S1G). Therefore, we resorted to characterize promoter proximal CTCF bound loci belonging to each of these quartiles, using gene ontology (GO) analysis and found significant enrichment of key cellular processes/pathways that are central to hepatic physiology. Notably, genes/pathways associated with lipid metabolic processes, cellular response to insulin stimulus, glucose homeostasis, lysosome organization, regulation of mitochondrial organization etc. were enriched with a significant count, within each quartile (Figure S1H, Table S2).
Furthermore, we profiled the occupancy of CTCF binding at protein-coding and noncoding genes. Unlike on coding genes, CTCF was present throughout the gene body at non-coding loci (Figures 2A, 2B, and S1I). Distinct positional enrichment was used as a criterion to cluster CTCF-bound peaks on protein-coding genes into five bins, as indicated (Figure 2A). For further analysis, we chose clusters 1, 2, 3 and 4, which have either CTCF binding across the gene-body or have high to moderate peak intensities at or around TSS as shown in Figure 2A. GO analysis for each of these clusters revealed that lipid metabolic processes in the cytoplasm and mitochondria, and redox pathways were the significantly enriched amongst metabolic processes in cluster 4 (Figures 2C, S1J, and Table S2). Moreover, metabolic gene loci present in clusters 1 and 2 were associated with fatty acid biogenesis and lysosomal organization, respectively (Figures 2C, S1J, and Table S2). CTCF bindings at some of these loci (Figures 2D and 2E) were validated using ChIP-qPCRs from chromatin isolated from independent mice cohorts (Figure 2F). Together, the results described above suggested a potential association of CTCF chromatin activity with transcription factors and pathways that impinge on liver metabolism.
Figure 2.

CTCF occupancy around protein-coding and non-coding genes
(A and B) k-means clustering of genes ((A) protein-coding and (B) non-coding) based on CTCF ChIP-seq signal intensity profile averaged from n = 3 (across gene body and 2Kb upstream and downstream of TSS and TTS, respectively).
(C) GO-BP (Biological Process) terms enriched in genes associated with cluster 1–4 (protein-coding genes).
(D) Genome Browser (IGV) snapshots of CTCF binding intensities on genes as indicated. Red boxes depict genomic locus where CTCF binding has been validated using ChIP-qPCR.
(E and F) CTCF-ChIP-seq peaks scores (E) and ChIP-qPCR validation (n = 3, representative from N = 2) (F) of CTCF binding at genomic loci shown in D. Data are represented as mean ± SEM. For F, statistical significance was calculated by using a Student’s t test (∗, p < 0.05; ∗∗, p < 0.01; ∗∗∗, p < 0.001). TSS-Transcription Start Site, TTS-Transcription Termination Site.
Differential association of fed- and fasting-induced genes with CTCF
Others and we have demonstrated the importance of upstream transcriptional regulators in reprogramming hepatic gene expression during physiologically relevant feed-fast cycles.38,52,53 In this context, we investigated the correlation between CTCF occupancy and global changes in transcription under fed and fasted conditions. Toward this, we utilized a previously published and publicly available RNA-seq dataset.54 Reanalyzing differential gene expression revealed significant upregulation of 977 and 367 genes in livers from ad-lib fed and 24 h starved mice, respectively (Figure 3A). Nearly 8.8 and 4.4% of the CTCF peaks overlapping with coding loci (15,478 peaks) mapped to genes upregulated during fed and starved conditions, respectively (Figure S2A).
Figure 3.

Association of CTCF with differentially expressed genes in fed and starved livers
(A) Venn Diagram showing number of CTCF bound genes that overlap with genes induced in fed and 24 h starved mice liver (Fold Change (FC) ≥ 2, False Discovery Rate (FDR) ≤0.05).
(B) Distribution of genomic features in CTCF peaks overlapping with fed and starvation-induced genes.
(C and D) CTCF ChIP-seq signal intensities across genes hosting CTCF binding and are (C) feeding induced (558 genes) or (D) starvation-induced (275 genes) and clustered (k-mean) based on CTCF coverage profile (across gene body and 2Kb upstream and downstream of TSS and TTS, respectively).
(E and F) GO-BP terms enriched in genes associated with clusters generated in C (E) and D (F). UTR-Untranslated region, TSS-Transcription Start Site, TTS-Transcription Termination Site.
However, it was interesting to note that 57.1% (558 out of 977) and 74.7% (275 out of 367) of genes that were significantly induced in fed and fasted states were bound with CTCF (Figure 3A). Albeit the number of CTCF peaks in ad-libitum fed liver seemed to be higher on starvation-induced genes, we did not find any specific bias vis-à-vis average peak intensities (Figures S2B and S2C). Nonetheless, spatial distribution of CTCF on fed-induced genes showed maximum binding at introns followed by promoter-TSS sites. On the other hand, starvation-induced genes showed major binding at promoter-TSS sites followed by intronic regions (Figure 3B).
As earlier (Figure 2), CTCF-bound fed and fasting genes were binned into clusters based on positional specificities (Figures 3C and 3D). We then performed GO analysis of genes that were differentially regulated during fed-/fasted-states and were bound by CTCF, within each of these clusters (Figures 3E and 3F). It is important to note that cholesterol/sterol biosynthetic pathways were the enriched metabolic processes in CTCF-bound genes that were upregulated in the fed state (Figure 3E). On the other hand, we found an overrepresentation of lipid metabolic processes especially those involved in fatty acid metabolism in CTCF-bound genes that were upregulated in the starved state (Figure 3F). This was corroborated by motif analysis that revealed binding sites for PPARα and ERRg, transcription factors that play a central role in lipid metabolism and mitochondrial functions during starvation (Figures S2D and S2E).55,56
To provide orthogonal evidence vis-à-vis the correlation between CTCF-bound loci and transcriptionally active loci, we assessed the overlap of CTCF with chromatin accessibility. Toward this, we utilized the DNase I hypersensitivity sites (DHS) sequencing dataset from the same study54 to assess whether CTCF-occupied genomic regions are differentially accessible in fed and starved liver. Our investigation revealed that 7.5 and 10.3% of DHS sites in fed and starved livers, respectively, are co-occupied by CTCF-binding regions that belong to promoter-TSS, intronic and intergenic sites of the hepatic genome (Figures S2F and S2G). These observations suggest a potential role of CTCF in mediating the dynamic functionality of genic and intergenic regulatory loci in the liver during a fed-fast cycle. We performed GO analysis on genes harboring overlapping CTCF peaks and differential DHS sites in their gene body and found highest representation of lipid metabolic processes and fatty acid beta-oxidation (Figure S2H). Together, these findings not only suggest a potential bias for CTCF recruitment on genes involved in hepatic fat metabolism and energetics but also hint at its functional relevance in regulating gene expression during fed and fasted states.
CTCF expression is regulated by liver metabolic states
Owing to the lack of information about the interplay between CTCF and metabolic states, we were tempted to check if the levels of CTCF were altered during feed-fast cycles. It was intriguing to find that there was a significant induction in CTCF expression (at both protein and mRNA levels) in the liver in response to starvation, which was hitherto unknown. This induction was more pronounced following 24 h of starvation and independent of the time of day (Figures 4A–4E, and S3A–S3D). To verify if the expression could be regulated solely by nutrient perturbation, we assessed CTCF total and nuclear protein levels in primary hepatocytes grown under conditions that mimic a starvation state. Corroborating the data from mice liver, we found elevated CTCF levels following glucose deprivation (Figures 4F–4H).
Figure 4.

Effect of liver metabolic state on CTCF differential expression
(A and B) Protein expression of CTCF in ad-lib fed (8 a.m.) and 24 h fasted (8 a.m. onwards) mice liver (A) Representative immunoblots and (B) quantification of CTCF band intensities. CTCF band intensities were quantified with tubulin as a loading control and presented as fold change in comparison to ad-lib fed (N = 5, n = 3–4).
(C) mRNA expression of Ctcf in ad-lib fed (8 a.m.) and 24 h starved liver (8 a.m. onwards), normalized to H2a transcript levels and plotted as fold change with respect to ad-lib fed (N = 3, n = 3).
(D and E) Immunofluorescence (D, Representative images) and (E) quantifications of CTCF in ad-lib fed and 24 h starved liver sections, captured at 10× magnification and optically zoomed (3×) (Top, Right) (scale bar depicts 100μm) (For E, n = 6).
(F) Protein expression of CTCF in primary hepatocytes treated with high glucose (HG, 25mM glucose) and glucose-free (NG) media for 16 hrs.
(G and H) Immunofluorescence (G, Representative images) and (H) quantifications of CTCF in HG and NG treated primary hepatocytes, captured at 60× magnification (scale bar depicts 5μm) (For H, N = 2, n = 60 nuclei).
(I) Genome Browser (IGV) snapshots of H3K27ac ChIP-seq in ad-lib fed and 24 h starved liver at Ctcf locus.
(J) Genome Browser snapshot of CREB and PPARα ChIP-seq peaks from starved mice liver. Blue boxes are depicting promoter-specific histone marks at Ctcf locus (H3K9ac and H3K4me3 ChIP-seq (Encode Database) in liver).
(K and L) Relative Ctcf mRNA expression in primary hepatocytes treated with (K) HG, low glucose (LG, 5mM glucose) and 10μM forskolin (Fsk) supplemented in LG media for 12 h, normalized with H2a transcript levels and plotted as fold change compared to LG treatment (N = 2, n = 3–6) and (L) HG and 50 μM WY14643 supplemented in HG media for 10 h, normalized with actin (Actb) and represented as fold change compared to HG treatment (N = 2, n = 3). Data are represented as mean ± SEM. For B, C, E, H, K & L statistical significance was calculated by using a Student’s t test (∗, p < 0.05; ∗∗, p < 0.01; ∗∗∗, p < 0.001).
These interesting findings prompted us to check if the promoter of CTCF contains binding sites for metabolic transcription factors and associated activatory/inhibitory histone modifications, based on published ChIP-seq studies.54,57,58,59 The abundance of activatory histone mark H3K27ac upstream of the CTCF gene loci, seemed to be higher in 24 h starved mice liver (Figure 4I). Moreover, we found consensus motifs for CREB, PPARα, THRb and SREBP2 at promoter-proximal sites on the CTCF gene (Figures 4J, and S3E). To tease out the upstream mechanism that regulates CTCF expression we chose to investigate the roles of PKA-CREB and PPARα pathways, which are central for transcription under fasting conditions. We treated primary hepatocytes with forskolin, a known activator of CREB via Adenylate cyclase-PKA pathway, and saw a significant increase in CTCF transcript levels (Figures 4K, and S3F). Similarly, treating primary hepatocytes with WY14643 (a known agonist of PPARα) resulted in elevated CTCF mRNA, even under a high glucose condition (Figure 4L). These evidently demonstrated feed-fast dependent dynamic regulation of CTCF expression in the liver and uncovered interplay between metabolic inputs and a chromatin organizer protein.
Paradoxical starvation-dependent loss of CTCF from chromatin
Given that CTCF expression in the liver was regulated by metabolic states, it was imperative to investigate genome-wide occupancy of CTCF in livers isolated from starved mice. Principal component analysis of CTCF ChIP-seq replicates in the fed and starved datasets revealed separation in PC2 (Figure S4A). Contrary to our expectations, we found a smaller number of CTCF-bound peaks during starvation (Figures S1B and S4B), although CTCF peaks in the starved state showed similar genome-wide distribution as compared to fed condition (Figure S4C). Furthermore, on comparing with our fed CTCF ChIP-seq dataset, almost all starvation CTCF peaks overlapped with those in the fed state (Figure S4D) with an overall dampening of peak scores and no change in positional clustering (Figure 5A). Differential CTCF binding at some of these loci (Figures 5B and S4E) were validated using ChIP-qPCRs from chromatin isolated from independent mice cohorts (Figure 5C). GO analysis of genes having promoter-proximal CTCF-binding in fed and fasted states showed the enrichment of similar biological processes/pathways that are involved in cellular response to insulin stimulus, lipid metabolic processes and glucose homeostasis with a reduction in the number of genes and, hence, lower statistical significance for these pathways in starved condition (Figure S4F, Table S2).
Figure 5.

Starvation-induced reduction in genome-wide chromatin occupancy of CTCF
(A) Profile of CTCF ChIP-seq signal intensities (normalized using respective input controls) on protein-coding genes in ad-lib fed and 24 h starved livers and clustered (k-mean) based on CTCF binding profile across gene body and 2 kb upstream and downstream of TTS and TTS, respectively.
(B and C) CTCF-ChIP-seq peaks scores (B) and ChIP-qPCR validation (n = 3, representative from N = 2) (C) in ad-lib fed (11 p.m.) and 24 h starved (8 p.m. onwards) mice livers at the CTCF binding sites shown in Figure S4E (Green Boxes).
(D) Profile of CTCF-ChIP-seq signal intensities in ad-lib fed and 24 h starved liver on genes that are differentially expressed in respective conditions (Figure 3A).
(E) Relative CTCF ChIP-seq signal intensity (24 h starved/ad-lib fed) at promoter (TSS ±3 kb) of feeding and starvation-induced genes (n = 3).
(F) De novo motifs enriched at CTCF peaks in ad-lib fed and 24 h starved liver.
(G) Representative western blot of chromatin-associated and nucleoplasmic CTCF in ad-lib fed (11 p.m.) and 24 h starved (8 p.m. onwards) mice livers.
(H and I) Quantifications of (H) CTCF band intensities in chromatin fraction and (I) Ratio of chromatin-associated and nucleoplasmic CTCF in ad-lib fed (11 p.m.) and 24 h of starvation (8 p.m. onwards) mice livers. In H, CTCF band intensities from the chromatin fraction were normalized using H3 and for I, it has been further divided by the CTCF band intensities from the nucleoplasmic fraction (N = 3, n = 3). Data are represented as mean ± SEM. For C, E, H, & I statistical significance was calculated by using a Student’s t test (∗, p < 0.05; ∗∗, p < 0.01; ∗∗∗, p < 0.001). TSS-Transcription Start Site, TTS-Transcription Termination Site.
This intriguing observation prompted us to check if this loss of CTCF from the chromatin had any bias toward genes that are transcriptionally regulated in fed or fasted states. Relatively, starvation associated dampened binding of CTCF seemed to be more prominent at the promoters of starvation-induced genes as compared to fed-induced genes (Figures 5D and 5E). These observations were paradoxical because overall nuclear levels of CTCF were increased on fasting (Figures 4A–4E, S3A and S3B). This posited an intriguing possibility of starvation-dependent lowering of CTCF’s chromatin affinity.
Spatial and temporal variations in CTCF levels/binding across the genome have been evidenced earlier.31,32,33,60,61 More importantly, distinct CTCF recognition motifs are known to influence the strength of its association with chromatin.62 However, physiological significance of differential CTCF binding is poorly characterized especially in an in vivo context. Our motif analysis revealed distinct enrichment of weak and strong CTCF binding sites between fed and fasted states (Figure 5F). Specifically, the loss of CTCF peaks in a fasted state, and conversely gain in a fed state, was correlated with consensus sequence that has been described to cause weaker interactions.33,62 To confirm this, we evaluated the levels of chromatin-bound versus nucleoplasmic CTCF from fed and starved mice livers. As expected, we found lower chromatin-bound CTCF with a significant shift to higher nucleoplasmic pools in starved livers (Figures 5G–5I). Together, these observations highlighted the starvation-dependent tunable pools of CTCF, which displayed changes in expression and chromatin association during fed-fast cycles.
Starvation-induced Jpx regulates differential chromatin association of CTCF in hepatocytes
A recent study reported that the long non-coding RNA, Jpx, influenced chromatin association of CTCF and seemingly reduced chromatin-bound CTCF, especially at low-affinity sites, in embryonic stem cells.33 However, upstream cues/mechanisms that regulate Jpx expression and hence, differential CTCF binding are largely unknown. In this regard, we mined through published datasets for Jpx expression in the liver and found the highest expression of Jpx at ZT8-ZT12 (ZT, zeitgeber time) that corresponds to peak starvation state (Figures S5A and S5B). We further validated this by assaying for Jpx transcript at different ZT time points in ad-lib fed mice liver (Figure S5B, purple line) and post 24 h of starvation at both ZT13 and ZT1 (Figures S5C and S5D). Of interest, Jpx expression showed a two-step increase during starvation, at early 8 h and late 24 h, as indicated (Figure 6A). Because Jpx was earlier reported to antagonize CTCF on the chromatin,33,63 we wanted to check if this was valid in liver. Thus, we quantified the chromatin association of Jpx under fed and fasted conditions and observed a significant enrichment of chromatin-associated Jpx under starvation, which further supported our hypothesis (Figure 6B).
Figure 6.

Starvation-dependent induction of Jpx expression in the liver and its effects on CTCF chromatin occupancy
(A) Relative RNA expression of Jpx in ad-lib fed (7 a.m.) and after different duration (4, 8, 12, 16, 20 and 24 h) of starvation (7 a.m. onwards) in mice liver. Jpx RNA was normalized to actin (Actb) transcript levels and plotted as fold change with respect to ad-lib fed (N = 2, n = 3).
(B) Relative expression of chromatin-bound Jpx in ad-lib fed and 24 h starved livers, normalized to Hotair transcript levels and plotted as fold change with respect to ad-lib fed (N = 2, n = 2–3).
(C) Representative immunoblot of chromatin-associated (Left) and whole cell (Right) CTCF in primary hepatocytes transfected with si-Jpx (Jpx KD)/si-Control (Control KD).
(D) Quantification of chromatin-associated CTCF in primary hepatocytes transfected with si-Jpx/si-Control. CTCF band intensities were quantified with H3 as a loading control and presented as fold change in comparison to si-Control (N = 2, n = 2).
(E) Relative RNA expression of Jpx in primary hepatocytes treated with glucagon (30 nM) in LG medium for 3 h, normalized with actin (Actb) transcript levels and plotted as fold change with respect to untreated cells (N = 2, n = 3).
(F) Genome Browser (IGV) snapshots of PPARα ChIP-seq peaks in the starved liver and DNase I Hypersensitivity-sites (DHS-seq) in ad-lib fed and 24 h starved liver at Jpx gene-coding locus.
(G) Relative RNA expression of Jpx in primary hepatocytes treated with WY14643 (50 μM) in HG media for 24 h, normalized with actin (Actb) transcript levels and plotted as fold change with respect to untreated cells (N = 2, n = 3). Data are represented as mean ± SEM. For A, statistical significance was calculated by using one-way ANOVA with Dunnett’s test for multiple comparison against ad-lib fed control and for B, D, E & G, using a Student’s t test (∗, p < 0.05; ∗∗, p < 0.01; ∗∗∗, p < 0.001).
Even though our results indicated that enhanced Jpx expression and its chromatin association are reciprocal to chromatin-bound CTCF, it was correlative. Thus, to confirm this negative interplay between Jpx and CTCF in hepatocytes, we knocked down Jpx and measured the extent of CTCF binding to chromatin. Notably, in our efforts to mirror a physiological setting, we specifically chose transfection paradigms that led to a moderate reduction in Jpx as indicated in Figure S5E. Importantly, when compared to scrambled siRNA-treated hepatocytes, levels of chromatin-bound CTCF increased significantly when Jpx was knocked down (Figures 6C and 6D). These results substantiated that the metabolic cues regulating Jpx expression dictate CTCF stability on chromatin and corroborated our CTCF-ChIP-seq data under fed and fasted conditions.
These results further prompted us to dissect out upstream mechanisms that govern Jpx expression, which as mentioned earlier, is unknown. We surmised that metabolic and endocrine inputs, which are classically activated in starvation, would possibly be involved in regulating Jpx. Thus, we scored for Jpx expression in primary hepatocytes grown in media with or without glucose and found that glucose deprivation resulted in a moderate elevation of Jpx transcript (Figure S5F). It is interesting to note that, more than glucose deprivation, glucagon treatment led to a robust increase in the levels of Jpx (Figure 6E). Because starvation cues are known to elicit transcriptional control through well-known mediators of hepatic gene expression, we were keen to identify the transcription factor that was involved. Screening for transcription factor consensus motifs combined with our in-silico efforts using published data from ChIP-seq57 and DHS-seq54 from the liver pointed to the potential involvement of PPARα (Figure 6F). Consistent with this conjecture, we indeed found enhanced levels of Jpx when hepatocytes were treated with PPARα agonist (Figure 6G). However, we cannot rule out the involvement of other transcription factors, which need to be investigated in the future. Nonetheless, our results confirm that metabolic and endocrine signals are key regulators of starvation-induced Jpx expression in the liver.
CTCF regulates starvation associated transcriptional and metabolic transition
Results presented above pointed toward a possible regulatory role for CTCF during physiological transition associated with starvation response. Therefore, it was intuitive to assess the downstream consequences on hepatocellular physiology in terms of gene expression and metabolism following gain-/loss-of-function perturbations of CTCF (Figures S6A, S6C and S6D).
Hepatic response to starvation entails orchestrated cascades of gene expression and metabolic pathways, which show distinct patterns during the early and late phases of starvation.36 Hence, we were tempted to assess if CTCF had any role in this regard. Toward this, we treated hepatocytes in-culture with glucagon as indicated (shifting from high glucose to low glucose media + glucagon) (Figure S6A). Consistent with the literature,51 there was a robust increase in downstream phosphorylation of CREB (nodal TF responsive to glucagon) and a temporal change in expression of genes involved in glucose and fat homeostasis in the controls (Figures S6A and S6B). However, CTCF overexpression led to disparate effects on expression in a gene-specific manner (Figures S6B). The temporal transcriptional response was dampened for some of the genes (e.g., Sirt1, Ppargc1a) whereas there was no effect on those associated with lipid/cholesterol homeostasis (Figures S6B). This differential susceptibility to CTCF overexpression is indeed intriguing and needs to be probed further in the future. However, it is likely that this differential response is context-dependent and associated with early starvation response, which is elicited by glucagon treatment.
Mitochondrial energetics, lipid and cholesterol metabolism were the metabolic pathways that were highlighted in our GO analyses from CTCF ChIP-seq (Figures 3E and 3F). Given that these are also differentially regulated in fed and fasted states, we wanted to check if changes in CTCF expression have any impact on mitochondria and hepatic fat metabolism. On assaying for mitochondrial energetics under extended glucose deprivation, we found the expected increase in mitochondrial oxygen consumption rate (OCR) in hepatocytes and exogenous expression of CTCF led to enhanced OCR (Figures 7A and S6C). Importantly, the effect of overexpression was more conspicuous in hepatocytes grown under high-glucose medium and was comparable to control cells grown in no-glucose medium. Conversely, knocking down CTCF led to dampened mitochondrial respiration with a prominent impact on hepatocytes grown under no-glucose medium and phenocopied control cells grown in the presence of high-glucose (Figures 7B and S6D). Furthermore, specific measures such as basal-/maximal-respiration and ATP production were bidirectionally altered in a manner that indicated an interplay between metabolic state and extent of CTCF expression (Figures S6E and S6F). This was correlated with changes in the expression of genes involved in mitochondrial OxPhos, which was also sensitive to the extent of CTCF overexpression in a temporal manner (Figures 7C, S6G and S6H). Clearly indicating a critical role of CTCF in regulating hepatocyte gene expression, we found converse effects when CTCF was knocked down (Figure S6I).
Figure 7.

Effects of CTCF perturbations on metabolic transitions at cellular and organismal level
(A and B) Oxygen consumption rate (OCR) in primary hepatocytes treated with HG and NG media with CTCF overexpression (A) or knockdown (B). Representative graph showing basal OCR and on oligomycin, FCCP, and rotenone treatments (n = 5).
(C) Heatmap depicting relative expression of mitochondrial genes in primary hepatocytes transduced with Ad-CTCF or Ad-Control for 12 h and treated with HG and NG media for 6 h, normalized with H2a transcript levels and represented as fold change in comparison with Ad-Control (N = 2, n = 3).
(D) Representative images of Oil Red O staining of primary hepatocytes cultured in HG medium for 16 h and transduced with Ad-CTCF/Control, captured at 60× magnification (scale bar depicts 50μm).
(E) Relative quantifications of Oil Red O staining in primary hepatocytes transduced with Ad-CTCF or Ad-Control and treated with HG medium for 16 h (N = 2, n = 3–4).
(F) Relative fold changes in lipidomic profiles of primary hepatocytes transduced with Ad-CTCF or Ad-Control and treated with HG or NG media for 16 h (N = 2, n = 6–8). (G) mRNA expression of CTCF in fed and 48 h starved w1118 flies, normalized to RpL32 transcript levels and plotted as fold change with respect to fed (N = 2, n = 3 with 8 flies per n).
(H) Representative plot for starvation survival of 3–5 days old actingal4>w1118 and actingal4>CTCFRNAi flies (n = 6 with 10 flies per n).
(I) Maximal survival under starvation in actingal4>w1118 and actingal4>CTCFRNAi flies (N = 2, n = 6 with 10 flies per n).
(J) Heatmap depicting relative expression of the indicated mRNA in fed and 48 h starved actingal4>CTCFRNAi flies, normalized to RpL32 transcript levels and plotted as fold change with respect to the control-actingal4>w1118 flies (N = 2, n = 3 with 8 flies per n). Data are represented as mean ± SEM. For C, E, G, I & J, statistical significance was calculated by using a Student’s t test and (∗, p < 0.05; ∗∗, p < 0.01; ∗∗∗, p < 0.001).
Given this, we anticipated an effect on lipid metabolism and indeed found that the total amount of neutral lipids had increased in hepatocytes transduced with CTCF (Figures 7D and 7E). To gain more insights, we carried out lipidome profiling of hepatocytes in control and CTCF-transduced cells. We found a robust change in the overall lipid profile when CTCF was exogenously expressed in high-glucose medium to an extent that resembled the CTCF levels we had found in glucose-deprived states (Figures S6G). Intriguingly, although levels of fatty acids and acyl-glycerols were elevated, the abundance of cholesterol and its esters were reduced (Figure 7F). The cellular concentrations of other lipid species seemed comparable across the treatment regime clearly indicating an impact of CTCF expression changes on specific lipid pathways. We also found that the effect of CTCF perturbation was non-linear and led to a time/dosage-dependent changes in expression of genes involved in hepatic metabolism (Figures S6G and S6J). Taken together, results presented here suggest that the effect of CTCF on transcription is likely more complex with some pathway genes more responsive than others and dictated by metabolic context that encompasses endocrine and nutrient inputs. Nonetheless, our findings demonstrate that metabolism driven changes in CTCF expression play a crucial role in regulating the hepatic mitochondrial energetics and physiology during starvation.
Reduced starvation survival in CTCF-RNAi flies indicates evolutionary conservation
Albeit the results presented above established CTCF as a mediator of feed-fast dependent hepatic gene expression, we wondered if this impacted the physiological consequence at an organismal level vis-à-vis response to starvation stress. This is relevant because others and we have earlier illustrated the importance of transcriptional mechanisms in providing fitness and dictating the ability of an organism to mitigate starvation stress.64,65,66 However, whether a chromatin organizer protein such as CTCF is required for starvation response has not been addressed, thus far. Toward this, owing to the limitations posed by mouse models, we chose to utilize Drosophila as a model to address this. Moreover, it was also tempting to unravel evolutionary conservation of the interplay between CTCF and metabolism.
It is important to note that CTCF and its orthologues have been shown to have evolutionarily conserved chromatin regulatory functions.7,27,67 Of interest, we found CTCF expression to be responsive to starvation in flies (Figure 7G), similar to that observed in mice liver (Figures 4 and S3). Given this and our findings from hepatocytes, it was intuitive to investigate if CTCF influenced starvation survival and thus, we evaluated the same in control and CTCF-RNAi flies (Figure S6K), as described earlier.66 It is interesting to note that knocking down CTCF led to a significant reduction in survival when compared to controls (Figures 7H–7I). Moreover, CTCFRNAi-flies displayed perturbed expression of genes involved in fat metabolism (Figure 7J). In addition to highlighting evolutionary conservation of the interplay between CTCF and metabolism, these results demonstrated that CTCF was central in determining physiological fitness at an organismal level.
Discussion
The plasticity of gene expression is a key determinant of metabolic flexibility. Metabolic flexibility itself, especially in the context of feed-fast cycles, is critical to maintain physiological homeostasis.68 Metabolic inputs that drive epigenomic and transcription factor-dependent gene expression reprogramming are well-established.38,39,69,70,71 However, the role of chromatin architectural proteins (viz. CTCF) in eliciting a global/network level temporal control over gene expression in response to metabolic transitions, remains unknown. Moreover, in vivo significance of coupling chromatin architecture, gene-expression cascades and physiological homeostasis has not been studied so far. Although, recent studies highlight the interplay between cellular metabolic states and CTCF, they are largely confined to cell lineage commitment and those in transformed/cancer cells.61,72,73 In this regard, findings presented above clearly demonstrate an intricate causal interplay between metabolism and expression and chromatin association of CTCF, which was hitherto unknown. Furthermore, this report illustrates the central role of CTCF in mediating physiological transitions during feed-fast cycles.
Seminal studies have elucidated the pivotal role of CTCF in organizing chromatin and thus on gene expression programs. However, CTCF is generally considered to be a relatively stable or less dynamic regulatory molecule. Albeit emerging literature indicates that CTCF expression and chromatin association is malleable,29,31,74 the upstream mechanisms and downstream physiological consequences are poorly understood. In this context, we demonstrate that CTCF expression is dynamically regulated by fed and starvation-dependent metabolic inputs, which was previously unknown. We show transcriptional and protein-level induction of CTCF in response to starvation, in vivo and in primary hepatocytes grown under conditions mimicking nutrient deprivation. Our attempts to tease out the mechanisms have revealed a potential role of PPARα and CREB in regulating the expression of CTCF, by virtue of the starvation signals that impinge on these factors. We have provided confirmatory evidence, using a combination of in-silico analyses and molecular approaches, including via pharmacological and physiological treatments that evoke metabolic cues as in starvation. Moreover, these exciting findings raise new hypotheses vis-à-vis CTCF and chromatin functions in other physiological contexts wherein cellular metabolism is known to drive both short-term and long-term changes in gene expression.
CTCF ChIP-seq from fed and fasted livers led to unexpected results, especially w.r.t. its hepatic abundance and chromatin association. Although very recent studies have indicated chromatin contexts that lead to differential binding affinities/specificities of CTCF, if/how this influences its functional output is unclear.33 Nonetheless, consensus motifs and competition mediated by long non-coding RNA-Jpx seem to dictate the strength of CTCF-chromatin interactions in the hepatic cells of the liver. Specifically, our results illustrate both DNA-sequence and Jpx-dependent divergent binding specificities for CTCF during fed and fasted conditions. It is important to note that our findings explicitly establish the upstream starvation-induced mechanisms that dictate Jpx expression and the consequent change in its association with the chromatin, which ultimately results in altered affinity of CTCF to chromatin, globally. These are significant findings not only because molecular factors that regulate Jpx have not been characterized earlier, but also for identifying a separate physiological setting where the antagonistic interaction between Jpx and CTCF affects chromatin function.
It was intriguing to find that the expression of Jpx and CTCF are co-regulated by similar metabolic cues (glucagon and PPARα dependence). However, based on emerging studies on mechanisms that govern dynamic physiological transitions, including from our work,38,39 it is tantalizing to propose this as a tunable and plastic molecular interplay during fed-fast cycles. Although speculative, this could provide a survival advantage given that fed-fast-refed transitions are often unanticipated and would invoke rapidly pliable mechanisms. Nonetheless, the significance of starvation-dependent co-regulation of expression and functional opposition of Jpx and CTCF will require further investigation.
In addition, earlier studies have shown metabolic state-dependent malleability in CTCF’s affinity for DNA during oncogenic transformation or differentiation, which is dependent on phosphorylation of CTCF60 or differential DNA methylation at its genomic loci.61,72,75 In this context, although we have not investigated these in fed-fast cycles, and cannot rule them out, we have unveiled the importance of the metabolism-Jpx-CTCF axis. Whether this is also influenced by PTM-based and/or DNA methylation-dependent differential chromatin association of CTCF will have to be studied in the future.
Given the dynamic nature of cellular metabolism, orchestrating coordinated gene expression, more so to create a temporal cascade to synchronize availability of nutrients and metabolic/energy demands becomes essential. Earlier attempts to characterize higher-order chromatin organization, including in the context of circadian rhythm, have indicated that TADs/sub-TADs may have a role in regulating gene expression changes.76,77 But molecular mechanisms and more importantly the downstream physiological effects are relatively less understood. In this regard, concurrent studies have linked CTCF functions with metabolism and mitochondrial biogenesis, energetics and dynamics in adipocytes,75 pancreas78 and cardiomyocytes.79 Furthermore, Choi et al. recently reported that loss of CTCF affects expression of PPARγ and its downstream genes, and results in altered hepatic lipid homeostasis.46 Although, these indicate that CTCF is required for regulating metabolic gene expression, these have largely stemmed from perturbations such as genetic mutants or DNA methylation changes. In this regard, it is necessary to highlight that by uncovering feed-fast dependent changes in CTCF expression and chromatin association, we have provided a physiological context to transient alterations in CTCF functions, which could not have been uncovered using a genetic knockout model.
More importantly, our findings clearly illustrate the control exerted by metabolic cues in determining the expression, chromatin affinity and functions of hepatic CTCF, which is in turn essential for physiological homeostasis. We also posit that, mechanistically, it is plausible that the abundance of CTCF and endocrine/metabolic cues act in concert to regulate the expression of hepatic genes. In highlighting the physiological costs of perturbing CTCF expression, we also bring to fore the evolutionary conserved association of CTCF starvation response from invertebrates and vertebrates. In conclusion, our findings bring to the fore the interesting bidirectional interplay between chromatin architecture and metabolism in orchestrating temporal cascades of gene expression and physiological response which are vital for organismal survival.
Limitations of the study
One of our intriguing findings is the paradoxical increase in CTCF expression whilst reduced chromatin interaction during starvation in the liver. If and how the chromatin unbound nuclear CTCF contribute to the starvation response needs further investigation. In addition, although our in-silico analyses consider TSS-bound CTCF, CTCF binding that is differentially regulated at genic and intergenic sites has not been addressed. Mechanistically, it is not clear whether elevated Jpx during starvation exerts disparate control of CTCF affinities in a loci-specific manner. Notably, the field lacks tools/systems to perturb loci-specific recruitment of CTCF and especially in response to physiological alterations. In addition, in flies, we have observed evolutionary conserved regulation of CTCF expression in fed and starved states, but whether this leads to tissue and loci-specific differential association of CTCF to chromatin has not been investigated. However, given the context, our findings will motivate standalone studies, in the future, to reveal further mechanistic details.
STAR★Methods
Key resources table
| REAGENT or RESOURCE | SOURCE | IDENTIFIER |
|---|---|---|
| Antibodies | ||
| Mouse monoclonal anti-β-Tubulin | Sigma-Aldrich | Cat# T0198; RRID:AB_477556 |
| Mouse monoclonal anti-Actin | Sigma-Aldrich | Cat# A1978; RRID:AB_476692 |
| Histone H3 | Abcam | Cat# ab1791; RRID:AB_302613 |
| Rabbit monoclonal anti-CTCF | Abcam | Cat# ab188408; RRID:AB_2819212 |
| Rabbit monoclonal anti-CTCF | Cell Signalling Technology | Cat# 3418; RRID:AB_2086791 |
| Rabbit polyclonal anti-HA | Abcam | Cat# ab9110; RRID:AB_307019 |
| Rabbit monoclonal anti-CREB | Cell Signalling Technology | Cat# 9197; RRID:AB_331277 |
| Rabbit monoclonal anti-Phospho-CREB (Ser133) | Cell Signalling Technology | Cat# 9196; RRID:AB_331275 |
| Anti-Rabbit IgG- Peroxidase | Sigma-Aldrich | Cat# A0545; RRID:AB_257896 |
| Anti-Mouse IgG- Peroxidase | Sigma-Aldrich | Cat# A9044; RRID:AB_258431 |
| IgG from rabbit serum | Sigma-Aldrich | Cat# I8140; RRID:AB_1163661 |
| Alexa Fluor 647-conjugated anti-rabbit antibody | Thermo Fisher Scientific | Cat# A-21244; RRID:AB_2535812 |
| Rabbit polyclonal anti-CTCF | Diagenode | Cat# C15410210; RRID:AB_2753160 |
| Rabbit IgG | Diagenode | Cat# C15410206; RRID:AB_2722554 |
| Bacterial and virus strains | ||
| Ad-CMV-HA-CTCF | This paper | N/A |
| Ad-CMV-Control | This paper | N/A |
| Chemicals, peptides and recombinant proteins | ||
| RNaseOUT™ Recombinant Ribonuclease Inhibitor | Invitrogen | 10777019 |
| Random Hexamer (50uM) | Invitrogen | N8080127 |
| TriZol | Invitrogen | 15596018 |
| DEPC treated water | Invitrogen | AM9915G |
| UltraPure Distilled Water | Invitrogen | 10977015 |
| dNTP Mix | Genei | 652400021730 |
| DAPI | Roche | 10236276001 |
| Glucose Solution | Gibco™ | A2494001 |
| L- Glutamine | Sigma-Aldrich | 59202C |
| Sodium Pyruvate | Sigma-Aldrich | S8636 |
| Oligomycin | MP Biomedicals | 215178605 |
| FCCP | Sigma-Aldrich | C2920 |
| Rotenone | Sigma-Aldrich | R8875 |
| Collagenase | Sigma-Aldrich | C5138 |
| Rat tail collagen | Sigma-Aldrich | C3867 |
| High Glucose DMEM | Sigma-Aldrich | D7777 |
| Low Glucose DMEM | Sigma-Aldrich | D5523 |
| DMEM without glucose | Sigma-Aldrich | D5030 |
| Fetal Bovine Serum | Gibco™ | 10270106 |
| Antibiotic Antimycotic Solution | Sigma-Aldrich | A5955 |
| Sodium pyruvate | Sigma-Aldrich | P225 |
| EGTA | Sigma-Aldrich | E3889 |
| EDTA | Sigma-Aldrich | E9884 |
| Bovine serum albumin | MP Biomedicals | 160069 |
| DTT | Sigma-Aldrich | 578517 |
| Tris Base | Himedia | MB029 |
| Glucagon | Sigma-Aldrich | G2044 |
| Forskolin | Sigma-Aldrich | F3917 |
| WY-14643 | Sigma-Aldrich | C7081 |
| HEPES | USB | 16926 |
| 20% SDS | Himedia | ML007 |
| Formaldehyde | SDFCL | 38421-L05 |
| Magnetic Protein A beads | Biorad | #1614013 |
| Ribonucleases A | Sigma-Aldrich | R4875 |
| Proteinase K | Roche | REF03115879001 |
| Lipofectamine™ RNAiMAX Transfection Reagent | Invitrogen™ | 13778150 |
| IGEPAL® CA-630 | Sigma-Aldrich | I3021 |
| Triton X-100 | Sigma-Aldrich | T8787 |
| Lithium chloride | Sigma-Aldrich | L9650 |
| Sodium deoxycholate | Sigma-Aldrich | SRE0046 |
| Sodium Bicarbonate | Himedia | TC230 |
| Sodium Bicarbonate | Sigma-Aldrich | S6014 |
| Sodium Chloride | MPTM | 194848 |
| cOmplete™, EDTA-free Protease Inhibitor Cocktail | Roche | COEDTAF-RO |
| PhosSTOP™ | Roche | PHOSS-RO |
| Phenylmethanesylfonyl fluoride (PMSF) | Sigma-Aldrich | P7626 |
| Bicinchoninic Acid solution | Sigma-Aldrich | B9643 |
| Tween 20 | Himedia | TC287 |
| PVDF Membrane | Millipore | IPVH00010 |
| Skim milk powder | Himedia | GRM1254 |
| Paraformaldehyde | Sigma-Aldrich | 158127 |
| Oil Red O | Sigma-Aldrich | O0625 |
| Critical commercial assays | ||
| Seahorse XFe24 FluxPaks | SeaHorse Bioscience | 102340-100 |
| Chemiluminescence detection kit | Thermo Scietific | 34095, 34080 |
| SuperScript-IV RT kit | Invitrogen | 18090200 |
| KAPA SYBR® FAST Universal 2X qPCR Master Mix | Roche | SFUKB |
| iDeal ChIP-seq kit for Transcription Factors | Diagenode | C01010170 |
| High Sensitivity NGS Fragment Analysis Kit | Agilent | DNF-474 |
| Agencourt AMPure XP | Beckman Coulter | N/A |
| MicroPlex Library Preparation Kit v2 (12 indexes) | Diagenode | C05010012 |
| Qubit™ dsDNA HS and BR Assay Kits | Invitrogen | Q32854 |
| Deposited data | ||
| CTCF ChIP-seq fed and fasted mice liver | This Paper | GEO: GSE207692 |
| RNA-seq and DHS-seq from ad-lib fed and 24 hrs starved liver, CEBPb, CREB, GR, H3K27ac (Fed and 24 hrs Fasted) ChIP-seq | Goldstein et al.54 | GEO: GSE72087 |
| PPARα and PPARδ ChIP-seq | Sommars et al.57 | GEO: GSE118789 |
| RXR (Bexarotene treated) and LXR (T0901317 treated) ChIP-seq | Boergesen and Mandrup80 | GEO: GSE35262 |
| HNF4α (ZT16) ChIP-seq | Qu et al.81 | GEO: GSE118007 |
| ERRα ChIP-seq | Chaveroux et al.82 | GEO: GSE43638 |
| FOXO1 (unfed) ChIP-seq | Kalvisa et al.83 | GEO: GSE119713 |
| THRb (T3 treated) ChIP-seq | Ramadoss et al.58 | GEO: GSE52613 |
| SREBP2 ChIP-seq | Seo et al.59 | GEO: GSE28082 |
| SREBP1 (ZT14) ChIP-seq | Gilardi et al.84 | GEO: GSE48375 |
| REV-ERBα and REV-ERBβ (ZT8)- | Cho et al.85 | GEO: GSE34020 |
| BMAL, PER1, PER2, CLOCK, NPAS2, CRY1, CRY2, RNA POL-II Ser5-P, RNA POL-II 8WG16, CBP, p300 ChIP-seq | Koike et al.86 | GEO: GSE39860 |
| RAD21, SMC3 ChIP-seq | Schwarzer et al.87 | GEO: GSE93431 |
| RNA-seq from liver collected at different ZTs in ad-libitum condition- | Guan et al.88 | GEO: GSE143528 |
| Experimental models: cell lines | ||
| Human: HEK293 | ATCC | CRL-1573; RRID:CVCL_0045 |
| Human: HEK293T | ATCC | CRL-11268; RRID:CVCL_1926 |
| Experimental models: organisms/strains | ||
| Mouse: C57BL/6NCrl | CRL | Strain No: 027; RRID:IMSR_CRL:027 |
| Fly: w1118 | Bloomington Drosophila Stock Center (BDSC) | Strain No.: 5905; RRID:BDSC_5905 |
| Fly: UAS-CTCF-RNAi | Bloomington Drosophila Stock Center (BDSC) | Strain No.: 40850; RRID:BDSC_40850 |
| Fly: Actingal4 (w∗; PAct5C-GAL425FO1/CyO) | Gift from Maithreyi Narasimha lab at TIFR Mumbai | N/A |
| Oligonucleotides | ||
| Control and CTCF KD GapmeRs | Qiagen | 339518 LG00240087-EFA, 339518 LG00240081-EFA, 339516 LG00000002-EFA |
| Control and Jpx siRNA | Dharmacon, ON-TARGETplus | R-174220-00-0005, D-001810-10-05 |
| Recombinant DNA | ||
| pAdTrack-Control | He et al.89 | pAdTrack-CMV (Plasmid #16405) |
| pAdTrack-HA-CTCF | This Paper | N/A |
| Software and algorithms | ||
| ImageJ | ImageJ | https://imagej.nih.gov/ij/ ; RRID:SCR_003070 |
| Galaxy | Afgan et al.90 | https://usegalaxy.org/ ; RRID:SCR_006281 |
| DAVID | Huang et al.91,92 | https://david.ncifcrf.gov/ ; RRID:SCR_001881 |
| HOMER (v4.11, 10-24-2019) | Heinz et al.93 | http://homer.ucsd.edu/homer/ ; RRID:SCR_010881 |
| Ensembl BioMart | Cunningham et al.94 | https://nov2020.archive.ensembl.org/biomart/martview ; RRID:SCR_010714 |
| Lift Genome Annotations | N/A | https://genome.ucsc.edu/cgi-bin/hgLiftOver |
| CircadiOmics | Agostinelli et al.,95 Ceglia et al.,96 Patel et al.97 | http://circadiomics.ics.uci.edu/ |
| bedtools v2.30.0 | Quinlan and Hall98 | https://bedtools.readthedocs.io/en/latest/content/tools/intersect.html; RRID:SCR_006646 |
Resource availability
Lead contact
Further information and requests for resources and reagents should be directed to and will be fulfilled by the lead contact, Ullas Kolthur-Seetharam (ullas@tifr.res.in).
Materials availability
Key plasmid constructs and adenoviral constructs generated in this study are available from the lead contact upon request.
Experimental model and subject details
Animal experiments
3–4-month-old male C57BL6NCrl mice housed under a standard condition of 12 hrs of light/dark cycle were used for all the animal experiments. All animal husbandry and procedures on the animals were approved by and performed as per the guidelines of the institute animal ethics committee (IAEC, 56/GO/ReBi/S/1999/CPCSEA). Animal health and immune status were monitored by the staff veterinarians at fixed intervals as per IAEC guidelines. For the feed-fast paradigm, mice had either ad-libitum excess to normal chow diet or were starved for 24 hrs under two paradigms based on tissue collection time, 1) (a) Ad-lib fed 8 am group: - tissue harvested at ZT-1 compared to (b) 24 hrs starved 8 am group: -fasted for 24 hrs starting from ZT-1, 2) (a) Ad-lib fed 11 pm group: - tissue harvested at ZT-16 compared to (b) 24 hrs starved 8 pm group: -fasted for 24 hrs starting from ZT-13. For the ad-libitum fed and starvation time course paradigm, mice had either ad-libitum access to feed or starved for different durations starting from ZT-0 (7 am) and tissues were collected in the interval of 4 hrs. Liver tissues harvested at the conditions stated above were either snap-frozen in liquid nitrogen for liver sectioning, protein and RNA isolation or fixed in formaldehyde for chromatin immunoprecipitation.
Primary hepatocyte isolation and culture
Primary hepatocytes were isolated from 10–12-week-old C57BL6NCrl male mice. Livers were perfused via inferior vena cava, first with Buffer A (HBSS, 1mg/ml D-Glucose, 25mM HEPES and 0.5mM EGTA and subsequently with digestion media (low glucose DMEM (LG, 5 mM glucose), antibiotic antimycotic solution (AA), 15mM HEPES, 19 mg collagenase type IV). Perfused livers were harvested, minced in digestion media and the homogenate was passed through 70-micron filters. The hepatocyte suspension was centrifuged at 50g for 5 mins in 4°C temperature. Cell pellet obtained was washed thrice with high glucose DMEM media (HG, 25 mM glucose) and was plated into collagen-coated cell culture plates in HG media with 10 % fetal bovine serum (FBS) and incubated at 37°C with 5%CO2. 6 hrs post-plating, culture media was replaced by serum-free HG media and left overnight.
Fly (D. Melanogaster) strains and growth conditions
w1118 and UAS-CTCF RNAi (BL40850) flies were procured from Bloomington Stock Centre (Indiana University, USA). Actingal4 (w∗; P{Act5C-GAL4}25FO1/CyO) flies were obtained as a generous gift from Maithreyi Narasimha lab, TIFR Mumbai. All flies were backcrossed to w1118 for at least four generations before using them for the assay. Flies were raised on a standard cornmeal diet (5% dextrose, 2.5% yeast extract, 8.6% cornmeal, 2% agar and 0.1% ortho-phosphoric and propionic acids) at a temperature of 25°C with a 12-hour light/dark cycle in a non-crowding environment. All the experiments were performed on 3–5 days old non-virgin, age-matched female flies and repeated at least twice.
HEK293 cell line culture for adenovirus preparation
Adenovirus titre enhancement and expansion were performed in HEK293 cells purchased from ATCC and grown under standard culturing conditions (DMEM-HG supplemented with 10% FBS, incubated at 37°C with 5%CO2). The cells were not authenticated since their purchase.
Method details
Adenoviral preparation
HA-CTCF was cloned into pAdTtrack CMV plasmid, which was a gift from Bert Vogelstein (Addgene plasmid #16405; http://n2t.net/addgene:16405; RRID: Addgene_16405). Adenovirus HA-CTCF was prepared according to the protocol mentioned by Luo et al.99 A low titre of control & HA-CTCF adenovirus was added to HEK293 cells and incubated for 4 days with continuous replenishment of HG media containing 10% FBS until 90-95% of cells were transduced and manifested GFP. Cells were collected and lysed in hypotonic buffer [HEPES (10mM, pH 7.5), MgCl2 (1.5mM), KCl (10mM), DTT (0.5mM)]. Viral titre was estimated from the supernatant-containing virus using fluorescent-based assay and flow cytometry (as mentioned in https://www.addgene.org/protocols/fluorescence-titering-assay) and was further used for all CTCF overexpression experiments. Overexpression was confirmed using immunoblotting and quantitative-PCR.
Primary hepatocyte culture paradigms
For CTCF overexpression experiments, Adenovirus-HA-CTCF were added during media replacement (6 hrs post-plating of primary hepatocytes) in the MOI of 3-15. CTCF knockdown in hepatocytes has been performed using GapmeR (Qaigen). Knockdown of Jpx in primary hepatocytes was performed using siRNA (Dharmacon, ON-TARGETplus R-174220-00-0005, D-001810-10-05). siRNA transfections were conducted using Lipofectamine RNAiMAX Transfection Reagent as per the manufacturer’s protocol. Experimental paradigms are described below.
Cells were treated with HG, LG and glucose-free DMEM (NG, 2mM Glutamine, 2mM Pyruvate) media for 6 /12 /16 /18 hrs as stated in the figure legends. For CTCF protein expression in HG / NG conditions, extracellular flux analyses and lipidomics, primary hepatocytes were treated with HG and NG for 16 hrs. For CREB-dependent CTCF expression, cells were treated with 10 μM forskolin in LG media for 12 hrs. For assessing glucagon-dependent regulation of Jpx expression, cells were incubated with 30 nM glucagon in LG media for 3 hrs. For PPARα dependent regulation of CTCF and Jpx expression, cells were incubated in HG media containing WY14643 for 10 and 24 hrs, respectively. For CTCF overexpression time-lapse, primary hepatocytes were transduced with Adenovirus-HA-CTCF(MOI=15) for 12 /18 /24 hrs and treated with HG / NG DMEM media for 6 hrs before collection. For the transcriptional transition paradigm, cells were treated with HG or LG DMEM containing 30nM of glucagon for 1 / 3 / 6 hrs. Cells were collected in RIPA buffer for protein analyses or Trizol for transcript analyses.
Starvation survival assay in fly (D. Melanogaster) and starvation-responsive gene expression
Flies reared on a standard cornmeal diet were transferred to vials containing only 2% agar. 10 flies were kept in each vial and a total of six vails are used per genotype in an assay. Every 12 hours, flies were transferred to new agar vials. To determine starvation survival, dead flies were counted after each transfer until all the members in the population died.
For characterising the effect of starvation on (a) CTCF’s expression or (b) expression of starvation-responsive genes in CTCF-RNAi, flies were collected after 48 hrs on 2% agar (as described above). Genotype-matched flies maintained on standard cornmeal were used as fed controls. In either case, flies were collected, snap frozen in liquid nitrogen and processed for RNA isolation and qPCR, as described below.
Seahorse extracellular flux analyzer
Mitochondrial Oxygen Consumption Rate (OCR) was assessed using the XFe24 Seahorse Bioscience Extracellular Flux Analyzer (Agilent). Mouse primary hepatocytes (1.8 × 10⁴ cells/well) were plated in a Seahorse tissue culture plate in HG DMEM media with 10% FBS. The assay was performed after incubation of hepatocytes in HG or NG DMEM media for 16 hrs. The OCR was measured in un-buffered XF base media (pH 7.4, supplemented with 25mM Glucose, 1mM Sodium Pyruvate and 2mM L-Glutamine). As per the manufacturer’s protocol, cells were incubated at 37°C for 45 mins in a non-CO2 incubator before starting OCR measurements. OCR (pmol/min) was assessed for basal rate and after each successive injection of 2 μM oligomycin, 2 μM FCCP and 1 μM Rotenone in three cycles. All the experiments were repeated at least twice and for each assay, OCR measurements from five biological replicates were background corrected with blank wells and normalized to the cell numbers in respective wells. Basal respiration, ATP production rate and maximal respiration were computed using data obtained from all the experimental replicates.
Chromatin immunoprecipitation (ChIP)
For ChIP-quantitative PCR
Livers were harvested and chopped into pieces of ∼25 mg, washed in cold PBS to remove the blood and immediately proceeded for fixation in 1 % formaldehyde for 15 mins at room temperature with continuous rocking. Fixation was quenched using 125 mM of glycine for 5 mins followed by two washes with PBS.
∼100 mg of fixed tissue was homogenized in cell lysis buffer (CLB, 10mM Tris HCl pH 8.0, 10 mM NaCl, NP40), lysed for 10 minutes on ice and centrifuged at 3500 rpm for 5 mins. The nuclear pellet was further washed twice with CLB, followed by lysis in nuclear lysis buffer (NLB, 50 mM Tris HCl pH 8.0, 10 mM EDTA, 1% SDS, 1% NP40) for 10 mins on ice. The lysates were diluted using ChIP dilution buffer (CDB, 0.01% SDS, 1.2 mM EDTA, 16.7 mM Tris HCl pH 8.0, 167 mM NaCl), snap-frozen in liquid N2 and thawed. Thawed lysates were sonicated in Bioruptor Pico sonicator (Diagenode) using 30 s ON/30 s OFF for 5-10 cycles. The sonicated lysates were centrifuged at 13000 rpm for 10 mins and the supernatant containing sheared chromatin was used first to check proper shearing followed by IP.
Magnetic Protein A beads blocked in CDB containing 0.01% of BSA and 0.1mg/ml of yeast tRNA were used for CTCF pull down from 20 μg of chromatin. Chromatin lysates were diluted with CDB and then were precleared for 1-2 hrs at 4ᵒC. Blocked Protein A beads were conjugated with CTCF /IgG antibodies for 1-2 hrs, washed once and overnight (∼14 hrs) incubated with precleared chromatin at 4ᵒC. 10 %(V/V) of the precleared chromatin was stored as input control. After immunoprecipitation, beads were given washes with cold buffers, in the following sequence: 2X Low Salt Buffer (LSB, 0.1% SDS, 1% Triton X-100, 2 mM EDTA, 20 mM Tris HCl pH 8.0, 150 mM NaCl), 1X High Salt Buffer (HSB, 0.1% SDS, 1% Triton X-100, 2 mM EDTA, 20 mM Tris HCl pH 8.0, 500 mM NaCl), 1X Lithium Chloride Buffer (LCB, 0.25 M LiCl, 1% NP40, 1% sodium deoxycholate, 1mM EDTA, 10 mM Tris HCl pH 8.0), 2X Tris-EDTA Buffer (TEB, 10 mM Tris HCl, 1 mM EDTA) and eluted for 30 mins at 65ᵒC in Elution Buffer (EB, 1% SDS, 0.1 M NaHCO3). Eluates were incubated with NaCl (conc. 200 mM) and sequentially treated with ribonucleases A (conc. 1 ug/ul) and proteinase K (at conc. 250 ug/ml). Final DNA was isolated using the standard Phenol: Chloroform DNA isolation method and extracted DNA samples were resuspended in nuclease-free distilled water. Enrichment of CTCF binding sites was examined using quantitative Polymerase Chain Reaction (Primers used are tabulated in Table S3)
For ChIP-Sequencing
ChIP-seq from adlib fed and 24 hrs starved mice livers was outsourced to Diagenode. Frozen liver tissue samples (3 biological replicates) were chopped into small pieces (between 1-3 mm3) using a scalpel blade on dry ice and were grinded using the Tissue Lyser II (Qiagen): 2 beads; 2 minutes at 25 strokes/sec. Grinded tissues were then fixed in 1% formaldehyde diluted in Fixation buffer for 15 mins at room temperature with moderate rotation on a DiaMag Rotator followed by quenching the fixation by adding 100 μl of Glycine. After 5 mins of incubation at room temperature with gentle mixing on a DiaMag Rotator, samples were then centrifuged at 850 x g for 5 mins at 4°C. Supernatants were discarded and pellets were washed with ice-cold PBS. Pellets obtained after centrifugation were kept on ice for further lysis and shearing. The chromatin was prepared using the iDeal ChIP-seq Kit for Transcription Factors as per the manufacturer’s instruction using 44 mg of tissue and finally resuspended in 400 μl of shearing buffer for further processing. Chromatin was sheared using Bioruptor® Pico sonication device using 30 s ON / 30 s OFF for 8 cycles. The shearing profile of all the samples was assessed using High Sensitivity NGS Fragment Analysis Kit on a Fragment AnalyzerTM (Agilent). ChIP was performed using IP-Star® Compact Automated System following the protocol of the aforementioned kit. 20 μg of Chromatin was used for immunoprecipitation using 2 μg CTCF and IgG antibodies. Chromatin corresponding to 1% was set apart as Input.
Library preparation was performed on chromatin immunoprecipitated and input DNA using the MicroPLEX v2 protocol. Libraries were pre-amplified to obtain enough DNA for sequencing and purified twice using AMPure beads. Different libraries were diluted to reach a final concentration of 5 nM each and then sequenced with Illumina technology (50 bp, single end). The sequencing was conducted on an Illumina HiSeq 3000/4000, running HiSeq Control Software HD version 3.4.0.38. FastQC was utilized for assuring quality of sequencing reads.100 Using BWA software v.0.7.5a,101 reads were aligned to the mouse reference genome (mm10) and filtered for areas blacklisted by the ENCODE project. Samtools102 were used to eliminate PCR duplicates and multi mapping reads. Statistically significant peaks were called using MACS2 with default parameters, a minimum FDR of 0.01 and Input samples (same genomic DNA with no immunoprecipitation step) as control files.103
ChIP-seq analysis
Bioinformatics analyses of fed and 24 h starved liver CTCF ChIP-seq were either performed in Galaxy (https://usegalaxy.org/) or homer (http://homer.ucsd.edu/homer/). Correlation analysis and PCA plots were generated using multiBamSummary, plotCorrelation and plotPCA. Biological triplicates of alignment files (bam) and MACS2 called CTCF peaks in ad-lib fed and 24 hrs starved samples were combined using Samtools merge and mergePeaks (Homer), respectively. Bigwig files of CTCF ChIP-seq were generated using either bamCoverage or bamCompare (using input samples as normalizing controls) and have been visualized in Integrative Genomics Viewer (IGV). Motif Analysis of CTCF peaks and promoter of CTCF bound genes were performed in homer using findMotifsGenome and findMotifs respectively. Genome-wide CTCF binding profiles were assessed using ChIPseeker (default parameters). Ensembl BioMart (https://nov2020.archive.ensembl.org/biomart/martview) had been utilized for all gene ID conversions and selecting protein-coding and non-coding genes. Overlap between fed and fasted CTCF peaks and histone marks, as well as transcription factors, were conducted using intersect- bedtools 2.30.0.98 HeatMaps of CTCF occupancy profile were pre-processed via computeMatrix and subsequently plotted and clustered(k-means) by plotHeatmap. Gene-Ontology analysis has been performed in DAVID (https://david.ncifcrf.gov/) and a p-value of 0.05 has been taken as a statistical cut-off to call all Biological Processes and Cellular Component.91,92
ChIP-seq of histone marks were obtained from ENCODE database and genome coordinates were lifted over to mm10 using UCSC (https://genome.ucsc.edu/cgi-bin/hgLiftOver). Published transcription factor ChIP-seq were either directly obtained as BED files or reanalysed. For reanalysis, raw read files were obtained using SRA and significant peaks were called using the standard pipeline. Briefly, reads were aligned to the mouse genome (mm10) using BWA and PCR duplicates were removed using samtools rmdup. Significant peaks (FDR<0.05) were called using MACS2. bamCompare was utilized for obtaining bigwig files and input files were used as a control. GEO datasets (https://www.ncbi.nlm.nih.gov/geo/) of all published data are mentioned in the key resources table.
Re -analysis of published RNA-seq dataset
Sequencing files of RNA-seq datasets were acquired using SRA numbers. Reads were aligned to mouse genome(mm10) using HISAT2. Gene expression from aligned files was measured using featureCounts. Read counts were normalized and differentially expressed genes (log2 fold change ≥1, FDR ≤0.05) were determined using DEseq2. Overlap of fed and fasted-induced genes with CTCF ChIP-seq were calculated using intersect- bedtools 2.30.0.98 GEO datasets of all published RNA-seq data are mentioned in the key resources table.
Jpx expression at different ZTs was also examined in published RNA-seq datasets from MOUSE LIVER CLOCK KNOCKOUT TRF PAOLO 2019 WT and MOUSE LIVER CLOCK KNOCKOUT AD LIBITUM PAOLO 2019 WT on the website CircadiOmics (http://circadiomics.ics.uci.edu/).95,96,97
Overlapping of CTCF ChIP-seq and differential DNase I hypersensitivity sites
Differential DNase I hypersensitivity sites (log2 fold change ≥1, FDR ≤0.05) in fed and 24 hrs starved liver were acquired from Goldstein et al.54 Overlap of fed and starvation-induced DNase I hypersensitivity (DHS) sites with CTCF ChIP-seq was calculated using intersect-bedtools 2.30.0.98 Genomic features enriched on DHS sites overlapping with CTCF peaks were assessed using ChIPseeker (default parameters) and GO analysis was performed in DAVID (https://david.ncifcrf.gov/) as described earlier.91,92
Cell fractionation
Tissue (∼100mg)/cells were homogenized in cell lysis buffer (CLB). The homogenate was incubated for 5 mins on ice and centrifuged at 3500 rpm for 5 mins at 4ᵒC. The pellet was given further two washes with CLB and then incubated in TNN buffer (50 mM Tris-Cl at pH=7.5 and 0.9% NP-40) containing either 150 mM or 300 mM of NaCl for 10 mins on ice continued by centrifugation at 12000 rpm for 10 mins. The supernatant was collected as a nucleoplasmic fraction. After giving two washes with TNN buffer of respective NaCl concentration, pellets were homogenized in RIPA buffer and sonicated in Bioruptor Pico sonicator using 30 seconds ON/30 seconds OFF for 4 cycles. The sonicated lysate was centrifuged at 12000 rpm for 10 mins and the supernatant was collected as a chromatin fraction. The protein concentrations for both fractions were estimated using BCA protein estimation assay as per the manufacturer’s instruction followed by boiling samples in SDS gel loading buffer.
Chromatin associated RNA isolation
∼100mg of fresh liver tissue was collected, homogenized in CLB and incubated in ice for 10 mins. The homogenate was centrifuged at 3500 rpm for 5 mins to pellet the nuclear fraction and washed twice in CLB (with RNase OUT, 0.6U/ul). The pellet was then lysed in TNN lysis Buffer (50 mM Tris-Cl at pH=7.5, 150 mM NaCl and 0.9% NP-40, 0.6U/ul RNase OUT) and incubated in ice for 10 mins. The homogenate was centrifuged at 12000 rpm for 10 mins to pellet the chromatin fraction and further washed once in TNN lysis buffer. The chromatin pellet was homogenized in TriZol reagent and processed for RNA isolation.
RNA isolation, reverse transcription and quantitative PCR
Total RNA was isolated from tissue/cells/flies using TriZol followed by cDNA preparation using Random Hexamer and SuperScript™ IV Reverse Transcriptase using 1-5ug of RNA. Quantitative PCR was performed using KAPA SYBR® FAST qPCR Master Mix (2X) Kit and LightCycler® 96 (Roche) Instrument. RNA isolation, cDNA preparation and quantitative PCR were performed using manufacturer’s protocol. Expressions of targeted genes were normalized to that of H2a/actin(Actb)/RpL32 transcripts. A list of primers used along with sequences has been tabulated in Table S4.
Lysate preparation
Tissue/Cells were lysed in ice-cold RIPA buffer (50 mM Tris pH 8.0, 150 mM NaCl, 0.1% SDS, 0.5% Sodium deoxycholate, 1% Triton X-100, 0.1% SDS) supplemented with 1 mM PMSF, 1.5XProtease inhibitor cocktail, 1.5XPhostop followed by sonication using Bioruptor® Pico (Diagenode) (5 cycles, 30s ON/30s OFF, 4ᵒC for cells and 10 cycles, 30s ON/30s OFF, 4ᵒC for tissues). Debris were pelleted by centrifuging samples at 13000 rpm for 15 minutes/4ᵒC. Protein concentrations were estimated using BCA (Bicinchoninic Acid) Protein estimation assay as per the manufacturer’s instruction. Samples were boiled in SDS gel loading buffer.
Immunoblotting
Equal amounts of protein (40-60μg) were run on SDS-PAGE and transferred to PVDF membrane. Membranes were stained with Ponceau S and blocked with 5% Milk for 90 minutes. Targeted proteins were probed by incubating the membrane with respective primary antibodies [ CTCF, pCREB, CREB, HA, Tubulin, Actin, H3] overnight at 4ᵒC with continuous rocking followed by incubation with horseradish peroxidase-conjugated secondary antibodies [ Anti-Rabbit IgG- Peroxidase, Anti-Mouse IgG- Peroxidase] as per the standard procedure. Bands were visualized using a chemi-luminance based detection kit and GE Amersham Imager 600 instrument. Intensity of bands was quantified using ImageJ. Actin/Tubulin/H3 levels were used as a loading control, as indicated in the corresponding figure.
Immunofluorescence
Primary hepatocytes
Primary hepatocytes plated on collagen-coated coverslips were treated with HG and NG DMEM media for 16 hrs. Cells were washed once with chilled PBS and then fixed in chilled 4% paraformaldehyde (PFA) for 30 mins at RT. The fixed cells were washed thrice with PBS and permeabilised by incubating with 0.05% Triton-X in PBST for 10 mins. Cells were then blocked using 5% BSA for 1 hour and incubated overnight with CTCF antibody at 4°C. Cells were washed thrice with PBST and incubated with Alexa Fluor 647-conjugated anti-rabbit antibody for 1 hr at room temperature. After three washes with PBST, cells were subsequently stained with DAPI (1:1000 of 1mg/ml), coverslips were mounted on a slide and imaged at 40X magnification using FluoView FV1200 laser scanning confocal microscope from Olympus Life Science. The images were processed and analysed in ImageJ software. Assays were repeated twice (N=2), and around 60 cells were analysed for quantitation per condition.
Liver sections
Flash frozen liver tissues were embedded in OCT and sectioned into 7 μm thick slices onto poly-L-lysine coated glass slides. Sections were fixed with 4% paraformaldehyde for 10 mins at RT, followed by two PBS washes. Sections were permeabilized with PBSTx (PBS, 0.2% TritonX-100) for 10 min at RT, followed by a 10 min PBST (PBS, 0.1%Tween-20) wash. Slices were then incubated for 1 hr at RT with blocking solution (PBS, 0.1%Tween-20, 5% BSA). Primary antibody incubation (rabbit anti-CTCF 1:600 in blocking solution) was performed overnight at 4°C. Sections were washed thrice with PBST and incubated with secondary antibody (1:1000 in blocking solution) for 1 hr at room temperature. PBST washes were repeated as mentioned above. Finally, sections were stained with DAPI (1 μg/ml in PBS) for 10 mins at RT, washed with PBS, and mounted in Vectashield H-1000 (Vector Labs). Slides were stored at 4 °C for at least an hour before imaging. Images were acquired on Olympus BX63 fluorescence microscope with a Retiga 6000 (QImaging) monochrome CCD camera using a 10X objective. Fluorescence intensity quantifications were performed and images were processed for presentation using ImageJ. Assays were performed using 6 animals per condition, and around 100 nuclei were analysed for quantitation in per condition and animal.
Oil red O staining
Primary hepatocytes treated with appropriate adenovirus and media were fixed in culture plates using PFA as stated previously. After rinsing with PBS once cells were incubated in freshly prepared Oil red O solution (40% in distilled water from a 0.5% stock solution in isopropanol) for 30-45 mins. The cells were washed thrice with distilled water and kept in water while imaging on an EVOS FLc microscope (Life Technologies, Inc.).
Lipidomics
All samples for the lipidomics analysis were prepared and analyzed by LC-MS/MS using established protocols reported by us previously.104,105,106
Quantification and statistical analysis
All the data were expressed as means ± standard error of means (SEM). Statistical analyses were performed in Microsoft Office Excel (2016) and Graphpad Prism 9. Student’s t-test and one-way/two-way ANOVA have been performed to determine statistical significance and a p ≤ 0.05 was considered statistically significant. ∗p≤ 0.05; ∗∗p≤ 0.01; ∗∗∗p≤ 0.001. Details of the biological/technical replicates and the statistical analyses used in each figure are mentioned in the figure legends.
Acknowledgments
This research has been supported by the following funding sources: TIFR/DAE (19P0116) and Department of Biotechnology (BT/PR29878/PFN/20/1431/2018) to U.K.-S., SwarnaJayanti Fellowship (grant number: SB/SJF/2021-22/01) to S.S.K., and the Department of Science and Technology Funds for Improvement of S&T Infrastructure Development (DST-FIST) grant to the Department of Biology, IISER Pune [grant number SR/FST/LSII-043/2016] for establishing the Biological Mass Spectrometry facility. We especially thank Dr. Kalidas Kohale, Dr. Shital Suryavanshi, Chetan Sable, TIFR Mumbai and IISER Pune animal house staff for their help with the animal experiments. We extend our acknowledgment to UK lab members for their critical inputs and discussions during the study.
Author contributions
Conceptualization, D.S., B.M., and U.K.-S.; methodology, D.S., B.M., A.C., N.M., S.S.K., and U.K.-S.; formal analysis, D.S., B.M., S.C., A.K., S.K., A.C., N.M., S.N., U.S.S., S.S.K., and U.K.-S.; investigation, D.S., B.M., S.C., A.K., S.K., A.C., N.M., S.N. and U.S.S.; writing, D.S., B.M., and U.K.-S.; funding acquisition, S.S.K., and U.K.-S.
Declaration of interests
The authors declare no competing interest.
Inclusion and diversity
We support inclusive, diverse, and equitable conduct of research.
Published: June 15, 2023
Footnotes
Supplemental information can be found online at https://doi.org/10.1016/j.isci.2023.107128.
Supplemental information
Data and code availability
-
•
CTCF ChIP-seq datasets generated in this study have been deposited to Gene Expression Omnibus (GEO) and are publicly available as of the date of publication. This paper has also re-analyzed existing, publicly available data. The accession numbers to these datasets are listed in the key resources table.
-
•
This paper has utilized the Galaxy platform (https://usegalaxy.org/) to analyse all the sequencing data and does not report any original code.
-
•
Any additional information required to analyse the data reported in this paper is available from the lead contact upon request.
References
- 1.Hübner M.R., Eckersley-Maslin M.A., Spector D.L. Chromatin organization and transcriptional regulation. Curr. Opin. Genet. Dev. 2013;23:89–95. doi: 10.1016/j.gde.2012.11.006. [DOI] [PMC free article] [PubMed] [Google Scholar]
- 2.Kim S., Shendure J. Mechanisms of Interplay between Transcription Factors and the 3D Genome. Mol. Cell. 2019;76:306–319. doi: 10.1016/j.molcel.2019.08.010. [DOI] [PubMed] [Google Scholar]
- 3.Son J.S., Chae C.S., Hwang J.S., Park Z.Y., Im S.H. Enhanced chromatin accessibility and recruitment of JUNB mediate the sustained IL-4 expression in NFAT1 deficient T helper 2 cells. PLoS One. 2011;6:e22042. doi: 10.1371/journal.pone.0022042. [DOI] [PMC free article] [PubMed] [Google Scholar]
- 4.Velasco S., Ibrahim M.M., Kakumanu A., Garipler G., Aydin B., Al-Sayegh M.A., Hirsekorn A., Abdul-Rahman F., Satija R., Ohler U., et al. A Multi-step Transcriptional and Chromatin State Cascade Underlies Motor Neuron Programming from Embryonic Stem Cells. Cell Stem Cell. 2017;20:205–217.e8. doi: 10.1016/j.stem.2016.11.006. [DOI] [PMC free article] [PubMed] [Google Scholar]
- 5.Zhu B., Gates L.A., Stashi E., Dasgupta S., Gonzales N., Dean A., Dacso C.C., York B., O'Malley B.W. Coactivator-Dependent Oscillation of Chromatin Accessibility Dictates Circadian Gene Amplitude via REV-ERB Loading. Mol. Cell. 2015;60:769–783. doi: 10.1016/j.molcel.2015.10.024. [DOI] [PMC free article] [PubMed] [Google Scholar]
- 6.Beagan J.A., Phillips-Cremins J.E. On the existence and functionality of topologically associating domains. Nat. Genet. 2020;52:8–16. doi: 10.1038/s41588-019-0561-1. [DOI] [PMC free article] [PubMed] [Google Scholar]
- 7.Kaushal A., Mohana G., Dorier J., Özdemir I., Omer A., Cousin P., Semenova A., Taschner M., Dergai O., Marzetta F., et al. CTCF loss has limited effects on global genome architecture in Drosophila despite critical regulatory functions. Nat. Commun. 2021;12:1011. doi: 10.1038/s41467-021-21366-2. [DOI] [PMC free article] [PubMed] [Google Scholar]
- 8.Martin D., Pantoja C., Fernández Miñán A., Valdes-Quezada C., Moltó E., Matesanz F., Bogdanović O., de la Calle-Mustienes E., Domínguez O., Taher L., et al. Genome-wide CTCF distribution in vertebrates defines equivalent sites that aid the identification of disease-associated genes. Nat. Struct. Mol. Biol. 2011;18:708–714. doi: 10.1038/nsmb.2059. [DOI] [PMC free article] [PubMed] [Google Scholar]
- 9.Schwalie P.C., Ward M.C., Cain C.E., Faure A.J., Gilad Y., Odom D.T., Flicek P. Co-binding by YY1 identifies the transcriptionally active, highly conserved set of CTCF-bound regions in primate genomes. Genome Biol. 2013;14:R148. doi: 10.1186/gb-2013-14-12-r148. [DOI] [PMC free article] [PubMed] [Google Scholar]
- 10.Tang Z., Luo O.J., Li X., Zheng M., Zhu J.J., Szalaj P., Trzaskoma P., Magalska A., Wlodarczyk J., Ruszczycki B., et al. CTCF-Mediated Human 3D Genome Architecture Reveals Chromatin Topology for Transcription. Cell. 2015;163:1611–1627. doi: 10.1016/j.cell.2015.11.024. [DOI] [PMC free article] [PubMed] [Google Scholar]
- 11.Kyrchanova O., Maksimenko O., Ibragimov A., Sokolov V., Postika N., Lukyanova M., Schedl P., Georgiev P. The insulator functions of the. Sci. Adv. 2020;6:eaaz3152. doi: 10.1126/sciadv.aaz3152. [DOI] [PMC free article] [PubMed] [Google Scholar]
- 12.Van Bortle K., Ramos E., Takenaka N., Yang J., Wahi J.E., Corces V.G. Drosophila CTCF tandemly aligns with other insulator proteins at the borders of H3K27me3 domains. Genome Res. 2012;22:2176–2187. doi: 10.1101/gr.136788.111. [DOI] [PMC free article] [PubMed] [Google Scholar]
- 13.Gambetta M.C., Furlong E.E.M. The Insulator Protein CTCF Is Required for Correct. Genetics. 2018;210:129–136. doi: 10.1534/genetics.118.301350. [DOI] [PMC free article] [PubMed] [Google Scholar]
- 14.Rodríguez-Carballo E., Lopez-Delisle L., Zhan Y., Fabre P.J., Beccari L., El-Idrissi I., Huynh T.H.N., Ozadam H., Dekker J., Duboule D. The HoxD cluster is a dynamic and resilient TAD boundary controlling the segregation of antagonistic regulatory landscapes. Gene Dev. 2017;31:2264–2281. doi: 10.1101/gad.307769.117. [DOI] [PMC free article] [PubMed] [Google Scholar]
- 15.Chen H., Tian Y., Shu W., Bo X., Wang S. Comprehensive identification and annotation of cell type-specific and ubiquitous CTCF-binding sites in the human genome. PLoS One. 2012;7:e41374. doi: 10.1371/journal.pone.0041374. [DOI] [PMC free article] [PubMed] [Google Scholar]
- 16.Cuddapah S., Jothi R., Schones D.E., Roh T.Y., Cui K., Zhao K. Global analysis of the insulator binding protein CTCF in chromatin barrier regions reveals demarcation of active and repressive domains. Genome Res. 2009;19:24–32. doi: 10.1101/gr.082800.108. [DOI] [PMC free article] [PubMed] [Google Scholar]
- 17.Liu Z., Scannell D.R., Eisen M.B., Tjian R. Control of embryonic stem cell lineage commitment by core promoter factor. Cell. 2011;146:720–731. doi: 10.1016/j.cell.2011.08.005. [DOI] [PMC free article] [PubMed] [Google Scholar]
- 18.Lutz M., Burke L.J., LeFevre P., Myers F.A., Thorne A.W., Crane-Robinson C., Bonifer C., Filippova G.N., Lobanenkov V., Renkawitz R. Thyroid hormone-regulated enhancer blocking: cooperation of CTCF and thyroid hormone receptor. EMBO J. 2003;22:1579–1587. doi: 10.1093/emboj/cdg147. [DOI] [PMC free article] [PubMed] [Google Scholar]
- 19.Peña-Hernández R., Marques M., Hilmi K., Zhao T., Saad A., Alaoui-Jamali M.A., del Rincon S.V., Ashworth T., Roy A.L., Emerson B.M., Witcher M. Genome-wide targeting of the epigenetic regulatory protein CTCF to gene promoters by the transcription factor TFII-I. Proc. Natl. Acad. Sci. USA. 2015;112:E677–E686. doi: 10.1073/pnas.1416674112. [DOI] [PMC free article] [PubMed] [Google Scholar]
- 20.Ross-Innes C.S., Brown G.D., Carroll J.S. A co-ordinated interaction between CTCF and ER in breast cancer cells. BMC Genom. 2011;12:593. doi: 10.1186/1471-2164-12-593. [DOI] [PMC free article] [PubMed] [Google Scholar]
- 21.Weth O., Paprotka C., Günther K., Schulte A., Baierl M., Leers J., Galjart N., Renkawitz R. CTCF induces histone variant incorporation, erases the H3K27me3 histone mark and opens chromatin. Nucleic Acids Res. 2014;42:11941–11951. doi: 10.1093/nar/gku937. [DOI] [PMC free article] [PubMed] [Google Scholar]
- 22.Delgado-Olguín P., Brand-Arzamendi K., Scott I.C., Jungblut B., Stainier D.Y., Bruneau B.G., Recillas-Targa F. CTCF promotes muscle differentiation by modulating the activity of myogenic regulatory factors. J. Biol. Chem. 2011;286:12483–12494. doi: 10.1074/jbc.M110.164574. [DOI] [PMC free article] [PubMed] [Google Scholar]
- 23.Hirayama T., Tarusawa E., Yoshimura Y., Galjart N., Yagi T. CTCF is required for neural development and stochastic expression of clustered Pcdh genes in neurons. Cell Rep. 2012;2:345–357. doi: 10.1016/j.celrep.2012.06.014. [DOI] [PubMed] [Google Scholar]
- 24.Stik G., Vidal E., Barrero M., Cuartero S., Vila-Casadesús M., Mendieta-Esteban J., Tian T.V., Choi J., Berenguer C., Abad A., et al. CTCF is dispensable for immune cell transdifferentiation but facilitates an acute inflammatory response. Nat. Genet. 2020;52:655–661. doi: 10.1038/s41588-020-0643-0. [DOI] [PubMed] [Google Scholar]
- 25.Su G., Wang W., Chen J., Liu M., Zheng J., Guo D., Bi J., Zhao Z., Shi J., Zhang L., Lu W. CTCF-binding element regulates ESC differentiation via orchestrating long-range chromatin interaction between enhancers and HoxA. J. Biol. Chem. 2021;296:100413. doi: 10.1016/j.jbc.2021.100413. [DOI] [PMC free article] [PubMed] [Google Scholar]
- 26.Torrano V., Chernukhin I., Docquier F., D'Arcy V., León J., Klenova E., Delgado M.D. CTCF regulates growth and erythroid differentiation of human myeloid leukemia cells. J. Biol. Chem. 2005;280:28152–28161. doi: 10.1074/jbc.M501481200. [DOI] [PubMed] [Google Scholar]
- 27.Moon H., Filippova G., Loukinov D., Pugacheva E., Chen Q., Smith S.T., Munhall A., Grewe B., Bartkuhn M., Arnold R., et al. CTCF is conserved from Drosophila to humans and confers enhancer blocking of the Fab-8 insulator. EMBO Rep. 2005;6:165–170. doi: 10.1038/sj.embor.7400334. [DOI] [PMC free article] [PubMed] [Google Scholar]
- 28.Burchfiel E.T., Vihervaara A., Guertin M.J., Gomez-Pastor R., Thiele D.J. Comparative interactomes of HSF1 in stress and disease reveal a role for CTCF in HSF1-mediated gene regulation. J. Biol. Chem. 2021;296:100097. doi: 10.1074/jbc.RA120.015452. [DOI] [PMC free article] [PubMed] [Google Scholar]
- 29.Hou Y., Song Q., Gao S., Zhang X., Wang Y., Liu J., Fu J., Cao M., Wang P. CTCF Mediates Replicative Senescence Through POLD1. Front. Cell Dev. Biol. 2021;9:618586. doi: 10.3389/fcell.2021.618586. [DOI] [PMC free article] [PubMed] [Google Scholar]
- 30.Lake R.J., Boetefuer E.L., Won K.J., Fan H.Y. The CSB chromatin remodeler and CTCF architectural protein cooperate in response to oxidative stress. Nucleic Acids Res. 2016;44:2125–2135. doi: 10.1093/nar/gkv1219. [DOI] [PMC free article] [PubMed] [Google Scholar]
- 31.Lehman B.J., Lopez-Diaz F.J., Santisakultarm T.P., Fang L., Shokhirev M.N., Diffenderfer K.E., Manor U., Emerson B.M. Dynamic regulation of CTCF stability and sub-nuclear localization in response to stress. PLoS Genet. 2021;17:e1009277. doi: 10.1371/journal.pgen.1009277. [DOI] [PMC free article] [PubMed] [Google Scholar]
- 32.Miyata K., Imai Y., Hori S., Nishio M., Loo T.M., Okada R., Yang L., Nakadai T., Maruyama R., Fujii R., et al. Pericentromeric noncoding RNA changes DNA binding of CTCF and inflammatory gene expression in senescence and cancer. Proc. Natl. Acad. Sci. USA. 2021;118 doi: 10.1073/pnas.2025647118. e2025647118. [DOI] [PMC free article] [PubMed] [Google Scholar]
- 33.Oh H.J., Aguilar R., Kesner B., Lee H.G., Kriz A.J., Chu H.P., Lee J.T. Jpx RNA regulates CTCF anchor site selection and formation of chromosome loops. Cell. 2021;184:6157–6173.e24. doi: 10.1016/j.cell.2021.11.012. [DOI] [PMC free article] [PubMed] [Google Scholar]
- 34.Bideyan L., Nagari R., Tontonoz P. Hepatic transcriptional responses to fasting and feeding. Gene Dev. 2021;35:635–657. doi: 10.1101/gad.348340.121. [DOI] [PMC free article] [PubMed] [Google Scholar]
- 35.De Fabiani E., Mitro N., Gilardi F., Caruso D., Galli G., Crestani M. Coordinated control of cholesterol catabolism to bile acids and of gluconeogenesis via a novel mechanism of transcription regulation linked to the fasted-to-fed cycle. J. Biol. Chem. 2003;278:39124–39132. doi: 10.1074/jbc.M305079200. [DOI] [PubMed] [Google Scholar]
- 36.Loft A., Schmidt S.F., Caratti G., Stifel U., Havelund J., Sekar R., Kwon Y., Sulaj A., Chow K.K., Alfaro A.J., et al. A macrophage-hepatocyte glucocorticoid receptor axis coordinates fasting ketogenesis. Cell Metabol. 2022;34:473–486.e9. doi: 10.1016/j.cmet.2022.01.004. [DOI] [PubMed] [Google Scholar]
- 37.Benegiamo G., Mure L.S., Erikson G., Le H.D., Moriggi E., Brown S.A., Panda S. The RNA-Binding Protein NONO Coordinates Hepatic Adaptation to Feeding. Cell Metabol. 2018;27:404–418.e7. doi: 10.1016/j.cmet.2017.12.010. [DOI] [PMC free article] [PubMed] [Google Scholar]
- 38.Chattopadhyay T., Maniyadath B., Bagul H.P., Chakraborty A., Shukla N., Budnar S., Rajendran A., Shukla A., Kamat S.S., Kolthur-Seetharam U. Spatiotemporal gating of SIRT1 functions by O-GlcNAcylation is essential for liver metabolic switching and prevents hyperglycemia. Proc. Natl. Acad. Sci. USA. 2020;117:6890–6900. doi: 10.1073/pnas.1909943117. [DOI] [PMC free article] [PubMed] [Google Scholar]
- 39.Maniyadath B., Chattopadhyay T., Verma S., Kumari S., Kulkarni P., Banerjee K., Lazarus A., Kokane S.S., Shetty T., Anamika K., Kolthur-Seetharam U. Loss of Hepatic Oscillatory Fed microRNAs Abrogates Refed Transition and Causes Liver Dysfunctions. Cell Rep. 2019;26:2212–2226.e7. doi: 10.1016/j.celrep.2019.01.087. [DOI] [PubMed] [Google Scholar]
- 40.Matsumoto M., Pocai A., Rossetti L., Depinho R.A., Accili D. Impaired regulation of hepatic glucose production in mice lacking the forkhead transcription factor Foxo1 in liver. Cell Metabol. 2007;6:208–216. doi: 10.1016/j.cmet.2007.08.006. [DOI] [PubMed] [Google Scholar]
- 41.Wang Y., Viscarra J., Kim S.J., Sul H.S. Transcriptional regulation of hepatic lipogenesis. Nat. Rev. Mol. Cell Biol. 2015;16:678–689. doi: 10.1038/nrm4074. [DOI] [PMC free article] [PubMed] [Google Scholar]
- 42.Houtkooper R.H., Pirinen E., Auwerx J. Sirtuins as regulators of metabolism and healthspan. Nat. Rev. Mol. Cell Biol. 2012;13:225–238. doi: 10.1038/nrm3293. [DOI] [PMC free article] [PubMed] [Google Scholar]
- 43.Yao W., Wang T., Huang F. p300/CBP as a Key Nutritional Sensor for Hepatic Energy Homeostasis and Liver Fibrosis. Biomed Res. Int. 2018;2018:8168791. doi: 10.1155/2018/8168791. [DOI] [PMC free article] [PubMed] [Google Scholar]
- 44.Molaei M., Vandehoef C., Karpac J. NF-κB Shapes Metabolic Adaptation by Attenuating Foxo-Mediated Lipolysis in Drosophila. Dev. Cell. 2019;49:802–810.e6. doi: 10.1016/j.devcel.2019.04.009. [DOI] [PMC free article] [PubMed] [Google Scholar]
- 45.Hood S.E., Kofler X.V., Chen Q., Scott J., Ortega J., Lehmann M. Nuclear translocation ability of Lipin differentially affects gene expression and survival in fed and fasting Drosophila. J. Lipid Res. 2020;61:1720–1732. doi: 10.1194/jlr.RA120001051. [DOI] [PMC free article] [PubMed] [Google Scholar]
- 46.Choi Y., Song M.J., Jung W.J., Jeong H., Park S., Yang B., Lee E.C., Joo J.S., Choi D., Koo S.H., et al. Liver-Specific Deletion of Mouse CTCF Leads to Hepatic Steatosis via Augmented PPARγ Signaling. Cell. Mol. Gastroenterol. Hepatol. 2021;12:1761–1787. doi: 10.1016/j.jcmgh.2021.07.016. [DOI] [PMC free article] [PubMed] [Google Scholar]
- 47.Azazi D., Mudge J.M., Odom D.T., Flicek P. Functional signatures of evolutionarily young CTCF binding sites. BMC Biol. 2020;18:132. doi: 10.1186/s12915-020-00863-8. [DOI] [PMC free article] [PubMed] [Google Scholar]
- 48.Ritter M.J., Amano I., Hollenberg A.N. Thyroid Hormone Signaling and the Liver. Hepatology. 2020;72:742–752. doi: 10.1002/hep.31296. [DOI] [PubMed] [Google Scholar]
- 49.Villena J.A., Kralli A. ERRalpha: a metabolic function for the oldest orphan. Trends Endocrinol. Metabol. 2008;19:269–276. doi: 10.1016/j.tem.2008.07.005. [DOI] [PMC free article] [PubMed] [Google Scholar]
- 50.Horton J.D., Goldstein J.L., Brown M.S. SREBPs: activators of the complete program of cholesterol and fatty acid synthesis in the liver. J. Clin. Invest. 2002;109:1125–1131. doi: 10.1172/jci15593. [DOI] [PMC free article] [PubMed] [Google Scholar]
- 51.Goldstein I., Hager G.L. The Three Ds of Transcription Activation by Glucagon: Direct, Delayed, and Dynamic. Endocrinology. 2018;159:206–216. doi: 10.1210/en.2017-00521. [DOI] [PMC free article] [PubMed] [Google Scholar]
- 52.Li X. SIRT1 and energy metabolism. Acta Biochim. Biophys. Sin. 2013;45:51–60. doi: 10.1093/abbs/gms108. [DOI] [PMC free article] [PubMed] [Google Scholar]
- 53.Lin J., Handschin C., Spiegelman B.M. Metabolic control through the PGC-1 family of transcription coactivators. Cell Metabol. 2005;1:361–370. doi: 10.1016/j.cmet.2005.05.004. [DOI] [PubMed] [Google Scholar]
- 54.Goldstein I., Baek S., Presman D.M., Paakinaho V., Swinstead E.E., Hager G.L. Transcription factor assisted loading and enhancer dynamics dictate the hepatic fasting response. Genome Res. 2017;27:427–439. doi: 10.1101/gr.212175.116. [DOI] [PMC free article] [PubMed] [Google Scholar]
- 55.Kim D.K., Gang G.T., Ryu D., Koh M., Kim Y.N., Kim S.S., Park J., Kim Y.H., Sim T., Lee I.K., et al. Inverse agonist of nuclear receptor ERRγ mediates antidiabetic effect through inhibition of hepatic gluconeogenesis. Diabetes. 2013;62:3093–3102. doi: 10.2337/db12-0946. [DOI] [PMC free article] [PubMed] [Google Scholar]
- 56.Pawlak M., Lefebvre P., Staels B. Molecular mechanism of PPARalpha action and its impact on lipid metabolism, inflammation and fibrosis in non-alcoholic fatty liver disease. J. Hepatol. 2015;62:720–733. doi: 10.1016/j.jhep.2014.10.039. [DOI] [PubMed] [Google Scholar]
- 57.Sommars M.A., Ramachandran K., Senagolage M.D., Futtner C.R., Germain D.M., Allred A.L., Omura Y., Bederman I.R., Barish G.D. Dynamic repression by BCL6 controls the genome-wide liver response to fasting and steatosis. Elife. 2019;8:e43922. doi: 10.7554/eLife.43922. [DOI] [PMC free article] [PubMed] [Google Scholar]
- 58.Ramadoss P., Abraham B.J., Tsai L., Zhou Y., Costa-e-Sousa R.H., Ye F., Bilban M., Zhao K., Hollenberg A.N. Novel mechanism of positive versus negative regulation by thyroid hormone receptor β1 (TRβ1) identified by genome-wide profiling of binding sites in mouse liver. J. Biol. Chem. 2014;289:1313–1328. doi: 10.1074/jbc.M113.521450. [DOI] [PMC free article] [PubMed] [Google Scholar]
- 59.Seo Y.-K., Jeon T.-I., Chong H.K., Biesinger J., Xie X., Osborne T.F. Genome-wide localization of SREBP-2 in hepatic chromatin predicts a role in autophagy. Cell Metabol. 2011;13:367–375. doi: 10.1016/j.cmet.2011.03.005. [DOI] [PMC free article] [PubMed] [Google Scholar]
- 60.Luo H., Yu Q., Liu Y., Tang M., Liang M., Zhang D., Xiao T.S., Wu L., Tan M., Ruan Y., et al. LATS kinase-mediated CTCF phosphorylation and selective loss of genomic binding. Sci. Adv. 2020;6:eaaw4651. doi: 10.1126/sciadv.aaw4651. [DOI] [PMC free article] [PubMed] [Google Scholar]
- 61.Chisolm D.A., Savic D., Moore A.J., Ballesteros-Tato A., León B., Crossman D.K., Murre C., Myers R.M., Weinmann A.S. CCCTC-Binding Factor Translates Interleukin 2- and α-Ketoglutarate-Sensitive Metabolic Changes in T Cells into Context-Dependent Gene Programs. Immunity. 2017;47:251–267.e7. doi: 10.1016/j.immuni.2017.07.015. [DOI] [PMC free article] [PubMed] [Google Scholar]
- 62.Plasschaert R.N., Vigneau S., Tempera I., Gupta R., Maksimoska J., Everett L., Davuluri R., Mamorstein R., Lieberman P.M., Schultz D., et al. CTCF binding site sequence differences are associated with unique regulatory and functional trends during embryonic stem cell differentiation. Nucleic Acids Res. 2014;42:774–789. doi: 10.1093/nar/gkt910. [DOI] [PMC free article] [PubMed] [Google Scholar]
- 63.Sun S., Del Rosario B.C., Szanto A., Ogawa Y., Jeon Y., Lee J.T. Jpx RNA activates Xist by evicting CTCF. Cell. 2013;153:1537–1551. doi: 10.1016/j.cell.2013.05.028. [DOI] [PMC free article] [PubMed] [Google Scholar]
- 64.Banerjee K.K., Ayyub C., Sengupta S., Kolthur-Seetharam U. dSir2 deficiency in the fatbody, but not muscles, affects systemic insulin signaling, fat mobilization and starvation survival in flies. Aging (Albany NY) 2012;4:206–223. doi: 10.18632/aging.100435. [DOI] [PMC free article] [PubMed] [Google Scholar]
- 65.Banerjee K.K., Ayyub C., Sengupta S., Kolthur-Seetharam U. Fat body dSir2 regulates muscle mitochondrial physiology and energy homeostasis nonautonomously and mimics the autonomous functions of dSir2 in muscles. Mol. Cell Biol. 2013;33:252–264. doi: 10.1128/MCB.00976-12. [DOI] [PMC free article] [PubMed] [Google Scholar]
- 66.Shukla N., Kolthur-Seetharam U. Drosophila Sirtuin 6 mediates developmental diet-dependent programming of adult physiology and survival. Aging Cell. 2022;21:e13576. doi: 10.1111/acel.13576. [DOI] [PMC free article] [PubMed] [Google Scholar]
- 67.Fresán U., Cuartero S., O'Connor M.B., Espinàs M.L. The insulator protein CTCF regulates Drosophila steroidogenesis. Biol. Open. 2015;4:852–857. doi: 10.1242/bio.012344. [DOI] [PMC free article] [PubMed] [Google Scholar]
- 68.Smith R.L., Soeters M.R., Wüst R.C.I., Houtkooper R.H. Metabolic Flexibility as an Adaptation to Energy Resources and Requirements in Health and Disease. Endocr. Rev. 2018;39:489–517. doi: 10.1210/er.2017-00211. [DOI] [PMC free article] [PubMed] [Google Scholar]
- 69.Katada S., Imhof A., Sassone-Corsi P. Connecting threads: epigenetics and metabolism. Cell. 2012;148:24–28. doi: 10.1016/j.cell.2012.01.001. [DOI] [PubMed] [Google Scholar]
- 70.Kirchner H., Osler M.E., Krook A., Zierath J.R. Epigenetic flexibility in metabolic regulation: disease cause and prevention? Trends Cell Biol. 2013;23:203–209. doi: 10.1016/j.tcb.2012.11.008. [DOI] [PubMed] [Google Scholar]
- 71.Maniyadath B., Sandra U.S., Kolthur-Seetharam U. Metabolic choreography of gene expression: nutrient transactions with the epigenome. J. Biosci. 2020;45:7. [PubMed] [Google Scholar]
- 72.Flavahan W.A., Drier Y., Johnstone S.E., Hemming M.L., Tarjan D.R., Hegazi E., Shareef S.J., Javed N.M., Raut C.P., Eschle B.K., et al. Altered chromosomal topology drives oncogenic programs in SDH-deficient GISTs. Nature. 2019;575:229–233. doi: 10.1038/s41586-019-1668-3. [DOI] [PMC free article] [PubMed] [Google Scholar]
- 73.Andreu M.J., Alvarez-Franco A., Portela M., Gimenez-Llorente D., Cuadrado A., Badia-Careaga C., Tiana M., Losada A., Manzanares M. Establishment of 3D chromatin structure after fertilization and the metabolic switch at the morula-to-blastocyst transition require CTCF. Cell Rep. 2022;41:111501. doi: 10.1016/j.celrep.2022.111501. [DOI] [PubMed] [Google Scholar]
- 74.Song Y., Liang Z., Zhang J., Hu G., Wang J., Li Y., Guo R., Dong X., Babarinde I.A., Ping W., et al. CTCF functions as an insulator for somatic genes and a chromatin remodeler for pluripotency genes during reprogramming. Cell Rep. 2022;39:110626. doi: 10.1016/j.celrep.2022.110626. [DOI] [PubMed] [Google Scholar]
- 75.Park Y.J., Lee S., Lim S., Nahmgoong H., Ji Y., Huh J.Y., Alfadda A.A., Kim S., Kim J.B. DNMT1 maintains metabolic fitness of adipocytes through acting as an epigenetic safeguard of mitochondrial dynamics. Proc. Natl. Acad. Sci. USA. 2021;118 doi: 10.1073/pnas.2021073118. e2021073118. [DOI] [PMC free article] [PubMed] [Google Scholar]
- 76.Kim Y.H., Marhon S.A., Zhang Y., Steger D.J., Won K.J., Lazar M.A. Rev-erbα dynamically modulates chromatin looping to control circadian gene transcription. Science. 2018;359:1274–1277. doi: 10.1126/science.aao6891. [DOI] [PMC free article] [PubMed] [Google Scholar]
- 77.Mermet J., Yeung J., Naef F. Oscillating and stable genome topologies underlie hepatic physiological rhythms during the circadian cycle. PLoS Genet. 2021;17:e1009350. doi: 10.1371/journal.pgen.1009350. [DOI] [PMC free article] [PubMed] [Google Scholar]
- 78.Wang R.R., Qiu X., Pan R., Fu H., Zhang Z., Wang Q., Chen H., Wu Q.Q., Pan X., Zhou Y., et al. Dietary intervention preserves β cell function in mice through CTCF-mediated transcriptional reprogramming. J. Exp. Med. 2022;219:e20211779. doi: 10.1084/jem.20211779. [DOI] [PMC free article] [PubMed] [Google Scholar]
- 79.Gomez-Velazquez M., Badia-Careaga C., Lechuga-Vieco A.V., Nieto-Arellano R., Tena J.J., Rollan I., Alvarez A., Torroja C., Caceres E.F., Roy A.R., et al. CTCF counter-regulates cardiomyocyte development and maturation programs in the embryonic heart. PLoS Genet. 2017;13:e1006985. doi: 10.1371/journal.pgen.1006985. [DOI] [PMC free article] [PubMed] [Google Scholar]
- 80.Boergesen M., Mandrup S. 2012. Genome-wide Profiling of LXR, RXR and PPARalpha in Mouse Liver Reveals Extensive Sharing of Binding Sites. [DOI] [PMC free article] [PubMed] [Google Scholar]
- 81.Qu M., Duffy T., Hirota T., Kay S.A. Nuclear receptor HNF4A transrepresses CLOCK: BMAL1 and modulates tissue-specific circadian networks. Proc. Natl. Acad. Sci. USA. 2018;115:E12305–E12312. doi: 10.1073/pnas.1816411115. [DOI] [PMC free article] [PubMed] [Google Scholar]
- 82.Chaveroux C., Eichner L.J., Dufour C.R., Shatnawi A., Khoutorsky A., Bourque G., Sonenberg N., Giguère V. Molecular and genetic crosstalks between mTOR and ERRα are key determinants of rapamycin-induced nonalcoholic fatty liver. Cell Metabol. 2013;17:586–598. doi: 10.1016/j.cmet.2013.03.003. [DOI] [PubMed] [Google Scholar]
- 83.Kalvisa A., Siersbæk M.S., Præstholm S.M., Christensen L.J.L., Nielsen R., Stohr O., Vettorazzi S., Tuckermann J., White M., Mandrup S., Grøntved L. Insulin signaling and reduced glucocorticoid receptor activity attenuate postprandial gene expression in liver. PLoS Biol. 2018;16:e2006249. doi: 10.1371/journal.pbio.2006249. [DOI] [PMC free article] [PubMed] [Google Scholar]
- 84.Gilardi F., Migliavacca E., Naldi A., Baruchet M., Canella D., Le Martelot G., Guex N., Desvergne B., CycliX Consortium Genome-wide analysis of SREBP1 activity around the clock reveals its combined dependency on nutrient and circadian signals. PLoS Genet. 2014;10:e1004155. doi: 10.1371/journal.pgen.1004155. [DOI] [PMC free article] [PubMed] [Google Scholar]
- 85.Cho H., Zhao X., Hatori M., Yu R.T., Barish G.D., Lam M.T., Chong L.-W., DiTacchio L., Atkins A.R., Glass C.K., et al. Regulation of circadian behaviour and metabolism by REV-ERB-α and REV-ERB-β. Nature. 2012;485:123–127. doi: 10.1038/nature11048. [DOI] [PMC free article] [PubMed] [Google Scholar]
- 86.Koike N., Yoo S.-H., Huang H.-C., Kumar V., Lee C., Kim T.-K., Takahashi J.S. Transcriptional architecture and chromatin landscape of the core circadian clock in mammals. Science. 2012;338:349–354. doi: 10.1126/science.1226339. [DOI] [PMC free article] [PubMed] [Google Scholar]
- 87.Schwarzer W., Abdennur N., Goloborodko A., Pekowska A., Fudenberg G., Loe-Mie Y., Fonseca N.A., Huber W., Haering C.H., Mirny L., Spitz F. Two independent modes of chromatin organization revealed by cohesin removal. Nature. 2017;551:51–56. doi: 10.1038/nature24281. [DOI] [PMC free article] [PubMed] [Google Scholar]
- 88.Guan D., Xiong Y., Trinh T.M., Xiao Y., Hu W., Jiang C., Dierickx P., Jang C., Rabinowitz J.D., Lazar M.A. The hepatocyte clock and feeding control chronophysiology of multiple liver cell types. Science. 2020;369:1388–1394. doi: 10.1126/science.aba8984. [DOI] [PMC free article] [PubMed] [Google Scholar]
- 89.He T.C., Zhou S., da Costa L.T., Yu J., Kinzler K.W., Vogelstein B. A simplified system for generating recombinant adenoviruses. Proc. Natl. Acad. Sci. USA. 1998;95:2509–2514. doi: 10.1073/pnas.95.5.2509. [DOI] [PMC free article] [PubMed] [Google Scholar]
- 90.Afgan E., Baker D., van den Beek M., Blankenberg D., Bouvier D., Čech M., Chilton J., Clements D., Coraor N., Eberhard C., et al. The Galaxy platform for accessible, reproducible and collaborative biomedical analyses: 2016 update. Nucleic Acids Res. 2016;44:W3–W10. doi: 10.1093/nar/gkw343. [DOI] [PMC free article] [PubMed] [Google Scholar]
- 91.Huang D.W., Sherman B.T., Lempicki R.A. Bioinformatics enrichment tools: paths toward the comprehensive functional analysis of large gene lists. Nucleic Acids Res. 2009;37:1–13. doi: 10.1093/nar/gkn923. [DOI] [PMC free article] [PubMed] [Google Scholar]
- 92.Huang D.W., Sherman B.T., Lempicki R.A. Systematic and integrative analysis of large gene lists using DAVID bioinformatics resources. Nat. Protoc. 2009;4:44–57. doi: 10.1038/nprot.2008.211. [DOI] [PubMed] [Google Scholar]
- 93.Heinz S., Benner C., Spann N., Bertolino E., Lin Y.C., Laslo P., Cheng J.X., Murre C., Singh H., Glass C.K. Simple combinations of lineage-determining transcription factors prime cis-regulatory elements required for macrophage and B cell identities. Mol. Cell. 2010;38:576–589. doi: 10.1016/j.molcel.2010.05.004. [DOI] [PMC free article] [PubMed] [Google Scholar]
- 94.Cunningham F., Allen J.E., Allen J., Alvarez-Jarreta J., Amode M.R., Armean I.M., Austine-Orimoloye O., Azov A.G., Barnes I., Bennett R., et al. Ensembl 2022. Nucleic Acids Res. 2022;50 doi: 10.1093/nar/gkab1049. D988–d995. [DOI] [PMC free article] [PubMed] [Google Scholar]
- 95.Agostinelli F., Ceglia N., Shahbaba B., Sassone-Corsi P., Baldi P. What time is it? Deep learning approaches for circadian rhythms. Bioinformatics. 2016;32:3051–i17. doi: 10.1093/bioinformatics/btw504. [DOI] [PMC free article] [PubMed] [Google Scholar]
- 96.Ceglia N., Liu Y., Chen S., Agostinelli F., Eckel-Mahan K., Sassone-Corsi P., Baldi P. CircadiOmics: circadian omic web portal. Nucleic Acids Res. 2018;46:W157–W162. doi: 10.1093/nar/gky441. [DOI] [PMC free article] [PubMed] [Google Scholar]
- 97.Patel V.R., Eckel-Mahan K., Sassone-Corsi P., Baldi P. CircadiOmics: integrating circadian genomics, transcriptomics, proteomics and metabolomics. Nat. Methods. 2012;9:772–773. doi: 10.1038/nmeth.2111. [DOI] [PubMed] [Google Scholar]
- 98.Quinlan A.R., Hall I.M. BEDTools: a flexible suite of utilities for comparing genomic features. Bioinformatics. 2010;26:841–842. doi: 10.1093/bioinformatics/btq033. [DOI] [PMC free article] [PubMed] [Google Scholar]
- 99.Luo J., Deng Z.L., Luo X., Tang N., Song W.X., Chen J., Sharff K.A., Luu H.H., Haydon R.C., Kinzler K.W., et al. A protocol for rapid generation of recombinant adenoviruses using the AdEasy system. Nat. Protoc. 2007;2:1236–1247. doi: 10.1038/nprot.2007.135. [DOI] [PubMed] [Google Scholar]
- 100.Andrews S. Babraham Bioinformatics, Babraham Institute; 2010. FastQC: A Quality Control Tool for High Throughput Sequence Data. [Google Scholar]
- 101.Li H., Durbin R. Fast and accurate short read alignment with Burrows–Wheeler transform. bioinformatics. 2009;25:1754–1760. doi: 10.1093/bioinformatics/btp324. [DOI] [PMC free article] [PubMed] [Google Scholar]
- 102.Li H., Handsaker B., Wysoker A., Fennell T., Ruan J., Homer N., Marth G., Abecasis G., Durbin R., 1000 Genome Project Data Processing Subgroup The sequence alignment/map format and SAMtools. Bioinformatics. 2009;25:2078–2079. doi: 10.1093/bioinformatics/btp352. [DOI] [PMC free article] [PubMed] [Google Scholar]
- 103.Zhang Y., Liu T., Meyer C.A., Eeckhoute J., Johnson D.S., Bernstein B.E., Nusbaum C., Myers R.M., Brown M., Li W., Liu X.S. Model-based analysis of chip-seq (macs) Genome Biol. 2008;9:R137. doi: 10.1186/gb-2008-9-9-r137. [DOI] [PMC free article] [PubMed] [Google Scholar]
- 104.Kelkar D.S., Ravikumar G., Mehendale N., Singh S., Joshi A., Sharma A.K., Mhetre A., Rajendran A., Chakrapani H., Kamat S.S. A chemical–genetic screen identifies ABHD12 as an oxidized-phosphatidylserine lipase. Nat. Chem. Biol. 2019;15:169–178. doi: 10.1038/s41589-018-0195-0. [DOI] [PMC free article] [PubMed] [Google Scholar]
- 105.Pathak D., Mehendale N., Singh S., Mallik R., Kamat S.S. Lipidomics suggests a new role for ceramide synthase in phagocytosis. ACS Chem. Biol. 2018;13:2280–2287. doi: 10.1021/acschembio.8b00438. [DOI] [PMC free article] [PubMed] [Google Scholar]
- 106.Rajendran A., Soory A., Khandelwal N., Ratnaparkhi G., Kamat S.S. A multi-omics analysis reveals that the lysine deacetylase ABHD14B influences glucose metabolism in mammals. J. Biol. Chem. 2022;298:102128. doi: 10.1016/j.jbc.2022.102128. [DOI] [PMC free article] [PubMed] [Google Scholar]
Associated Data
This section collects any data citations, data availability statements, or supplementary materials included in this article.
Supplementary Materials
Data Availability Statement
-
•
CTCF ChIP-seq datasets generated in this study have been deposited to Gene Expression Omnibus (GEO) and are publicly available as of the date of publication. This paper has also re-analyzed existing, publicly available data. The accession numbers to these datasets are listed in the key resources table.
-
•
This paper has utilized the Galaxy platform (https://usegalaxy.org/) to analyse all the sequencing data and does not report any original code.
-
•
Any additional information required to analyse the data reported in this paper is available from the lead contact upon request.