

Abstract
Somatosensory afferent pathways have been a target for neural prostheses that seek to restore sensory feedback from amputated limbs and to recruit muscles paralyzed by neurological injury. These pathways supply inputs into spinal reflex circuits that are necessary for coordinating muscle activity in the lower limb. The dorsal root ganglia (DRG) is a potential site for accessing sensory neurons and DRG microstimulation selectively recruits major nerve branches of the cat hindlimb. Previous studies of DRG microstimulation have been performed in anesthetized animals, but the effects on muscle recruitment and behavior in awake animals have not been examined. In this study, 32-channel penetrating microelectrode arrays were implanted chronically in the left L6 and L7 DRG of four cats. During each week of testing, one DRG electrode was selected to deliver microstimulation pulse-trains during quiet standing. Electromyographic (EMG) signals were recorded from intramuscular electrodes in 10 hindlimb muscles, and ground-reaction forces (GRF) were measured under the foot of the implanted limb. Microstimulation in the DRG evoked a mix of excitatory and inhibitory responses across muscles. Response rates were highest when microstimulation was applied on the L7 array, producing more excitatory than inhibitory responses; hamstrings excitation occurred most frequently. Response rates for the L6 array were lower, and the composition of responses was more evenly balanced between excitation and inhibition. On approximately one third of testing weeks, microstimulation induced a transient unloading of the hindlimb as indicated by a decrease in GRF during stimulation. Reciprocal inhibition at the knee was a prevalent response pattern across testing days and also contributed to the unloading force on this subset of testing weeks. Results show that single-channel microstimulation in the lumbar DRG evokes stereotyped patterns of muscle recruitment in awake animals, demonstrating that even limited sensory input can elicit hindlimb behavior. These findings imply that DRG microstimulation may have utility in neural prosthetic applications aimed at restoring somatosensory feedback or promoting motor function after neurological injury.
Introduction
Electrical stimulation of somatosensory pathways through peripheral nerves and the spinal cord has been shown to produce tactile perception, enabling the development of neural prostheses for amputees (Dhillon et al. 2004; Tan et al. 2014). Somatosensory stimulation has also been used to recruit spinal reflexes and activate muscles to improve motor control in humans with spinal cord injury (Carhart et al. 2004; Van Den Brand et al. 2012). Decades of animal and human work has established that proprioceptive and cutaneous inputs from the lower limb contribute to postural control and locomotion (Pearson 1995; Bouyer and Rossignol 1998), making it unsurprising that the loss of somatosensory feedback increases the risk of falling after lower-limb amputation (Van Velzen et al. 2006). The effects of somatosensory stimulation on motor function, therefore, are relevant to the development of neural prostheses for the lower limb.
Somatosensory signaling through ascending tracts into supraspinal circuits mediates volitional control of gait and posture, but somatosensory integration with descending motor commands in local spinal circuits is essential for sculpting patterns of muscle activation in the lower limb (Zehr and Stein 1999). In absence of descending input in decerebrate preparations, single-unit recordings from hindlimb spindle afferents demonstrate the role of these circuits in generating broadly-tuned patterns of muscle activation in response to ground support perturbations (Honeycutt and Nichols 2010). In addition to proprioceptive input, disruption of cutaneous receptors in the hind paw has been shown to alter muscle activity and movement kinematics, resulting in impaired postural control (Bolton and Misiaszek 2009). These findings provide some basis for understanding the abnormal patterns of knee and ankle muscle activation reported in human lower-limb amputees (Huang and Ferris 2012; Seyedali et al. 2012). Furthermore, computational and experimental studies of spinal cord stimulation after spinal cord injury have demonstrated the importance of understanding how afferent stimulation interacts with spinal circuits to facilitate or block locomotor output (Formento et al. 2018).
Multi-contact nerve cuff electrodes placed on the sciatic nerve and its branches can recruit sensory fibers to produce sensations that are perceived as originating in the missing limb (Clippinger et al. 1982; Charkhkar et al. 2018), although effects on muscle activity have not been reported. Epidural electrical stimulation of the spinal cord facilitates stepping in spinalized rats by recruiting afferent projections to spinal locomotor circuits (Lavrov et al. 2008). Epidural spinal cord stimulation has been shown to facilitate muscle recruitment during locomotion (Huang et al. 2006) and promote recovery of locomotor function (Wagner et al. 2018) in humans with paraplegia after chronic spinal cord injury.
In the studies referenced above, electrodes were placed on the peripheral nerves and spinal cord. We are exploring the dorsal root ganglion (DRG) as a potential site for stimulating primary afferent neurons for neural prosthetic applications. Afferents within the DRG are structurally segregated from efferents, allowing selective, controlled access to these fibers. Previously, we demonstrated that microstimulation in the lumbar DRG of anesthetized cats recruits medium- and large-diameter afferents in acute (Gaunt et al. 2009) and chronic implants (Fisher et al. 2014). More recently, we showed that microstimulation in L6–L7 DRG selectively recruits major nerve branches, implying the potential to recruit sensory fibers from localized areas of the hindlimb (Ayers et al. 2016). These inputs may also integrate with descending motor commands in local circuits of the spinal cord that converge on spinal motor neurons to modulate muscle activity. The ability to effectively supply lost somatosensory inputs to both cortical and spinal circuits, therefore, has the potential to enhance both sensory and motor function.
The objective of the current study was to measure the effects of DRG microstimulation on evoking changes in muscle activity and to characterize the response patterns that emerge. Since this is the first study to test the effects of DRG microstimulation on hindlimb motor output, we delivered brief trains of microstimulation pulses to the 6th and 7th lumbar DRG of animals during static standing as opposed to dynamic behaviors that might involve more complex response patterns. We hypothesized that microstimulation would produce distinct patterns of excitation and inhibition in hindlimb muscles, sufficient to drive hindlimb behavior, and that the patterns of evoked responses would vary with the site of stimulation (e.g. L6 vs L7).
Methods
Experimental overview
The objective of this study was to characterize the motor response to brief trains of microstimulation pulses in the DRG, which was intended to simulate transient signaling from somatosensory receptors in the hindlimb. Several weeks of testing were completed in each animal to explore the effects of recruiting different afferent bundles within the DRG. This was accomplished by stimulating one of 64 channels from two microelectrode arrays implanted chronically in the L6 and L7 DRG. We carried out two types of experiments each week for this purpose. On the first day, anesthetized experiments were performed to identify the microelectrode channel with the lowest threshold for eliciting antidromic volleys with the highest conduction velocity in a sciatic nerve cuff. On the remaining days, behaving experiments were conducted to measure motor responses resulting from microstimulation to the channel identified in anesthetized experiments. Thus, each week of testing targeted a different location within the L6 or L7 DRG. In some animals, a given channel was re-tested on subsequent weeks because it fulfilled recruitment criteria and/or there were a limited number of viable channels remaining. Previous work has shown that afferent recruitment via DRG microstimulation is stable over the duration of a few weeks, with changes in recruitment properties occurring over longer time scales (Fisher et al. 2014). In this study, re-selection of electrodes occurred several testing weeks (≥4) apart and produced different conduction velocities and/or recruitment thresholds. We therefore treated the few instances of microelectrode re-selection as independent samples, targeting different afferent fibers.
Experiments were performed on four male cats (F, G, H, and I). A fifth cat underwent surgical procedures, but there were a limited number of microelectrodes (n=7) that produced electroneurographic (ENG) responses in the sciatic nerve, likely due to challenges with electrode array insertion during implantation procedures. These data were discarded from analyses. A single week of testing from one cat (F03) was also removed from analyses after inspection of electromyographic (EMG) recordings revealed motor responses that were likely a result of stimulation directly to the ventral root, rather than to sensory afferents in the DRG. Briefly, each pulse in the stimulation train evoked a clear EMG response, occurring at latencies consistent with direct activation of efferent pathways. This type of response was observed in all muscles. Most implanted arrays consisted of electrodes with multiple lengths (Fig 1A), and the electrode used on this particular testing week had a longer length, penetrating deeper and supporting insertion into the ventral root. All experimental procedures were completed in accordance with approvals from the University of Pittsburgh Institutional Animal Care and Use Committee.
Figure 1.
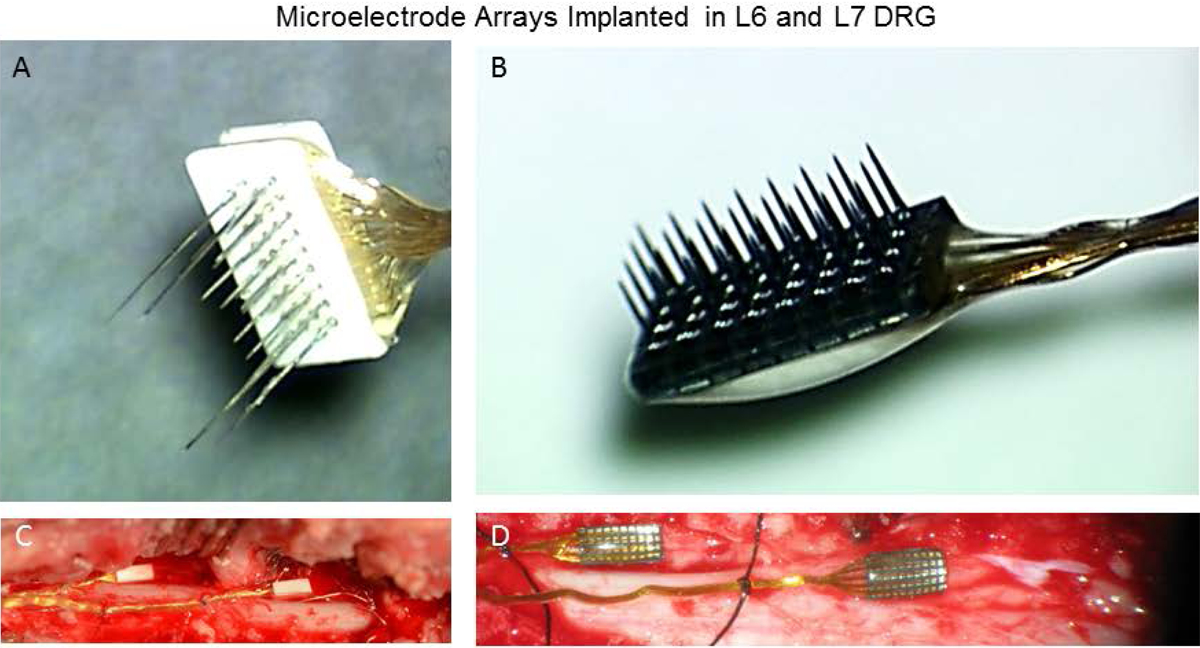
(A) Floating and (B) Utah microelectrode arrays implanted chronically in the L6 and L7 DRG (C&D). Each array consists of a 4×8 grid of microelectrodes. A single microelectrode channel was selected for stimulating focal areas of the DRG on each week of testing.
Surgical procedures
Anesthesia was induced with a ketamine and acepromezine combination, and isoflurane (1–2%) was used to maintain the animal in a surgical anesthetic plane during the implantation procedure. Heart rate, oxygen saturation, temperature, respiration rate, and expired CO2 were monitored throughout the procedure. A laminectomy was performed to expose the DRG at the left 6th and 7th lumbar segments. Floating Microelectrode Arrays (FMAs, MicroProbes for Life Science, Gaithersburg, MD, Fig. 1A) were inserted into the L6 and L7 DRG of cats F, G, and H and the L7 DRG of cat I. The L6 DRG of cat I was implanted with a 32-channel Utah Electrode Array (UEA, Blackrock Microsystems, Inc., Salt Lake City, UT, Fig. 1B). A high- speed pneumatic inserter was used for all arrays. The FMAs contained 32 stimulating electrodes that varied in length from 0.7 to 1.5 mm with a pitch of 400μm. Each FMA contained an additional 2 reference and 2 ground electrodes (3.0 mm length) placed at the corners. The UEA contained 32 electrodes in a 4×8 grid and were 1.5 mm long with a pitch of 400 μm. A stainless steel wire was inserted into a hole in the iliac crest and secured with a bone screw to act as an additional ground electrode and the return electrode for stimulation.
A five-contact nerve cuff electrode array (Ardiem Medical, Indiana, PA, 4 mm inter-electrode spacing) was wrapped around the left sciatic nerve approximately midway between the hip and knee. The first, third, and fifth contacts of the cuff were shorted together and used as a common reference in a virtual tripole configuration (Gaunt et al. 2009). ENG signals were recorded from the second and fourth contacts which were spaced 8 mm apart. Stimulation-triggered averaging (STA) was used to isolate evoked responses, and the conduction velocity was determined by measuring the propagation delay between the second and fourth contacts in the nerve cuff (Gaunt et al. 2009).
EMG electrodes were constructed using a pair of insulated, multi-stranded stainless steel wires (Cooner 636, 2 mm inter-electrode spacing along de-insulated segment). These were passed through muscle bellies of ten muscles in the left hindlimb: tensor fascia latae (TF), gluteus medius (GM), semimembranosus (SM), semitendinosus (ST), biceps femoris (BF), sartorius (SA), vastus lateralis (VL), tibialis anterior (TA), medial gastrocnemius (MG), and lateral gastrocnemius (LG). Leads for all ENG and EMG electrodes were passed through the skin into an external backpack which was fixed to a percutaneous titanium base sutured to the dorsal fascia and iliac crests. Leads were attached to a custom circuit board within the backpack. Recording and stimulating devices interfaced with electrodes through a header on the circuit board.
Anesthetized experiments: Recruitment threshold and conduction velocity testing
Testing began approximately one week after implantation. On the first day of testing each week, anesthetized experiments were performed to measure recruitment thresholds of each microelectrode channel on the implanted arrays. Thresholds were established by measuring antidromic volleys propagating along afferent fibers in the sciatic nerve cuff. ENG signals were recorded via a Grapevine Neural Interface Processor (Ripple, Salt Lake City, Utah), using a differential headstage (Surf-D) with an input range of 5 mV and a resolution of 0.2 μV. Digitization was performed directly on the headstage at 30 kHz. Stimulation was administered using two IZ2 16-channel stimulus isolators (TDT, Alachua, FL) and custom LabVIEW software in cats F, G, and H, or nano2+stim 32-channel headstages (Ripple, LLC) for cat I. The cat was sedated with a 0.04 mg/kg dose of Dexdomitor during these procedures. At the end of the experiment, a 0.4 mg/kg dose of Antisedan was administered to reverse the effects of Dexdomitor.
DRG microstimulation pulses were asymmetric, charge-balanced waveforms (200 μs cathodal phase followed by 400 μs anodal phase) delivered to one DRG microelectrode at a time. STA was used to measure evoked ENG responses in the sciatic nerve cuff. An initial survey using microstimulation pulse amplitudes of 30–40 μA was performed to identify electrodes that evoked detectable ENG responses. Microelectrodes found to evoke ENG responses were subsequently tested to find the recruitment threshold using a binary search procedure as described in Ayers et al. (2016). A single microelectrode from those that evoked an ENG response was chosen to serve as the stimulation channel for subsequent behavioral experiments during that particular week. Preference was given to microelectrodes that evoked antidromic volleys in afferent fibers that had high conduction velocities (>80 m/s) and low recruitment thresholds (<20 μA) so as to limit microstimulation amplitude and, thus, achieve more focal recruitment of afferent fibers in the ganglion.
Behaving experiments: Motor responses during quiet standing
Prior to implantation, animals were trained to stand with each paw on separate pegs containing load cells to measure vertical ground-reaction force (GRF). EMG and GRF were recorded continuously. During each trial, a train of 10 microstimulation pulses was delivered in a 100 ms interval (100 pulses per second) to a single DRG microelectrode (Fig. 2A&B). A trial was initiated only after the cat maintained even weight distribution (50±30%) across all limbs, for a randomized duration of 1–3 s. A food reward was dispensed following completion of each trial.
Figure 2.
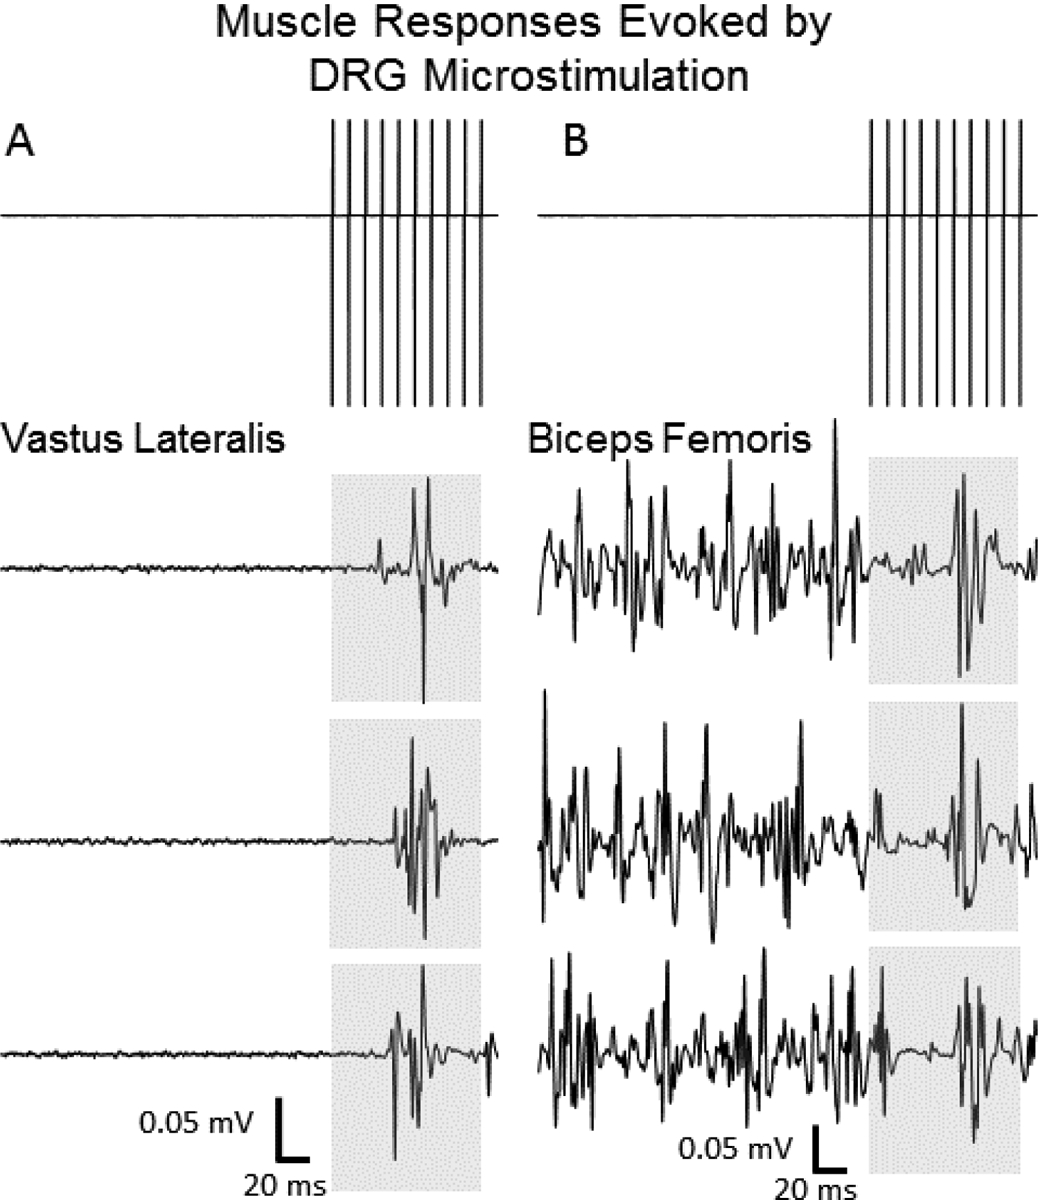
Voltage traces of microstimulation pulse trains delivered in behaving experiments (top panels). Representative electromyographic recordings of (A) excitatory (ST muscle) and (B) inhibitory (VL muscle) evoked responses from individual trials. Shaded regions correspond to the window in which the microstimulation train was delivered.
Microstimulation amplitude was set randomly to either a “low” or “high” amplitude at the start of each trial, based on the afferent recruitment threshold established in the anesthetized experiment earlier in the testing week. Low- and high-amplitude stimuli were set to a range of 0.9–2.5x and 1.1–3x threshold, respectively, across testing weeks. Despite a wide range of microstimulation amplitudes across weeks, there was no overlap in amplitudes used in low- and high-amplitude conditions within a given week. Microstimulation pulses were asymmetric, charge-balanced waveforms as used in anesthetized experiments. The number of trials varied across testing days and was largely contingent upon animal compliance. Testing days with fewer than 5 trials were discarded from analyses. Forces were sampled at 1 kHz (USB-6251, National Instruments, Austin, TX) and digitally filtered with a second-order low-pass Butterworth filter. EMG signals were sampled at either 20 or 40 kHz and digitized by an OmniPlex neural data acquisition system (Plexon, Dallas, TX).
Data processing
EMG filtering and artifact removal
Stimulation artifact was removed from the raw recordings by blanking the EMG signal in a 2.5 ms window, beginning 0.5 ms before and ending 2 ms after the onset of each microstimulation pulse. Data points in this window were removed from the EMG record, which was subsequently downsampled by computing the RMS value of the remaining data points in 10 ms intervals. The downsampled RMS values of the EMG signal were smoothed using a 4th order, non-causal Butterworth low pass filter (20 Hz cutoff). EMG waveforms from all trials for a given muscle were grouped by testing day and microstimulation amplitude (low and high) within each testing week.
Detection criteria for evoked responses in hindlimb muscles
The mean and standard deviation of EMG power in the pre-stimulus epoch (immediate 100 ms before stimulation onset) was calculated from all trials aligned in series and used to set detection criteria for excitatory and inhibitory responses in the response epoch (immediate 100 ms after stimulation onset). To detect excitation, the waveform-averaged EMG signal from all trials had to rise and remain 2 standard deviations above the pre-stimulus mean for 10 consecutive ms in the response epoch (Fig. 3). To detect inhibition, the waveform-averaged EMG signal from all trials had to fall and remain one standard deviation below the pre-stimulus mean for 10 consecutive ms in the response epoch (Fig. 4). Response latency was calculated as the time when detection criteria were satisfied. To calculate cumulative response rates, the number of testing days where a response was detected was expressed as a percentage of total testing days across weeks. A subset (<10%) of detected responses contained phases of both excitation and inhibition. These responses were categorized according to the first threshold crossed for calculations of cumulative response rate and persistence because the origin of the later response was less clear. For example, the later response could either be a direct result of microstimulation, a rebound to baseline muscle activity, or a combination of both. This subset of cases was also excluded from calculations of paired co-excitation and co-inhibition between muscles.
Figure 3.
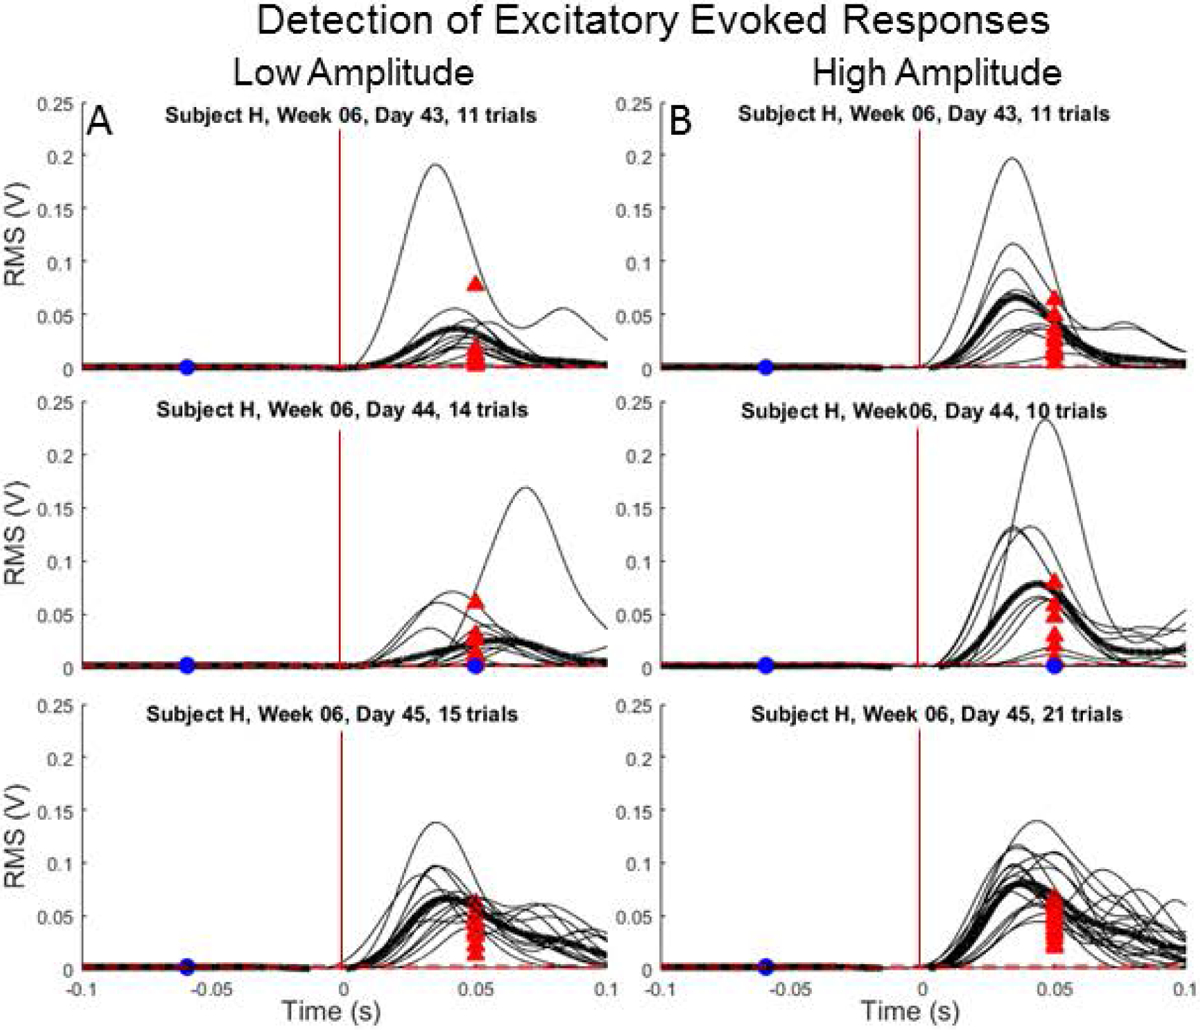
Representative testing days with excitatory evoked responses detected in the ST muscle for all trials administered with (A) low- and (B) high-amplitude microstimulation from a single testing week (H06). Horizontal dashed lines correspond to detection thresholds and vertical lines correspond to stimulation onset. Blue circles (undetected) and red arrows (detected) correspond to RMS of the pre-stimulus and response epochs, respectively. Placement of circles and arrows along horizontal axis is situated in the middle of each epoch.
Figure 4.
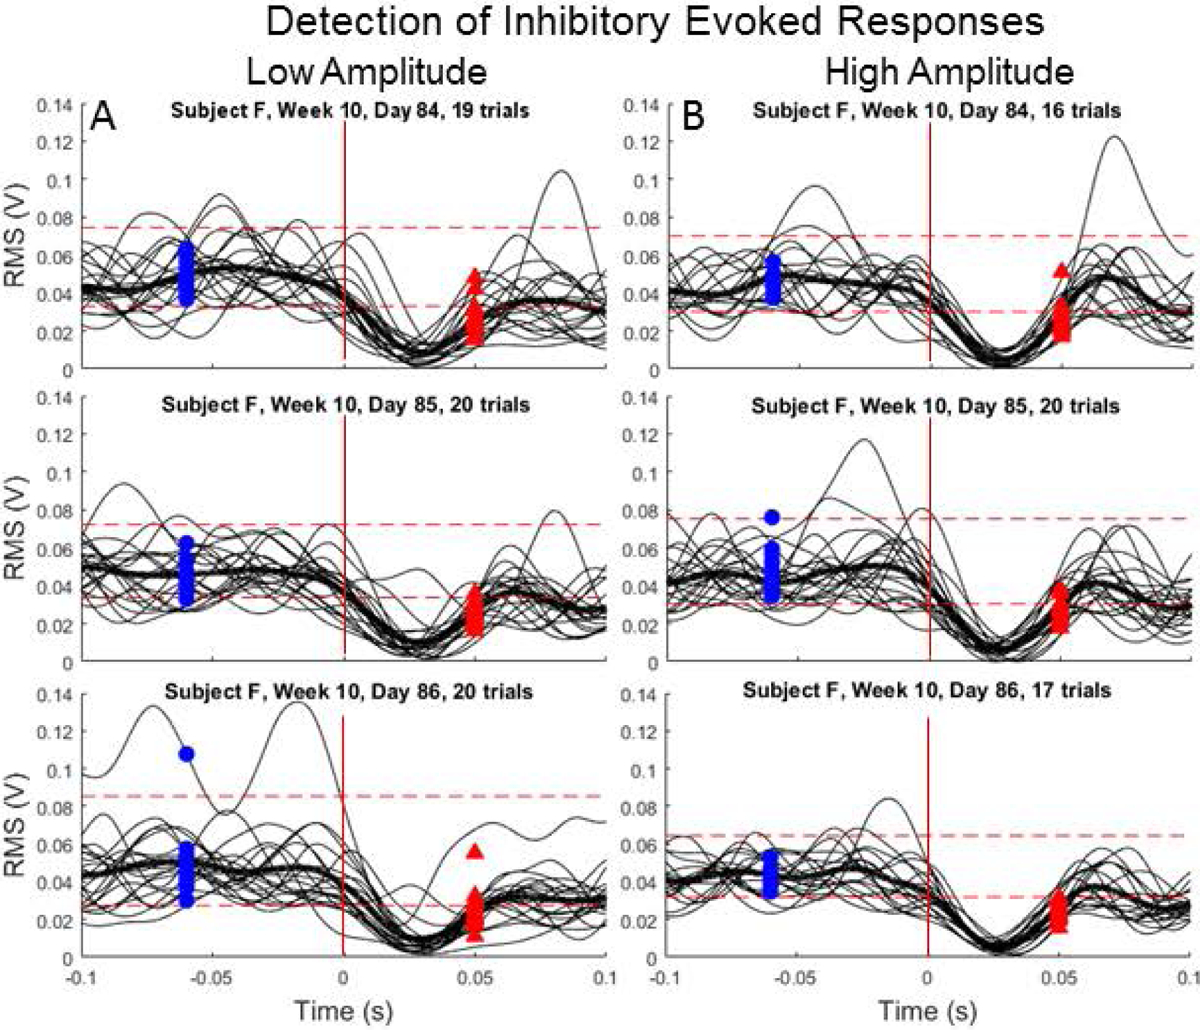
Representative testing days with inhibitory evoked responses detected in the VL muscle for all trials administered with (A) low- and (B) high-amplitude microstimulation from a single testing week (F10). Horizontal dashed lines correspond to detection thresholds and vertical lines correspond to stimulation onset. Blue circles (undetected) and red arrows (detected) correspond to RMS of the response epochs. Placement of circles and arrows along horizontal axis is situated in the middle of each epoch.
Certain aspects of the current study should be considered when interpreting cumulative response rates and latencies. On each trial, a train of 10 pulses were delivered in a 100 ms interval (100 pulses/sec) to a single DRG microelectrode. The amplitude of each pulse was on the order of tens of microamperes, resulting in focal recruitment of DRG neurons around the electrode tip. Thus, the number of afferents recruited and relative probability of bringing spinal motor neurons to threshold is lower than might be expected with other methods used to stimulate somatosensory afferents. For example, peripheral nerve stimulation used for eliciting Hoffman reflexes (H-reflexes) uses single pulses on the order of milliamperes, resulting in compound muscle action potentials (CMAPs) at fixed latencies. Since focal stimulation of the DRG likely recruits fewer afferents and, in turn, depolarizes motor neurons below threshold, temporal integration of multiple pulses may be required to evoke a measurable change in EMG. This integration time results in response latencies that are longer than those observed when using single-pulse stimulation to evoke H-reflexes.
Persistence of evoked responses in hindlimb muscles
The cumulative response rate calculation described above captures how frequently microstimulation across multiple DRG electrodes drives a response. However, it does not indicate the frequency of responses across trials within a testing day. Acknowledging the potential for variability in response detection across multiple trials of microstimulation and considering the importance of a neural interface evoking responses reliably, we quantified the persistence of motor responses on the testing days when the waveform-averaged EMG from a given muscle met detection criteria. For this purpose, recordings from individual trials on each testing day were passed through the same detection algorithm previously described. Persistence was calculated as the ratio of trials meeting detection criteria to the total number of trials administered on a given testing day. Persistence from low- and high-amplitude microstimulation was calculated separately.
Pairwise homologous and heterologous response patterns
In most cases, microstimulation evoked responses in multiple muscles. To account for response patterns across muscles, rates of co-excitation and co-inhibition of muscle pairs were quantified as homologous response patterns. Pairwise co-excitation and co-inhibition was calculated as the percentage of total testing days each pair of the 10 muscles were excited or inhibited together. The same calculation was made for muscle pairs with heterologous response patterns, which occur when one muscle exhibits excitation while the other is inhibited or vice versa.
Detection of hindlimb ground-reaction force
Plots of the vertical GRF of the left hindlimb were inspected to identify instances of overt modulations in response to microstimulation each testing week. Outlier trials were removed if the GRF exceeded 2.5 standard deviations of the mean of all repetitions in the pre-stimulus window (200 ms prior to stimulus onset). This criterion was intended to remove trials contaminated with excessive movement while also retaining a sufficient number of observations for statistical models examining covariation between GRF and EMG power (described below). The magnitude of hindlimb GRF was quantified by subtracting the mean force in the pre-stimulus epoch from the peak force in the first 200 ms after stimulation onset. In order to qualify as microstimulation-induced loading or unloading of the left hindlimb, the magnitude of the peak force had to be ≥ 0.5 N.
Covariation of microstimulation-induced hindlimb muscle recruitment and ground-reaction force
To understand which muscles were recruited to drive hindlimb behavior, a multilevel model was built that predicted GRF by EMG power. For this purpose, EMG power was calculated as the root-mean-square (RMS) in the response epoch for each trial. Since between- and within-subject effects were of interest, EMG power and GRF magnitude for all trials on weeks showing a modulation in GRF were entered in the model. EMG power for each muscle was entered as the independent variable (clustered by week), and GRF magnitude in the first 200 ms after stimulation onset was the dependent variable. To reduce redundancy in the model, EMG power for muscles with similar joint actions were averaged together (i.e., ankle extensors: MG and LG; knee flexors/hip extensors: semimembranosus, semitendinosus, and bicep femoris). Note that the sartorius muscle was not included in the knee flexor (KF) group because it also flexes the hip, unlike the other knee flexors which act to extend the hip. Trials with low-amplitude and high-amplitude microstimulation were entered into separate models.
Statistical Analysis
Normality was determined by the Shapiro-Wilk test. Welch t-tests were used to test for differences in recruitment thresholds and conduction velocities in the sciatic nerve on weeks with and without evoked responses detected in hindlimb muscles. Wilcoxon signed rank tests were used to test for differences in GRF elicited by low- and high-amplitude microstimulation. The mixed model procedure was administered using the proc mixed command in SAS (Version 9.4) to determine which muscles were recruited to drive GRF. The multilevel data structure was modeled linking trials within weeks (trials was level-1; week was level-2). A compound symmetry covariance structure was used as the working covariance matrix. In compound symmetry, two covariance parameters are estimated: a common covariance and a residual variance. The estimated correlation between two replications is the same across all replications. Once the parameters were entered into the model, likelihood ratio tests were examined. Significance indicated the necessity of modeling the covariance structure. The interclass correlation coefficient (ICC) is also reported and reflects the ratio of the between-week variance to the total variance in force. RMS values from all seven muscles were included as predictors in the final model, but only estimates that reached statistical significance are reported. The equation for the model is:
where i is the animal, and j is the trial. A subset of testing weeks included in mixed models involved stimulation on the same microelectrode channel. As explained above, these weeks likely engaged different afferent fibers given the lack of recruitment stability over long time scales (Fisher et al. 2014) and differences in conduction velocities and/or recruitment thresholds. Therefore, these weeks were treated as independent observations.
Aside from the mixed model procedure performed in SAS (Version 9.4), all other statistical analyses were performed in SPSS (Version 25). Significance was set at p<0.05, and values presented in the text and figures are means ± standard deviations unless noted otherwise.
Results
Sciatic nerve recruitment thresholds and conduction velocities
The total number of testing weeks completed was similar across cats (F=13, G=16, H=16, I=11). DRG microstimulation evoked responses in at least one muscle in 35 of the 56 (62.5%) total weeks of testing. Table 1 contains the microelectrode array and channels that were used on testing weeks where a motor response was evoked in one or more muscles. Corresponding recruitment thresholds and conduction velocities from afferent, antidromic volleys evoked on the selected microelectrode in anesthetized experiments are also provided. Recruitment thresholds on testing weeks with an evoked motor response (12.2±4.3 μA, 2.36±0.82 nC/phase) were similar to those without a response (11.2±4.8 μA; 2.30±1.06 nC/phase, p=0.73). Conduction velocities during response (83.8±25 m/s) and non-response weeks (74.2±21.5 m/s) were also similar (p=0.16).
Table 1.
Microstimulation arrays and electrodes with corresponding thresholds (μA) and conduction velocities (m/s) from the sciatic nerve cuff for weeks with evoked responses in one or more hindlimb muscles. Asterisks indicate weeks with a modulation in GRF.
| Cat | Week | Array | Electrode | Threshold (μA) | Conduction Velocity (m/s) |
|---|---|---|---|---|---|
| F | 1* | L6 | 9 | 12 | 40 |
| F | 2 | L6 | 1 | 4 | 120 |
| F | 7 | L6 | 2 | 9 | 40 |
| F | 8 | L6 | 7 | 9 | 80 |
| F | 10* | L6 | 9 | 12 | NA |
| G | 1 | L7 | 10 | 7 | 80 |
| G | 2 | L7 | 3 | 10 | 80 |
| G | 3 | L7 | 2 | 6 | 60 |
| G | 4 | L7 | 10 | 7 | 120 |
| G | 5 | L7 | 29 | 7 | 80 |
| G | 6 | L6 | 14 | 13 | 80 |
| G | 9 | L6 | 14 | 17 | 30 |
| G | 11 | L6 | 10 | 13 | 80 |
| G | 12* | L6 | 10 | 13 | 60 |
| G | 13* | L7 | 1 | 13 | 80 |
| G | 14 | L7 | 1 | 12 | 48 |
| H | 1 | L6 | 30 | 11 | 80 |
| H | 2 | L7 | 18 | 8 | 80 |
| H | 4* | L7 | 8 | 8 | 80 |
| H | 5* | L7 | 22 | 15 | 120 |
| H | 6* | L7 | 23 | 13 | 120 |
| H | 7 | L7 | 1 | 12 | 80 |
| H | 8* | L7 | 6 | 13 | 120 |
| H | 9* | L7 | 24 | 19 | 120 |
| H | 10* | L7 | 5 | 19 | 80 |
| H | 11* | L7 | 23 | 14 | 80 |
| H | 12 | L7 | 8 | 12 | 80 |
| H | 13* | L7 | 6 | 18 | 80 |
| H | 15 | L7 | 14 | 22 | 60 |
| H | 16* | L7 | 23 | 12 | 80 |
| I | 4* | L6 | 29 | 14 | 120 |
| I | 5 | L6 | 3 | 15 | 120 |
| I | 6* | L6 | 30 | 10 | 120 |
| I | 7 | L6 | 7 | 7 | 80 |
| I | 8* | L6 | 20 | 22 | 80 |
| I | 10* | L6 | 8 | 10 | 80 |
| I | 13 | L6 | 15 | 12 | 80 |
Evoked responses in hindlimb muscles
DRG microstimulation evoked motor responses in one or more muscles on 62.5% of testing weeks, or 77 of 139 testing days. Figures 3 and 4 show representative EMG waveforms for all trials on 3 separate testing days within a single testing week. The ST responses in Figure 3 (cat H, L7 array) show excitatory responses with latencies and amplitudes that are relatively consistent across trials and days. Response onset latency was 8.5±2.4 ms, with peak EMG occurring at 43.2±8.8 ms and then returning to near baseline levels by the time the stimulation train ended. Figure 4 shows consistent inhibitory responses in VL across 3 days of testing (cat F, L6 array). Response onset latency was 4.7±2.4 ms with maximal EMG suppression occurring at 28.0±1.1 ms before returning to near baseline levels ~50 ms into the response epoch.
Stacked bar plots in Figure 5 summarize cumulative response rates for each muscle during low- (Fig 5A) and high-amplitude (Fig 5B) microstimulation on the L6 and L7 array. The breakdown of excitatory and inhibitory response rates for each muscle are shown in different colors, and microstimulation array (i.e., L6 and L7) is shown in the bars to the left and right of each tick, respectively, on the horizontal axis.
Figure 5.
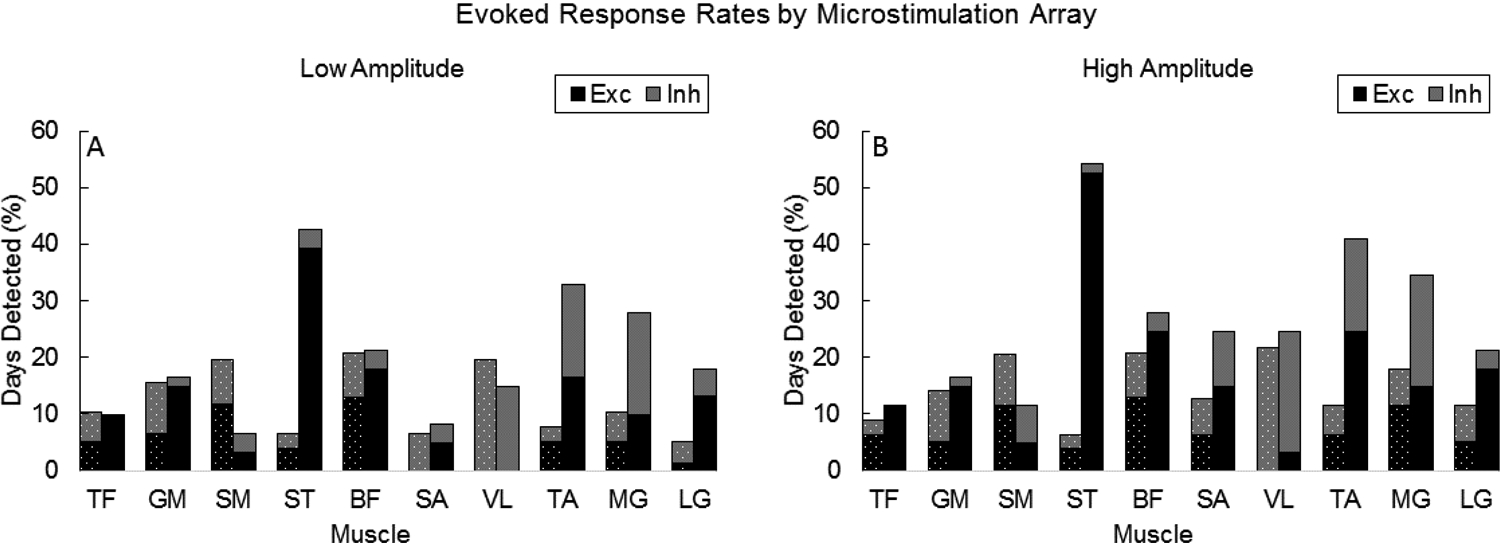
Stacked bar graphs illustrating cumulative response rates of detected motor responses from A) low- and B) high-amplitude microstimulation. Bars to the left (dashed) and right (solid) of each tick correspond to rates from microstimulation on L6 and L7 arrays. Black (excitatory) and grey (inhibitory) bars provide a breakdown of the composition of responses.
A microelectrode on the L6 array was selected 35 total weeks (low amplitude=77 testing days; high amplitude=78 testing days) and on the L7 array 21 total weeks (low amplitude=61 testing days; high amplitude=61 testing days). Despite a disproportionate number of testing weeks that a microelectrode on the L6 or L7 array was selected, differences in cumulative response rates are evident. On the L6 array, cumulative response rates across muscles and response type ranged as high as 19.5% and 21.8% with low- and high-microstimulation amplitudes, respectively. Maximum response rates on the L7 array were 39.3% and 52.5%, respectively. L7 microstimulation produced higher rates of excitation in 9 of the 10 muscles when averaged across microstimulation amplitudes. Conversely, L6 microstimulation produced higher cumulative rates of inhibition in 7 of the 10 muscles when averaged across amplitudes. Differences are also noted in the composition of responses microelectrodes on each array evoked. L6 microstimulation produced an approximately equal distribution of excitatory and inhibitory responses for most muscles (except SA and VL) with low- and high-amplitude microstimulation. However, microstimulation on the L7 array evoked mainly excitatory responses in most muscles with few exceptions: equal rates of excitatory and inhibitory responses were observed in TA, while VL and MG exhibited mainly inhibitory responses.
As indicated previously, bimodal responses consisting of distinct phases of excitation and inhibition were observed in some muscles during some testing days (low amplitude: n=19 cases; high amplitude n=29 cases). The vast majority (85%) of bimodal responses were characterized by excitation following inhibition. TA had the highest rate of bimodal responses, comprising 63% and 41% of all TA responses driven by low- and high-amplitude microstimulation, respectively. Most bimodal responses occurred in two of the animals (F: n=1, G: n=1, H: n=33, I: n=13) and from microstimulation on the L7 (n=34) vs. L6 (n=14) array.
Response latency of evoked responses
Box plots illustrating the distribution of evoked response latencies in each muscle are shown in Figure 6A. Wilcoxon signed ranked tests revealed no differences in latencies for either response type by microstimulation amplitude in any muscle. Therefore, latencies were collapsed across amplitudes. Box plots show variability in response latencies within and between muscles. However, histograms revealed that 53% of all responses occurred within 20 ms of microstimulation train onset (Fig. 6B). While 73% of inhibitory responses occurred within 20 ms of train onset (Fig. 6D), 38% of excitatory responses had onsets in this window (Fig. 6C). Another 37% of excitatory responses occurred between 20 and 40 ms after onset of the microstimulation train (Fig. 6C).
Figure 6.
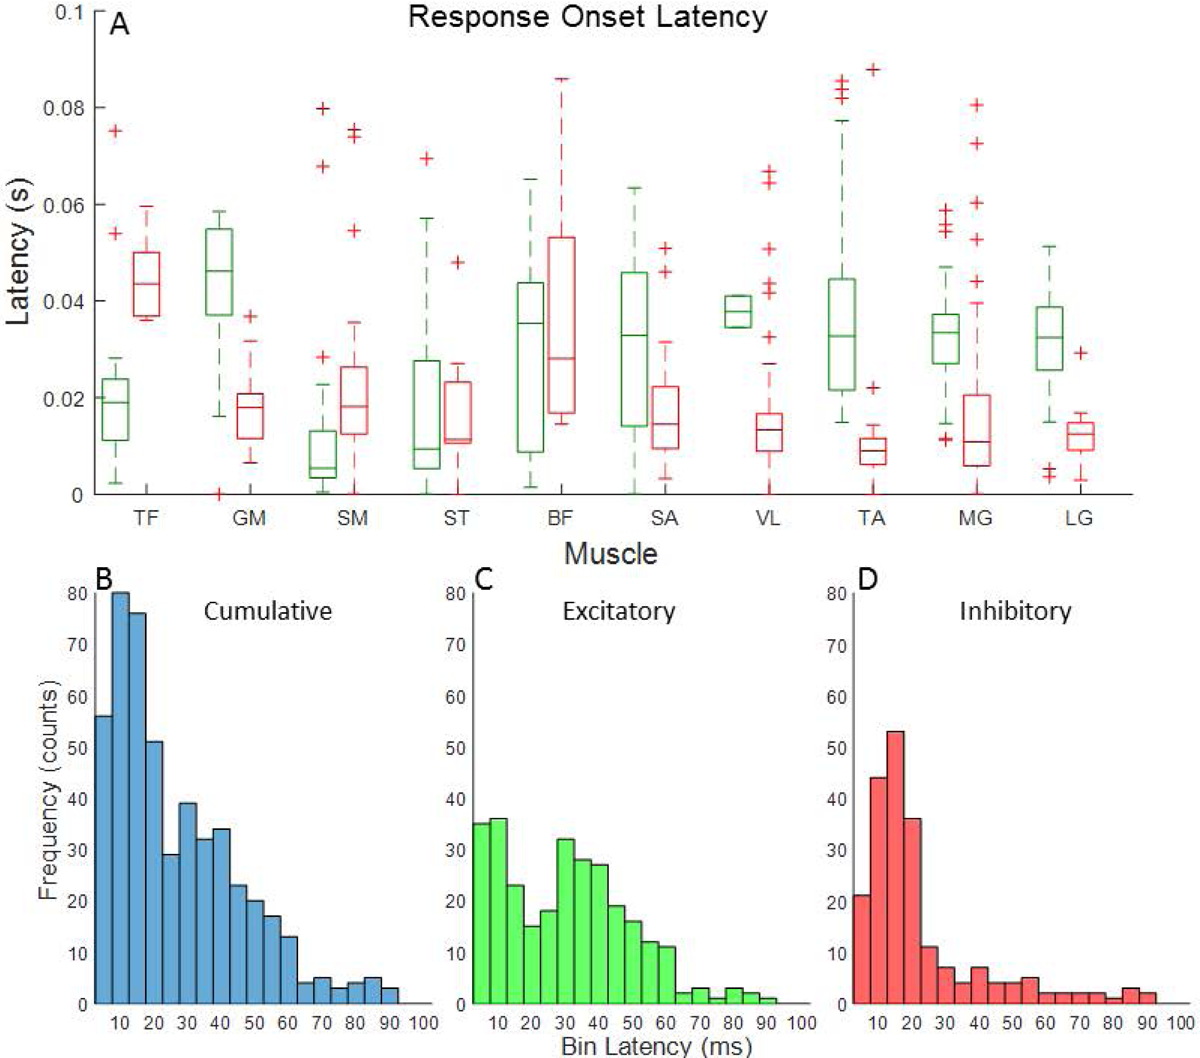
(A) Box plots showing the distribution of response onset latencies for excitatory (green) and inhibitory (red) evoked responses in each muscle. Histograms showing the frequency of response onsets (5 ms bins) for (B) all evoked responses combined, (C) excitatory responses only, and (D) inhibitory responses only.
Persistence of evoked responses
Persistence of excitatory and inhibitory responses is presented in Figures 7A and 7B. Low- and high-amplitude microstimulation elicited the same rate of persistence (78±7%) for excitatory responses across muscles. Persistence rates for inhibitory responses with low- and high-amplitude microstimulation were 90±5% and 88±6% across muscles, respectively, and trended higher for inhibitory relative to excitatory responses in 8 of the 10 muscles. Although excitatory responses were more persistent in SM and ST with low-amplitude microstimulation, persistence of inhibitory responses was slightly greater with high-amplitude microstimulation. These knee flexor muscles had higher excitatory persistence than 7 of the 8 other muscles. The VL muscle, which was most frequently inhibited, exhibited the lowest persistence of excitatory responses with high-amplitude microstimulation, and greater inhibitory persistence than 7 of the 9 other muscles.
Figure 7.
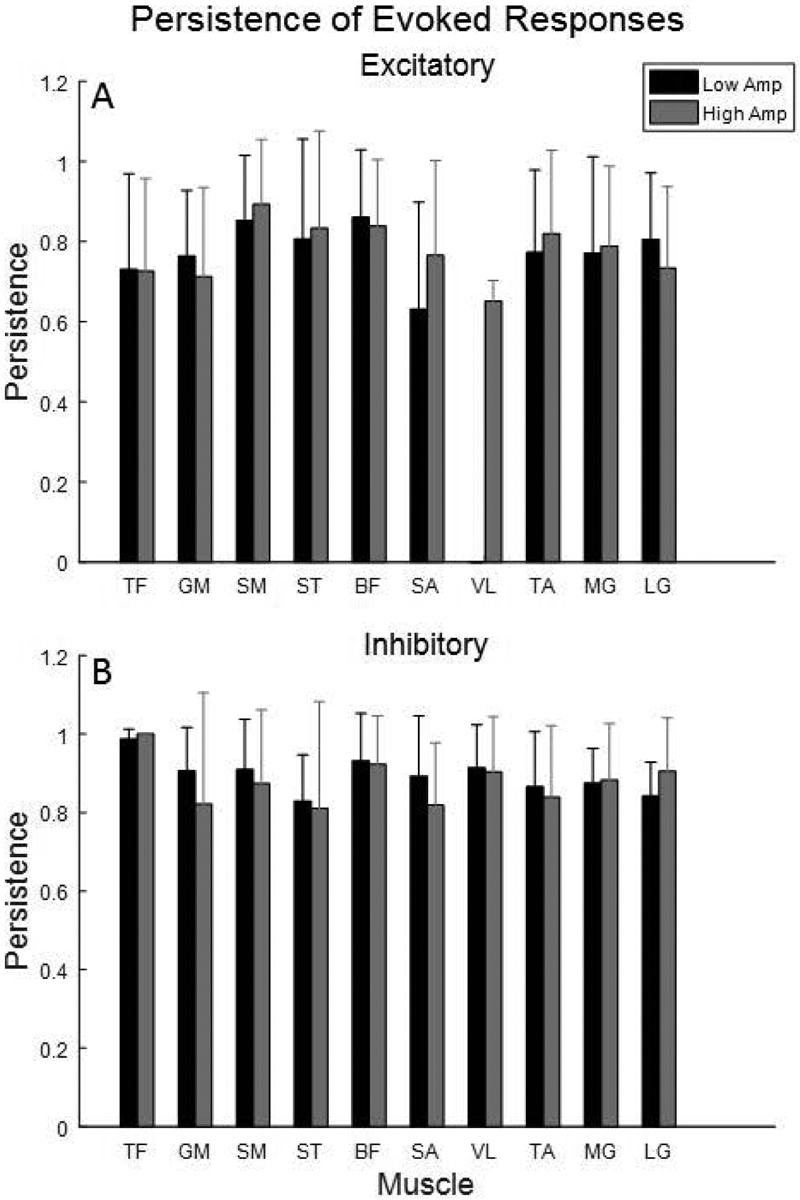
Mean persistence of (A) excitatory and (B) inhibitory evoked responses by muscle. Bars to the left and right of each tick correspond to low- (black) and high-amplitude (gray) microstimulation, respectively.
Pairwise homologous and heterologous response patterns
Figure 8 contains heat maps illustrating patterns of pairwise homologous and heterologous response patterns for muscles with the highest rates of co-excitation (ST: Fig. 8A, BF: Fig. 8B) or co-inhibition (VL: Fig. 8C). Response patterns resulting from low- and high-amplitude microstimulation were comparable and are reported as the average rate. Co-excitation between ST and TA was observed on 75% of testing days TA exhibited excitation (Fig. 8A). Two of the knee-flexor muscles, ST and BF, exhibited excitation most frequently (n=31 and n=23 testing days, respectively). These muscles had high rates of co-excitation with one another (58%) and the highest rates of co-excitation with other muscles (Fig. 8A&B). ST was excited in 63% of testing days that other muscles were excited, on average; a similar rate was observed for BF (62%). VL, a knee extensor, had the highest rate of inhibition with both amplitudes (n=24 testing days) and co-inhibition with other muscles (61% on average). VL was inhibited on the majority of testing days that one of the ankle extensors was inhibited (LG: 83%) and nearly half of testing days the other was inhibited (MG: ~40%). There was only one instance of either homologous response pattern (i.e., co-excitation or co-inhibition) between VL and ST (Fig. 8A&C). Although motor pools of both muscles were most frequently modulated by afferent pathways recruited by microstimulation as indicated by overall response rates, a homologous response pattern in these muscles was rare.
Figure 8.
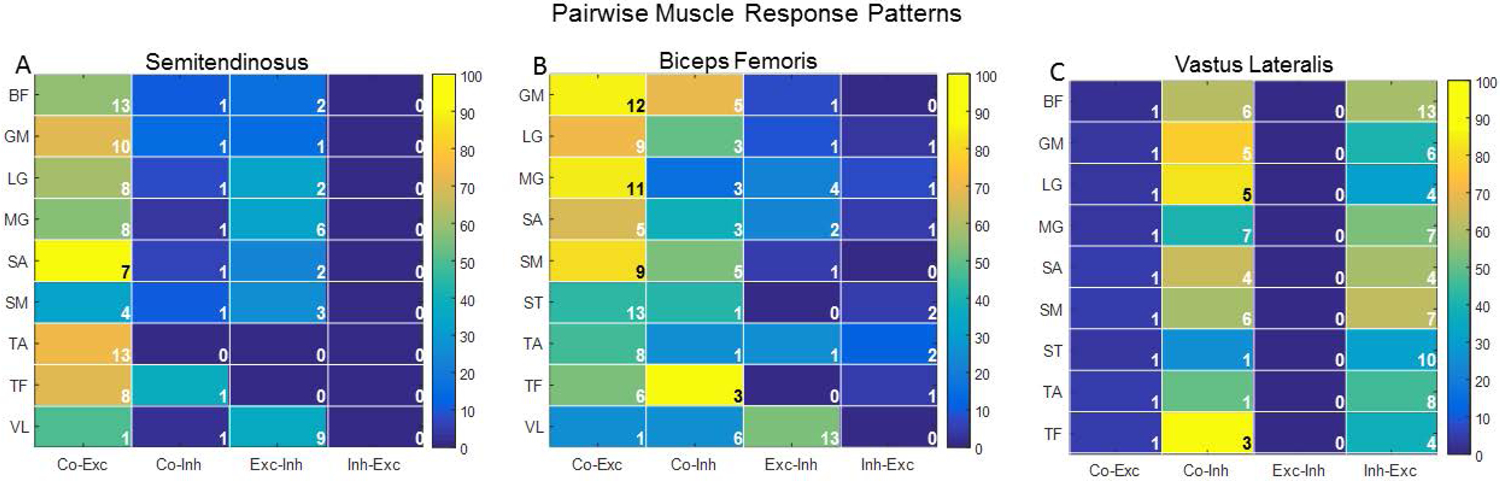
Heat maps showing the rate of paired response patterns in (A) ST, (B) BF, and (C) VL with all other muscles. Numeric values stipulate the absolute number of testing days each muscle pair exhibited a particular response pattern. Co-Exc= co-excitation; Co-Inh= co-inhibition; Exc-Inh= excitation in muscle of interest and inhibition in other muscles; Inh-Exc=inhibition in muscle of interest and excitation in other muscles.
Two groupings from the 10 muscles shared synergistic joint actions. These groupings include SM, BF, and ST which all act to flex the knee and extend the hip, and MG and LG which act to extend the ankle. There were 109 cases across low- and high-amplitude microstimulation in which at least one of the three knee flexor muscles was excited or inhibited. In 91% of these cases, there was uniform excitation or inhibition in a subset or all muscles exhibiting either response type. Stated another way, there was a homologous response pattern in the knee flexor muscles exhibiting a response. Two or three of the muscles were inhibited in 53% of cases with uniform excitation or inhibition. There were 73 cases in which either MG or LG were excited or inhibited. There was a homologous response pattern in 90% of these instances.
VL exhibited strict inhibition (as opposed to a bimodal response) on a total of 24 testing days. This muscle had the highest rate of co-inhibition and heterologous patterns with other muscles. Specifically, VL was inhibited on 47% of testing days that other muscles were excited when averaged across muscles. In most cases (70%), there was evidence of a heterologous response pattern resembling reciprocal inhibition, such that excitation was detected in at least one of the knee flexor muscles (Fig. 8A–C). At the ankle, cumulative response rates for excitation in TA and inhibition in MG and LG were higher than most muscles. However, a reciprocal response pattern was observed infrequently: TA excitation and MG (28%) or LG (18%) inhibition. This is likely an artifact of the inability to include bimodal responses in pairwise analyses based on objective criteria. As reported above, there were a large number of bimodal responses detected in TA.
Hindlimb ground-reaction force
Modulations in hindlimb GRF were detected on 17 total weeks: F: weeks 1 and 10; G: weeks 12 and 13; H: weeks 4, 5, 6, 8, 9, 10, 11, 13, and 16; I: weeks 4, 6, 8 and 10. The direction of the GRF was the same in each case with an unloading response exhibited on all 17 weeks. Representative GRF profiles are shown for each cat in Fig. 9A. Wilcoxon signed rank tests indicated that hindlimb unloading was significantly greater (Z=−3.34, p=0.001) when elicited by high-amplitude microstimulation (−1.99±1.14 N) relative to low-amplitude microstimulation (−1.46±0.91 N) (Fig. 9B).
Figure 9.
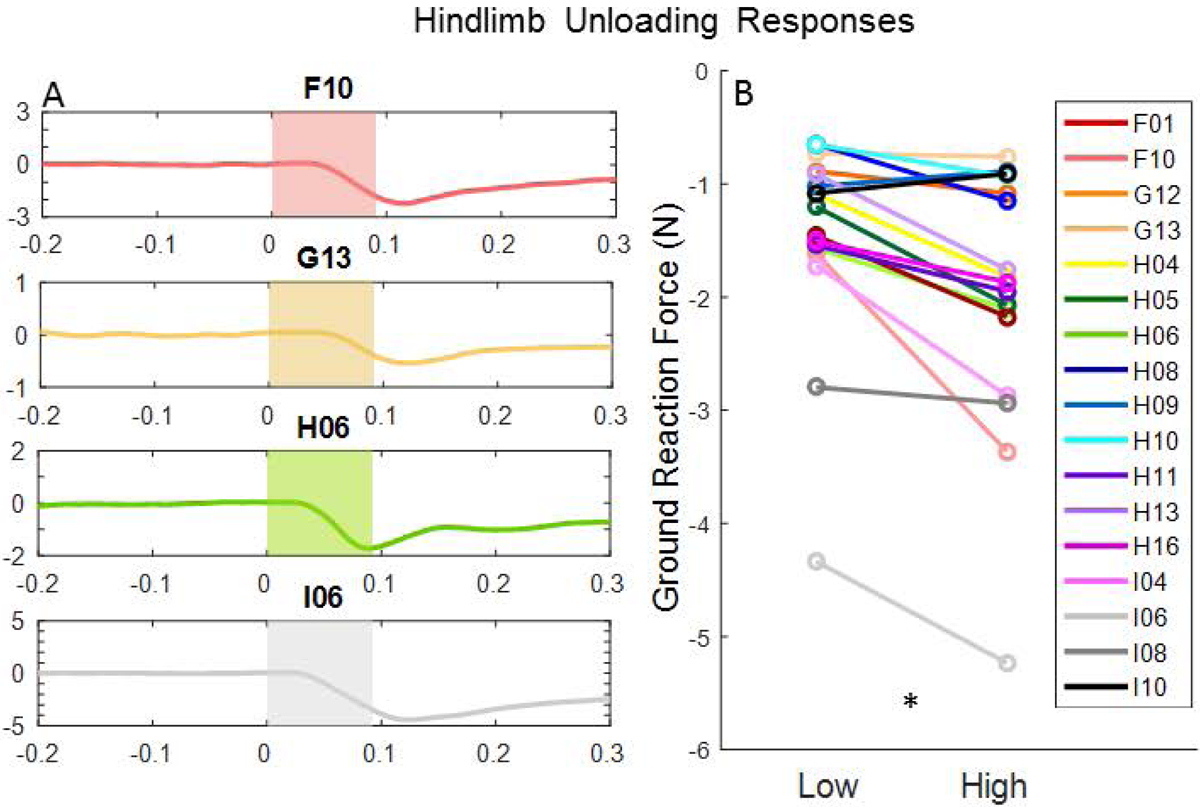
(A) Representative GRF profiles on testing weeks with microstimulation-induced unloading of the hindlimb in each cat tested. Shaded regions correspond to window in which the microstimulation train was delivered. (B) Line graph showing the change in GRF magnitude by microstimulation amplitude (*p<0.001).
Covariation of microstimulation-induced hindlimb muscle recruitment and ground-reaction force
All trials from the 17 weeks with a hindlimb unloading response were entered into separate mixed models for low-amplitude (321 total trials, 18.9±7.7 per cat) and high-amplitude (281 total trials, 16.5±7.0 per cat) microstimulation. Results of the likelihood ratio tests for the mixed model procedure indicated the importance of modeling the covariance structure for both low- (χ2=69.2, p<0.001) and high-amplitude (χ2=112.19, p<0.001) models. Interclass correlation coefficients for both models (ICCLow=0.34, ICCHigh=0.46) indicated a large cluster-level effect. TF (F=11.28, p<0.001), knee flexors (F=8.01, p=0.005), VL (F=11.09, p=0.001) and TA (F=7.75, p=0.006) contributed significantly to the low stimulation model and predicted hindlimb unloading. For every unit increase in TF, knee flexor, and TA EMG power, GRF magnitude decreased by 0.75 N (95% CI: [−1.7, −0.9]), 0.94 N (95% CI: [−1.6, −0.3]), and 0.44 N (95% CI: [−0.7, −0.1]), respectively. For every unit increase in VL EMG power, GRF magnitude increased by 0.94 N (95% CI: [0.4, 1.5]). In the high stimulation model, three of the same muscles contributed to hindlimb unloading: knee flexors (F=23.54, p<0.001), VL (F=13.74, p<0.001), and TA (F=12.36, p<0.001). For every unit increase in knee flexor and TA EMG power, GRF magnitude decreased by 1.76 N (95% CI: [−2.5, −1.1]) and 0.62 N (95% CI: [−1.0, −0.3]). For every unit increase in VL EMG power, GRF magnitude increased by 1.24 N (95% CI: [0.6, 1.9]). Trends in predicted GRF and corresponding EMG power in flexor muscles are shown in Figure 10.
Figure 10.
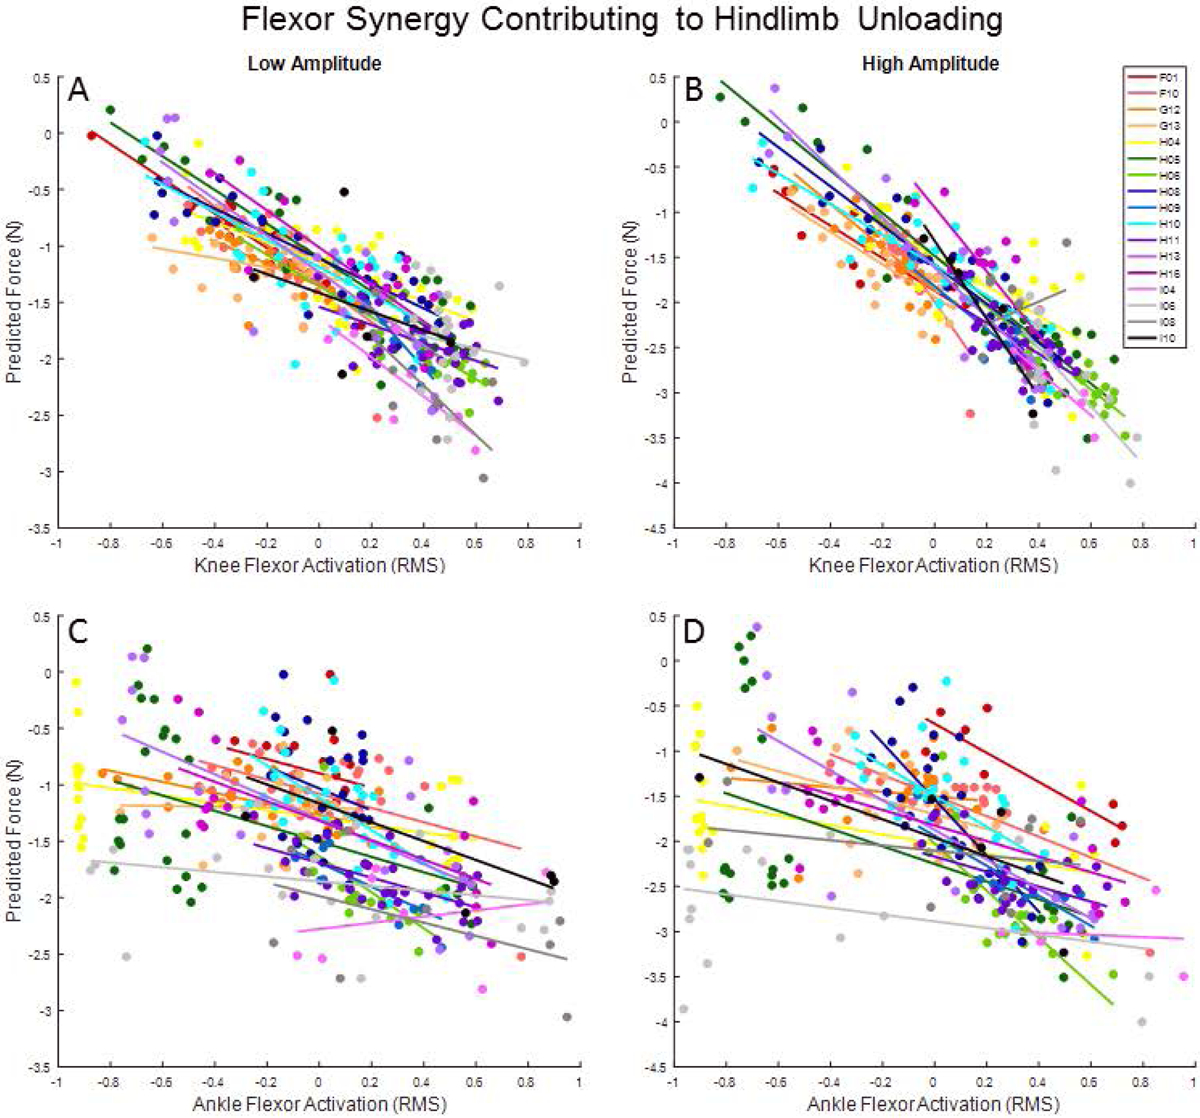
Predicted change in GRF magnitude vs. EMG power for (A&B) knee flexors and the (C&D) TA muscle in low-amplitude and high-amplitude microstimulation models. Data points correspond to individual trials from each of the 17 weeks included in models. Points are color coded with lines of best fit to illustrate trends within each week.
Discussion
In this study, microelectrode arrays were implanted chronically in the L6 and L7 DRG to examine the effects of recruiting different afferent bundles within each ganglion on hindlimb motor output in behaving animals. We found that microstimulation evoked a variety of excitatory and inhibitory responses, including a knee flexor synergy that appeared most frequently and consisted of flexor (ST and BF) excitation and extensor (VL) inhibition. A consistent hindlimb unloading behavior was observed on testing weeks when a modulation in GRF was detected, irrespective of the focal region to which microstimulation was delivered. The same subset of hindlimb muscles contributed to hindlimb behavior regardless of stimulus amplitude. Taken together, our findings demonstrate that DRG microstimulation recruits somatosensory afferents to drive stereotyped motor output under static standing in behaving animals.
Recruitment of DRG neurons and evoked responses in hindlimb muscles
Our prior work demonstrates that DRG microstimulation recruits group I and II afferent neurons at charge thresholds below 1 nC/phase in acute implants (Gaunt et al. 2009) and typically ~2x higher in chronic implants lasting up to 6 months (Fisher et al. 2014). In the present study, we measured charge thresholds over a 3-month implant period and found that thresholds were ~2.5 nC/phase, which is consistent with our prior results. A total of 41 DRG electrodes were tested during 56 testing weeks across 4 cats. Microstimulation trains evoked a mix of excitatory and inhibitory responses across muscles. Knee-flexor muscles (ST and BF) exhibited the highest cumulative response rate (~20–30%, the majority of which were excitatory. VL, TA, and MG also exhibited high response rates (~15–25%). VL was inhibited almost exclusively, while TA and MG exhibited a nearly even mix of excitation and inhibition. Homologous and heterologous response patterns demonstrated that the most common effect of DRG stimulation was to recruit flexor synergies at the knee and, to a lesser extent, at the ankle.
We observed differences in the frequency and pattern of responses evoked by stimulation at L7 and L6 DRG. Response rates were generally higher with microstimulation at L7, and excitatory response rates trended higher in all but one muscle and considerably higher in two muscles (ST and BF). Response rates were generally lower with L6 microstimulation, and the composition of responses was also more evenly balanced between inhibition and excitation relative to L7 microstimulation. Although a microelectrode from the L7 array was selected on less than 40% of testing weeks, this array accounted for nearly 60% of testing weeks showing a modulation of GRF under the foot of the implanted hindlimb. Recent work in decerebrate cats has demonstrated that epidural stimulation of the L7-S1 cat spinal cord produces greater knee range of motion at maximal flexion of the hindlimb during swing and stance phases of the gait cycle when compared to more rostral lumbar segments (Merkulyeva et al. 2018). It has been proposed that the effects of epidural spinal cord stimulation target myelinated somatosensory fibers of the dorsal roots that promote polysynaptic activation of spinal locomotor networks (Capogrosso et al. 2013). These findings taken together with those from the current study suggest strong convergence of L7 afferent pathways onto motor neuron pools of knee flexors.
Surveying multiple DRG locations over the course of many weeks rather than a fixed location over multiple days contributed, at least in part, to the observed cumulative response rates. However, mean persistence across testing days when an evoked response was detected ranged from 60–100%. Thus, DRG microstimulation evoked responses with near-perfect to perfect reliability when microstimulation targeted locations within either ganglion that produced motor responses. Persistence of inhibitory responses generally trended higher than for excitatory responses, which may be due less restrictive detection criteria. Alternatively, tonic discharge of motor units during static standing may have created a more optimal neuronal state to hyperpolarize motor neurons and, in turn, inhibit muscles.
Implications for Neural Prosthetics
To our knowledge, this is the first study to examine the effects of DRG microstimulation on hindlimb motor output in awake, behaving animals. Prior studies have examined motor responses to intraspinal microstimulation (ISMS) and dorsal root stimulation (DRS) in anesthetized or decerebrate cats. Tonic ISMS targeting the ventral horn of the lumbosacral enlargement induced rhythmic locomotor activity in decerebrate, chronically spinalized cats (Guevremont et al. 2006). Barthelemy et al (2006) compared motor responses evoked by ISMS and DRS applied at L3-S2 segments. L7 DRS evoked ipsilateral flexion at one intensity (15 μA), but the pattern of muscle responses varied depending on DRS intensity (Barthélemy et al. 2007). Our results are consistent with these findings, despite major differences in animal preparation and stimulation techniques.
Several groups have demonstrated the potential to leverage the effects of spinal cord stimulation to improve locomotor function after spinal cord injury (Wenger et al. 2016; Wagner et al. 2018). Given the importance of somatosensory feedback for both volitional lower-limb control (ie, cortical integration) and non-volitional fine-tuning of muscle activation patterns (ie, spinal integration), neural stimulation techniques that effectively engage afferent pathways in the dorsal spinal cord and DRG have the potential to inform the development of a neural interface technology to restore lower limb function in humans with neurological injury. The generalizability of the findings from this pre-clinical animal study to different clinical populations is unclear at present time. However, it is clear that the limited somatosensory input supplied by DRG microstimulation is capable of eliciting stereotyped patterns of muscle activity that might be used to aid functional lower-limb behaviors lost after neurological injury.
Physiological pathways mediating motor responses evoked by DRG microstimulation
Postural control, even under static conditions, likely involves some degree of polymodal convergence with limb state conveyed by various afferent inputs and the net motor output resulting from summation of these as well as descending inputs. Indeed, there is evidence of convergence of specialized load receptors onto the same pathways. For example, cutaneous and Ib afferent inputs converge onto common interneurons (Lundberg et al. 1977), and Ia afferent input can produce autogenic inhibition (Fetz et al. 1979; Jankowska et al. 1981b). Moreover, interneurons that receive input from Ia and Ib fibers can be activated by cutaneous input (Jankowska et al. 1981a). There is also evidence that group I afferents influence hindlimb motor neurons of heteronymous muscles (Harrison et al. 1983). Notwithstanding these factors, ongoing presynaptic inhibition of afferent terminals in an awake, behaving animal makes it difficult to fully dissociate the pathways depolarizing motor neurons. Although we cannot identify the neural pathways mediating evoked responses observed in the current study definitively, we offer the following observations.
First, nearly half of excitatory responses occurred on the order of 20 ms or less, suggesting transmission through spinally-mediated reflex circuits (Prochazka et al. 1976; Gorassini et al. 1994). A majority of inhibitory responses were also detected in this window. Detection of evoked responses at this latency coupled with a relatively high incidence of reciprocal inhibition at the knee suggests that microstimulation engaged monosynaptic and disynaptic Ia pathways. Second, it is well established that a number of receptors are activated when the hindlimb is loaded during stance (Cleland et al. 1982, 1990). The antiquated view that Ib-mediated autogenic inhibition is the primary force feedback under static conditions has been replaced by the idea that Ib and other load-related receptors feed into excitatory and inhibitory pathways to a variety of motor neurons (Duysens et al. 2000). However, since inhibition in one muscle coupled with excitation of its antagonist cannot account for all cases of inhibition observed here, it remains possible that there was some preferential activation of Ib-mediated autogenic inhibition. Third, given a relatively high stimulation frequency against the background of ongoing motor unit firing in the spinal cord, presynaptic inhibition of Ia afferent terminals (Eccles et al. 1962), homosynaptic post-activation depression (Hammar et al. 2002), and/or recurrent inhibition (Alvarez and Fyffe 2007) cannot be ruled out as contributors to the presence or absence of responses. Finally, and for reasons related to microstimulation-pulse integration, there is more uncertainty regarding the pathways mediating longer-latency responses.
Although not definitive, it seems plausible that summation of multiple pulses in the microstimulation train was required to bring a sufficient number of motor units to threshold to produce an evoked response in muscle(s). If this was the case, then the 10-ms lag between pulses might explain longer-latency responses that still could be mediated through local spinal circuitry. Alternatively, non-local neural circuitry is likely involved in producing these responses. For example, the histogram for excitatory responses (Fig. 6C) shows two distinct modes, which likely correspond to responses mediated by different pathways. The first mode shows a large group of responses have latencies less than 15 ms, which are consistent with spinal reflexes. The second mode in the response latency distribution is apparent for latencies between 26 and 40 ms. The latter group of latencies is compatible with those of equilibrium responses evoked in proximal hindlimb muscles and mediated by pathways involving the brainstem (Jacobs and Macpherson, 1996). While two response latency modes are clear, there are also responses with intermediate (16–25 ms) and longer (>45 ms) latencies. The range and variation in response latencies is unsurprising since responses were measured in 10 different muscles and originated from different stimulating different locations in L6 and L7 DRG. While it’s impossible to state with certainty, the intermediate-latency (16–25 ms) responses might be mediated by spinal pathways weakly activated by microstimulation at the low amplitudes used here, thus, requiring longer integration times to reach threshold. Involvement of brainstem and other pathways (e.g., propriospinal, transcortical, etc.) also appears likely given ongoing ascending and descending transmission in a behaving, albeit static state. Irrespective of the pathways involved, high persistence rates indicate that DRG microstimulation evokes consistent responses across repeated trials.
DRG microstimulation-induced modulations in hindlimb behavior
On a subset of weeks, DRG microstimulation produced transient unloading of the hindlimb. Stimulation was well-tolerated by animals, providing indirect evidence that unloading responses were not due to withdrawal reflexes induced by noxious stimuli (Levinsson et al. 1999). Microelectrode channels that recruited fast-conducting afferents were selected on the basis of conduction velocities that are incompatible with transmission along thin-diameter, unmyelinated fibers. The consistent direction of the behavioral response across all weeks with a modulation in GRF was unexpected, given the different DRG locations targeted within an animal and variability of array placement across animals.
Previous work has shown a nominal number of muscle synergies can account for force control during postural perturbations in different directions (Ting 2004). Our results show consistent patterns of within-week covariation between the extent of hindlimb unloading and response patterns in a specific subset of muscles. The same subset of muscles was involved regardless of microstimulation intensity, implying the involvement of a particular synergy driving behavior. High rates of co-excitation between the TA and knee flexors coupled with reciprocal inhibition of knee extensors across testing days render further support for this interpretation. Prior work has shown that transcutaneous FES systems used to assist the swing phase of the gait cycle in paraplegic humans can elicit whole-limb flexion when stimulation is applied to the peroneal nerve (Kobetic et al. 1997; Graupe and Kohn 1998). Afferent projections from this nerve converge on the DRG of the lumbar spine and, therefore, may have contributed to the unloading response observed here.
Conclusions and Future Directions
Our novel findings demonstrate that brief microstimulation trains delivered to focal regions of the L6 and L7 DRG evoke motor responses, resulting in stereotyped muscle response patterns that elicits a transient unloading of the hindlimb. Translating this pre-clinical animal work into humans is a necessary step, but there are also several points that require careful consideration. For example, experiments reported here involve administration of microstimulation under static conditions, but the resulting somatosensory inputs are likely integrated differently during dynamic behaviors, such as gait. Indeed, decades of human and animal work highlights the context-dependency of somatosensory integration in local spinal circuits. For instance, stimulation of Ia inhibitory pathways to extensor motor neurons elicits the highest IPSPs in their hyperpolarized phase during locomotion (Pratt and Jordan 1987), and disynaptic Ia inhibition from ankle flexors to extensors is also highest during the swing phase of the human gait cycle (Petersen et al. 1999). There is a reversal of disynaptic inhibition to disynaptic excitation during locomotion in the decerebrate cat mediated by activation of group Ib afferents (Pearson et al. 1993). A similar reflex reversal in the group I disynaptic pathway has been reported in humans (Stephens and Yang 1996). Load-sensitive afferents are considered essential for generating patterns of muscle activation during locomotion (Donelan et al. 2009; Pearson 2008) with Ib input from extensor muscles inhibiting flexors and exciting extensors during locomotion in the cat (Duysens and Pearson 1980; Pearson et al. 1993; Gossard et al. 1994). Thus, activation of DRG neurons will recruit one or more of these reflex circuits, promoting state-dependent changes in muscle activity that could support or impede dynamic behavior. Further work is needed to determine how microstimulation of the DRG can be administered to modulate muscle response patterns that promote postural control and enable gait transitions.
Acknowledgements:
This research was supported by National Institute of Neurological Disorders and Stroke Grant 5-R01-NS-072342-02.
We thank William Cusack, Kevin King, Ameya Nanivadekar, Tyler Simpson, Erin Garcia, and Kelly Meyers for help in preparing and performing experiments and Christina Zigler for statistical assistance.
Footnotes
Conflict of Interest: The authors declare no competing financial interests.
References
- Alvarez FJ, Fyffe REW (2007) The continuing case for the Renshaw cell. J Physiol 584: 31–45. [DOI] [PMC free article] [PubMed] [Google Scholar]
- Ayers CA, Fisher LE, Gaunt RA, Weber DJ (2016) Microstimulation of the lumbar DRG recruits primary afferent neurons in localized regions of lower limb. J Neurophysiol 116: 51–60. [DOI] [PMC free article] [PubMed] [Google Scholar]
- Barthélemy D, Leblond H, Rossignol S (2007) Characteristics and Mechanisms of Locomotion Induced by Intraspinal Microstimulation and Dorsal Root Stimulation in Spinal Cats. J. Neurophysiol 97: 1986–2000. [DOI] [PubMed] [Google Scholar]
- Bolton DAE, Misiaszek JE (2009) Contribution of Hindpaw Cutaneous Inputs to the Control of Lateral Stability During Walking in the Cat. J Neurophysiol 102: 1711–1724. [DOI] [PubMed] [Google Scholar]
- Bouyer LJG, Rossignol S (1998) The contribution of cutaneous inputs to locomotion in the intact and the spinal cat. Ann N Y Acad Sci 860: 508–512. [DOI] [PubMed] [Google Scholar]
- Van Den Brand R, Heutschi J, Barraud Q, DiGiovanna J, Bartholdi K, Huerlimann M, Friedli L, Vollenweider I, Moraud EM, Duis S, Dominici N, Micera S, Musienko P, Courtine G (2012) Restoring voluntary control of locomotion after paralyzing spinal cord injury. Science 336: 1182–1185. [DOI] [PubMed] [Google Scholar]
- Capogrosso M, Wenger N, Raspopovic S, Musienko P, Beauparlant J, Bassi Luciani L, Courtine G, Micera S (2013) A computational model for epidural electrical stimulation of spinal sensorimotor circuits. J. Neurosci 33: 19326–40. [DOI] [PMC free article] [PubMed] [Google Scholar]
- Carhart MR, He J, Herman R, D’Luzansky S, Willis WT (2004) Epidural Spinal-Cord Stimulation Facilitates Recovery of Functional Walking Following Incomplete Spinal-Cord Injury. IEEE Trans Neural Syst Rehabil 11(1): 32–42. [DOI] [PubMed] [Google Scholar]
- Charkhkar H, Shell CE, Marasco PD, Pinault GJ, Tyler DJ, Triolo RJ (2018) High-density peripheral nerve cuffs restore natural sensation to individuals with lower-limb amputations. J Neural Eng 15(5): 056002. [DOI] [PubMed] [Google Scholar]
- Cleland CL, Hayward L, Rymer WZ (1990) Neural mechanisms underlying the clasp-knife reflex in the cat. II. Stretch-sensitive muscular-free nerve endings. J Neurophysiol 64: 1319–1330, 1990. [DOI] [PubMed] [Google Scholar]
- Cleland CL, Rymer WZ, Edwards FR (1982) Force-sensitive interneurons in the spinal cord of the cat. Science 217: 652–655. [DOI] [PubMed] [Google Scholar]
- Clippinger FW, Seaber AV, McElhaney JH, Harrelson JM, Maxwell GM (1982) Afferent Sensory Feedback for Lower Extremity Prosthesis. Clin Orthop Relat Res 169: 202–206. [PubMed] [Google Scholar]
- Dhillon GS, Lawrence SM, Hutchinson DT, Horch KW (2004) Residual function in peripheral nerve stumps of amputees: Implications for neural control of artificial limbs. J Hand Surg Am 29: 605–615. [DOI] [PubMed] [Google Scholar]
- Donelan JM, McVea DA, Pearson KG (2009) Force Regulation of Ankle Extensor Muscle Activity in Freely Walking Cats. J Neurophysiol 101: 360–371. [DOI] [PubMed] [Google Scholar]
- Duysens J, Clarac F, Cruse H, Fysica M, National C, Recherche D (2000) Load-regulating mechanisms in gait and posture: comparative aspects. Physiol Rev 80: 83–133. [DOI] [PubMed] [Google Scholar]
- Duysens J, Pearson KG (1980) Inhibition of flexor burst generation by loading ankle extensor muscles in walking cats. Brain Res 187: 321–332. [DOI] [PubMed] [Google Scholar]
- Eccles JC, Schmidt RF, Willis WD (1962) Presynaptic inhibition of the spinal monosynaptic reflex pathway. J Physiol 161: 282–297. [DOI] [PMC free article] [PubMed] [Google Scholar]
- Fetz EE, Jankowska E, Johannisson T, Lipski J (1979) Autogenetic inhibition of motoneurones by impulses in group Ia muscle spindle afferents. J Physiol 293: 173–195. [DOI] [PMC free article] [PubMed] [Google Scholar]
- Fisher LE, Ayers CA, Ciollaro M, Ventura V, Weber DJ, Gaunt RA (2014) Chronic recruitment of primary afferent neurons by microstimulation in the feline dorsal root ganglia. J Neural Eng 11(3): 036007. [DOI] [PubMed] [Google Scholar]
- Formento E, Minassian K, Wagner F, Mignardot JB, Le Goff-Mignardot CG, Rowald A, Bloch J, Micera S, Capogrosso M, Courtine G (2018) Electrical spinal cord stimulation must preserve proprioception to enable locomotion in humans with spinal cord injury. Nat Neurosci 21: 1728–1741. [DOI] [PMC free article] [PubMed] [Google Scholar]
- Gaunt RA, Hokanson JA, Weber DJ (2009) Microstimulation of primary afferent neurons in the L7 dorsal root ganglia using multielectrode arrays in anesthetized cats: Thresholds and recruitment properties. J Neural Eng 6(5): 055009. [DOI] [PMC free article] [PubMed] [Google Scholar]
- Gorassini MA, Prochazka A, Hiebert GW, Gauthier MJ (1994) Corrective responses to loss of ground support during walking. I. Intact cats. J. Neurophysiol 71: 603–10. [DOI] [PubMed] [Google Scholar]
- Gossard JP, Brownstone RM, Barajon I, Hultborn H (1994) Transmission in a locomotor-related group Ib pathway from hindlimb extensor muscles in the cat. Exp Brain Res 98: 213–228. [DOI] [PubMed] [Google Scholar]
- Graupe D, Kohn KH (1998) Functional neuromuscular stimulator for short-distance ambulation by certain thoracic-level spinal-cord-injured paraplegics. Surg Neurol 50: 202–7. [DOI] [PubMed] [Google Scholar]
- Guevremont L, Renzi CG, Norton JA, Kowalczewski J, Saigal R, Mushahwar VK (2006) Locomotor-related networks in the lumbosacral enlargement of the adult spinal cat: Activation through intraspinal microstimulation. IEEE Trans Neural Syst Rehabil Eng 14: 266–272. [DOI] [PubMed] [Google Scholar]
- Hammar I, Slawinska U, Jankowska E (2002) A comparison of postactivation depression of synaptic actions evoked by different afferents and at different locations in the feline spinal cord. Exp Brain Res 145: 126–129. [DOI] [PubMed] [Google Scholar]
- Harrison PJ, Jankowska E, Johannisson T (1983) Shared reflex pathways of group I afferents of different cat hind‐limb muscles. J Physiol 338: 113–128. [DOI] [PMC free article] [PubMed] [Google Scholar]
- Honeycutt CF, Nardelli P, Cope TC, Nichols TR (2012) Muscle spindle responses to horizontal support surface perturbation in the anesthetized cat: insights into the role of autogenic feedback in whole body postural control. J Neurophysiol 108: 1253–1261. [DOI] [PMC free article] [PubMed] [Google Scholar]
- Honeycutt CF, Nichols TR (2010) Disruption of cutaneous feedback alters magnitude but not direction of muscle responses to postural perturbations in the decerebrate cat. Exp Brain Res 203: 765–771. [DOI] [PMC free article] [PubMed] [Google Scholar]
- Huang H, He J, Herman R, Carhart MR (2006) Modulation effects of epidural spinal cord stimulation on muscle activities during walking. IEEE Trans Neural Syst Rehabil Eng 14: 14–23. [DOI] [PubMed] [Google Scholar]
- Huang S, Ferris DP (2012) Muscle activation patterns during walking from transtibial amputees recorded within the residual limb-prosthetic interface. J. Neuroeng Rehabil: 9:55. [DOI] [PMC free article] [PubMed] [Google Scholar]
- Jacobs R, Macpherson J (1996) Two functional muscle groupings during postural equilibrium tasks in standing cats. J Neurophysiol 76: 2402–2411. [DOI] [PubMed] [Google Scholar]
- Jankowska E, Johannisson T, Lipski J (1981a) Common interneurones in reflex pathways from group 1a and 1b afferents of ankle extensors in the cat. J Physiol 310: 381–402. [DOI] [PMC free article] [PubMed] [Google Scholar]
- Jankowska E, McCrea D, Mackel R (1981b) Pattern of “non-reciprocal” inhibition of motoneurones by impulses in group Ia muscle spindle afferents in the cat. J Physiol 316: 393–409. [DOI] [PMC free article] [PubMed] [Google Scholar]
- Kobetic R, Triolo RJ, Marsolais EB (1997) Muscle selection and walking performance of multichannel FES systems for ambulation in paraplegia. IEEE Trans Rehabil Eng 5: 23–29. [DOI] [PubMed] [Google Scholar]
- Lavrov I, Courtine G, Dy CJ, van den Brand R, Fong AJ, Gerasimenko Y, Zhong H, Roy RR, Edgerton VR (2008) Facilitation of stepping with epidural stimulation in spinal rats: Role of sensory input. J. Neurosci 28: 7774–80. [DOI] [PMC free article] [PubMed] [Google Scholar]
- Lundberg A, Malmgren K, Schomburg ED (1977) Cutaneous facilitation of transmission in reflex pathways from Ib afferents to motoneurones. J Physiol 265: 763–780. [DOI] [PMC free article] [PubMed] [Google Scholar]
- Merkulyeva N, Veshchitskii A, Gorsky O, Pavlova N, Zelenin PV., Gerasimenko Y, Deliagina TG, Musienko P (2018) Distribution of spinal neuronal networks controlling forward and backward locomotion. J. Neurosci 38: 4695–4707. [DOI] [PMC free article] [PubMed] [Google Scholar]
- Nichols TR (1999) Receptor mechanisms underlying heterogenic reflexes among the triceps surae muscles of the cat. J Neurophysiol 81: 467–478. [DOI] [PubMed] [Google Scholar]
- Pearson KG (1995) Proprioceptive regulation of locomotion. Curr Opin Neurobiol 5: 786–791. [DOI] [PubMed] [Google Scholar]
- Pearson KG (2008) Role of sensory feedback in the control of stance duration in walking cats. Brain Res Rev 57: 222–227. [DOI] [PubMed] [Google Scholar]
- Pearson KG, Collins DF, KG P, Collins DF (1993) Reversal of the influence of group Ib afferents from plantaris on activity in medial gastrocnemius muscle during locomotor activity. J Neurophysiol 70: 1009–1017. [DOI] [PubMed] [Google Scholar]
- Petersen N, Morita H, Nielsen J (1999) Modulation of reciprocal inhibition between ankle extensors and flexors during walking in man. J Physiol 520: 605–619. [DOI] [PMC free article] [PubMed] [Google Scholar]
- Pratt CA, Jordan LM (1987) Ia inhibitory interneurons and Renshaw cells as contributors to the spinal mechanisms of fictive locomotion. J Neurophysiol 57: 56–71. [DOI] [PubMed] [Google Scholar]
- Prochazka A, Westerman RA, Ziccone SP (1976) Discharges of single hindlimb afferents in the freely moving cat. J Neurophysiol 39: 1090–1104. [DOI] [PubMed] [Google Scholar]
- Seyedali M, Czerniecki JM, Morgenroth DC, Hahn ME (2012) Co-contraction patterns of trans-tibial amputee ankle and knee musculature during gait. J. Neuroeng Rehabil 9:29. [DOI] [PMC free article] [PubMed] [Google Scholar]
- Stephens MJ, Yang JF (1996) Short-latency, non-reciprocal group I inhibition is reduced during the stance phase of walking in humans. Brain Res 743: 24–31. [DOI] [PubMed] [Google Scholar]
- Tan DW, Schiefer MA, Keith MW, Anderson JR, Tyler J, Tyler DJ (2014) A neural interface provides long-term stable natural touch perception. Sci Transl Med 6: 257ra138. [DOI] [PMC free article] [PubMed] [Google Scholar]
- Ting LH (2004) A limited set of muscle synergies for force control during a postural task. J Neurophysiol 93: 609–613. [DOI] [PubMed] [Google Scholar]
- van Velzen JM, Van Bennekom CA, Polomski W, Slootman JR, van der Woude LH, Houdijk H (2006) Physical capacity and walking ability after lower limb amputation: A systematic review. Clin Rehabil 20: 999–1016. [DOI] [PubMed] [Google Scholar]
- Wagner FB, Mignardot JB, Le Goff-Mignardot CG, Demesmaeker R, Komi S, Capogrosso M, Rowald A, Seáñez I, Caban M, Pirondini E, Vat M, McCracken LA, Heimgartner R, Fodor I, Watrin A, Seguin P, Paoles E, Van Den Keybus K, Eberle G, Schurch B, Pralong E, Becce F, Prior J, Buse N, Buschman R, Neufeld E, Kuster N, Carda S, von Zitzewitz J, Delattre V, Denison T, Lambert H, Minassian K, Bloch J, Courtine G (2018) Targeted neurotechnology restores walking in humans with spinal cord injury. Nature 563: 65–71. [DOI] [PubMed] [Google Scholar]
- Wenger N, Moraud EM, Gandar J, Musienko P, Capogrosso M, Baud L, Le Goff CG, Barraud Q, Pavlova N, Dominici N, Minev IR, Asboth L, Hirsch A, Duis S, Kreider J, Mortera A, Haverbeck O, Kraus S, Schmitz F, DiGiovanna J, Van Den Brand R, Bloch J, Detemple P, Lacour SP, Bézard E, Micera S, Courtine G (2016) Spatiotemporal neuromodulation therapies engaging muscle synergies improve motor control after spinal cord injury. Nat Med 22: 138–145. [DOI] [PMC free article] [PubMed] [Google Scholar]
- Zehr EP, Stein RB (1999) What functions do reflexes serve during human locomotion? Prog Neurobiol 58: 185–205. [DOI] [PubMed] [Google Scholar]