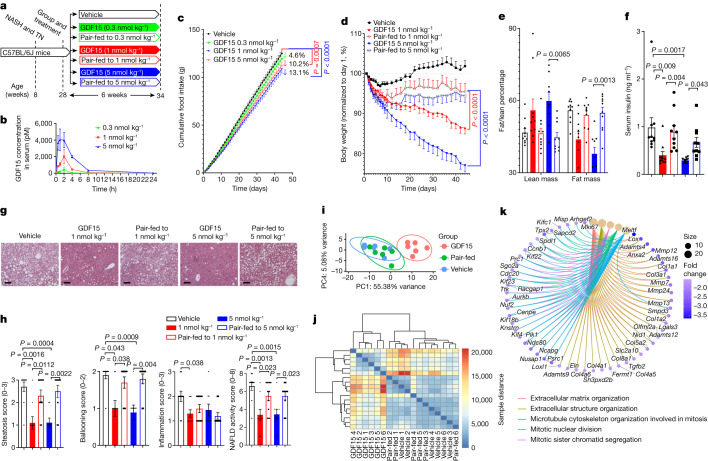
Fig. 1. GDF15 reduces obesity, insulin resistance and NASH independently of reductions in food intake.
a, Experimental schematic. TN, thermoneutrality. b, Plasma GDF15 after injection with 0.3, 1 and 5 nmol per kg GDF15. Data are mean ± s.e.m. n = 3 mice per group. c, Food intake over time. Data are mean ± s.e.m. n = 10 mice per group, except for GDF15 (5 nmol per kg), for which n = 9 mice. P values were calculated using two-way analysis of variance (ANOVA) with Tukey’s multiple-comparison test. d, The percentage change in body mass over time. Data are mean ± s.e.m. n = 10 mice per group, except for GDF15 (5 nmol per kg), for which n = 9 mice. P values were calculated using two-way ANOVA with Tukey’s multiple-comparison test. e, The percentage of fat/lean mass relative to body mass. Data are mean ± s.e.m. n = 10 mice per group, except for GDF15 (5 nmol per kg), for which n = 9 mice. P values were calculated using two-way ANOVA with Tukey’s multiple-comparison test. f, Serum insulin. Data are mean ± s.e.m. n = 10 mice per group, except for GDF15 (5 nmol per kg), for which n = 9 mice. P values were calculated using one-way ANOVA with Tukey’s multiple-comparison test. g, Representative images of paraffin-embedded liver sections stained with haematoxylin and eosin (H&E). h, From left to right, steatosis score, ballooning score, inflammation score and NAFLD activity score. Data are mean ± s.e.m. n = 10 mice per group, except for GDF15 (5 nmol per kg), for which n = 9 mice. P values were calculated using two-sided unpaired Mann–Whitney U-tests. i, PCA of liver samples from vehicle-treated and GDF15-treated (5 nmol per kg) mice and pair-fed controls using VST data from DESeq2. n = 6 mice per group. j, Heatmap of the sample-to-sample distances on the basis of VST data from DESeq2. n = 6 mice per group. k, Gene-concept network diagram, indicating the corresponding enriched GO terms according to differentially expressed genes (DEGs) between vehicle and GDF15 groups.

