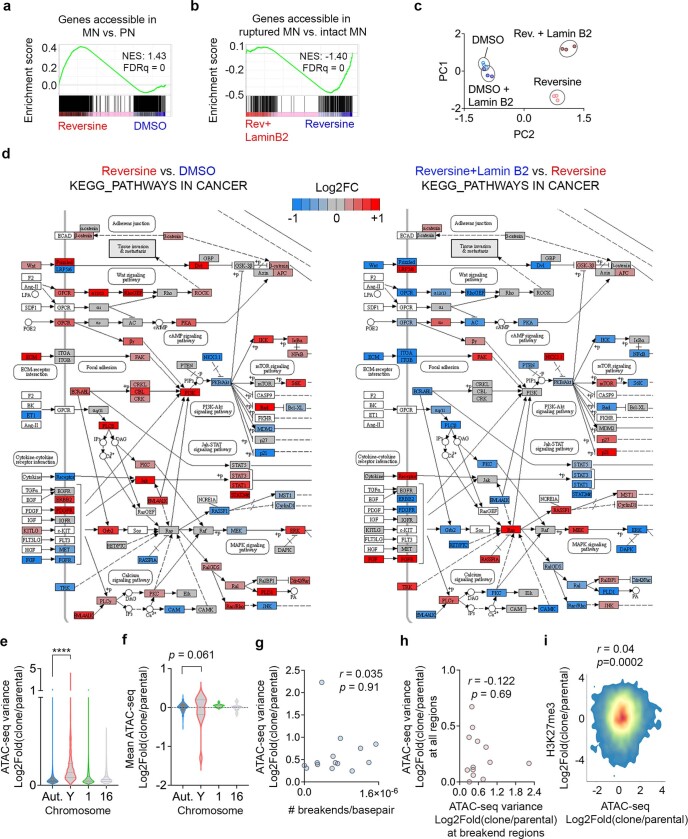
Extended Data Fig. 9. Chromosome missegregation upregulates cancer pathways and heterogeneity in genomic accessibility.
a, Enrichment plots of genes that are more accessible in MN vs. PN of 4T1 cells against genes that are more accessible in in either long-term reversine-treated or DMSO-treated p53 KO RPE-1 cells. b, Enrichment plots of genes that are more accessible in ruptured MN vs. PN of 4T1 cells against genes that are more accessible in either long-term reversine-treated p53 KO RPE-1 cells or reversine-treated p53 KO RPE-1 cells overexpressing lamin B2. c, Principal component analysis (PCA) plot of TP53 KO hTERT-RPE-1 cells based on a list of tumor suppressor genes and oncogenes, n = 3 biological triplicates. d, KEGG pathway analysis from KEGG Pathways in cancer – Homo sapiens (human) database (map05200). Long-term reversine-treated vs. DMSO-treated p53 KO RPE-1 cells analysis is shown on the left, while long-term reversine-treated lamin B2-overexpressing p53 KO RPE-1 cells vs. long-term reversine-treated p53 KO RPE-1 cells is shown on the right. e, Violin plots representing intraclonal variance across 10kb segments in each of 14 DLD-1 CEN-SELECT clones. Aut. = autosomes, Y = Y chromosome, 1 = chromosome 1, 16 = chromosome 16. Distribution represents 86,666 calculated values for autosomes, 730 calculated values for Y chromosome. ***** p < 0.0001, two-sided Mann-Whitney test. f, Inter-clonal comparison of fold change of ATAC-seq peaks in autosomes, and the Y chromosomes in 14 DLD-1 single clones isolated from CEN-SELECT system to parental control. Aut. = autosomes, Y = Y chromosome, 1 = chromosome 1, 16 = chromosome 16. Bars represent median, statistical significance tested using two-sided Mann-Whitney test. g, Scatter plot comparing ATAC-seq fold change variance to number of breakends per basepair in the Y-chromosome of the clones of DLD-1 CEN-SELECT system cells. h, Scatter plot comparing ATAC-seq fold change variance in regions with breakends to ATAC-seq fold change variance across all regions in the Y-chromosome of the clones of DLD-1 CEN-SELECT system cells. For g and h, statistical test was done using two-sided Pearson’s rank correlation. No adjustments were made for multiple comparisons. i, Density plot showing the comparison of the log2 fold change of H3K27me3 CUT&RUN reads vs. ATAC-seq reads in a given region between DLD-1 CEN-SELECT clones vs. parental, correlation measured with two-sided Spearman’s rank correlation statistic.

