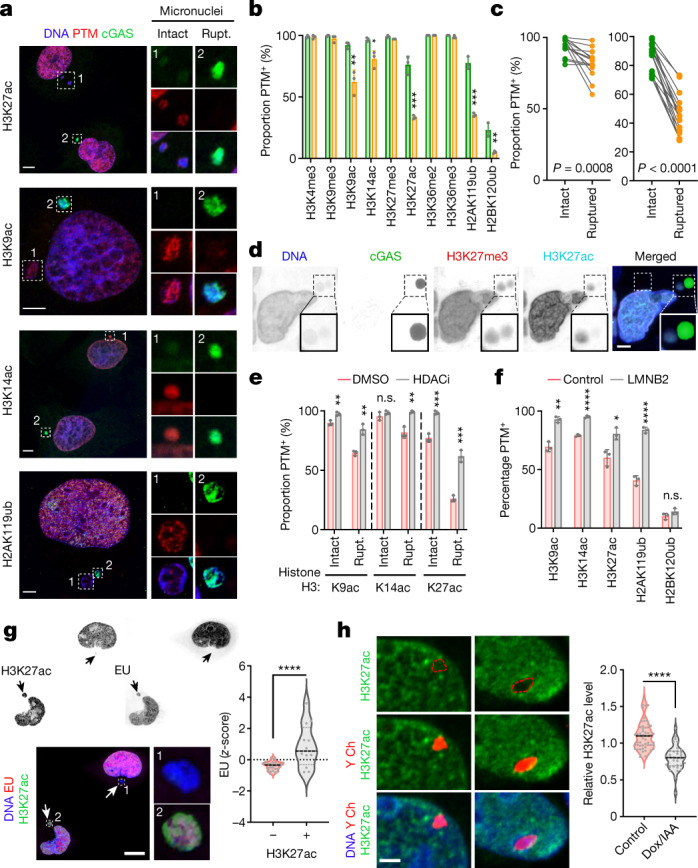
Fig. 2. Micronuclear rupture and chromosome missegregation alter histone post-translational modifications in micronuclei.

a, Representative images of MDA-MB-231 cells stained for DNA (blue), histone PTMs (red) and cGAS (green). White outlined boxes show a magnified view of micronuclei, either intact or ruptured (Rupt.). b, Percentage of intact (green bars) and ruptured (yellow) micronuclei with histone PTMs in MDA-MB-231 cells; *P < 0.05, **P < 0.01, ***P < 0.001, two-sided t-test, n = 3; bars show mean ± s.d. c, Percentage of intact and ruptured micronuclei with H3K27me3 (left, P = 0.0008) and H3K27ac (right, P < 0.0001) in human high-grade serous ovarian cancer (HGSOC) samples; n = 16, two-sided paired t-test. d, Representative images from 16 human HGSOC samples stained for DNA (blue), cGAS (green), H3K27me3 (red) and H3K27ac (cyan). e, Percentage of intact and ruptured micronuclei with histone PTMs in DMSO-treated (red bars) or vorinostat-treated (grey) MDA-MB-231 cells; **P < 0.01, ***P < 0.001, two-sided t-test, n = 3; data represent mean ± s.d. f, Percentage of micronuclei with histone PTMs in control (red bars) and lamin-B2-expressing (LMNB2; grey) MDA-MB-231 cells; *P < 0.05, **P < 0.01, ****P < 0.0001, two-sided t-test, n = 3; data represent mean ± s.d. g, Representative images of MDA-MB-231 cells with micronuclei stained for DNA (blue), H3K27ac (green) and nascent RNA (red). Violin plots show the z-score of ethynyluridine (EU) intensity; ****P < 0.0001, two-sided Mann–Whitney U-test, n = 3. Solid and dotted bars represent the median and quartiles, respectively. h, Representative fluorescence in situ hybridization (FISH) images of CEN-SELECT DLD-1 cells treated with DMSO (control, left) or Dox/IAA (right) stained for Y chromosome (red), DNA (blue) and H3K27ac (green). Violin plots show the H3K27ac immunofluorescence intensity of DLD-1 cells treated with either DMSO (control) or Dox/IAA; ****P < 0.0001, two-sided Kolmogorov-Smirnov test, n = 3. Scale bars, 2 µm (d), 5 µm (a and h) and 10 µm (g).
