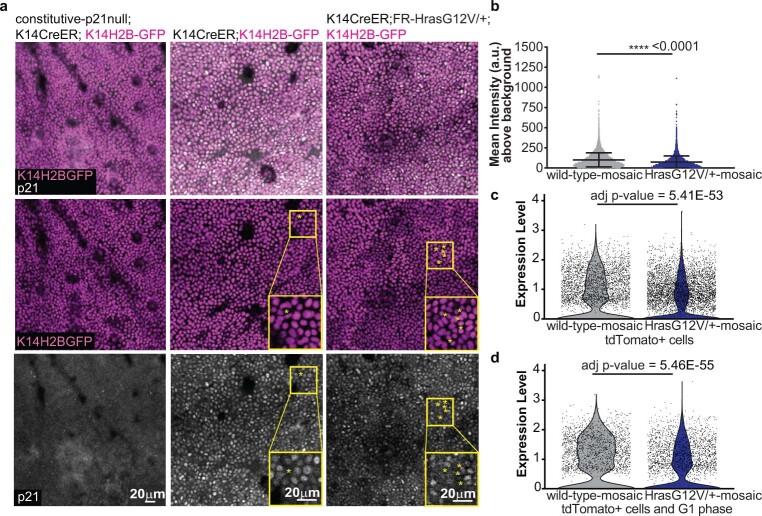
Extended Data Fig. 9. p21 expression is significantly reduced in HrasG12V/+-mosaic models.
a) Representative two-photon images of the epidermal preparation immunofluorescence for p21 (white) in constitutive-p21null (left), wild-type-mosaic (center) and HrasG12V/+-mosaic (right). The basal cells expressing K14H2B-GFP are marked in magenta. Representative images show both the overlay (top) and separate channels for K14H2B-GFP expression (middle) and p21 immunolabeling (bottom). *=mitotic cells negative for p21 (background signal). b) Quantification of p21 immunolabeling in the nucleus of the basal cells in wild-type-mosaic and HrasG12V/+-mosaic (n = 3 mice). Average of approximately 3,000 cells were analysed for each mouse. Unpaired, two-tailed t-test for the nuclear intensity of p21. Data are represented as means and standard deviations. c) p21 level quantification in the basal cells by using scRNA-seq datasets of wild-type-mosaic and HrasG12V/+-mosaic with the selection of only tdTomato+ cells. d) Same quantification as in c) but with the selection of non-cycling and tdTomato+ cells. (c, d) n = 3 mice. Statistics on scRNA-seq analysis of p21 expression is based on the non-parametric Wilcoxon rank sum test performed by the Seurat package62. Adjusted p-value is based on Bonferroni correction using all features in the dataset.

