

SUMMARY
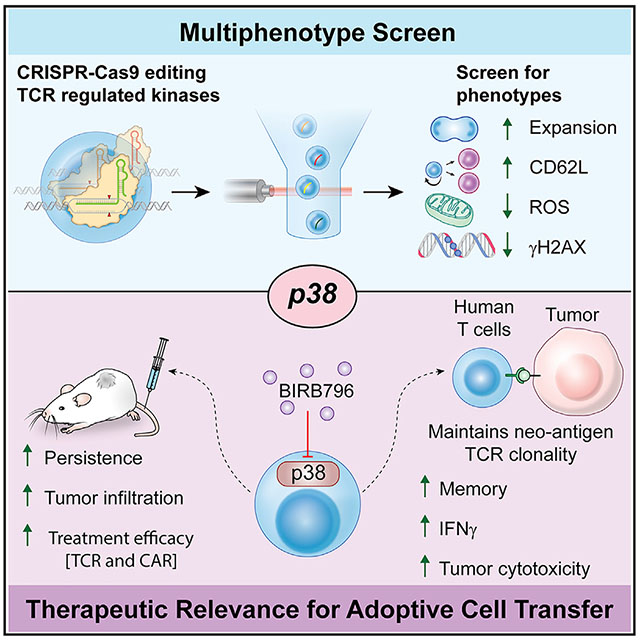
T cells are central to all currently effective cancer immunotherapies, but the characteristics defining therapeutically effective anti-tumor T cells have not been comprehensively elucidated. Here, we delineate four phenotypic qualities of effective anti-tumor T cells: cell expansion, differentiation, oxidative stress, and genomic stress. Using a CRISPR-Cas9-based genetic screen of primary T cells we measured the multi-phenotypic impact of disrupting 25 T cell receptor-driven kinases. We identified p38 kinase as a central regulator of all four phenotypes and uncovered transcriptional and antioxidant pathways regulated by p38 in T cells. Pharmacological inhibition of p38 improved the efficacy of mouse anti-tumor T cells and enhanced the functionalities of human tumor-reactive and gene-engineered T cells, paving the way for clinically relevant interventions.
Graphical Abstract
In Brief
Gurusamy et al. identify phenotypes of effective anti-tumor T cells and reveal p38 as a central regulator of therapeutically desired T cell characteristics in a multi-phenotype screen. Inhibition of p38 promotes effective T cell phenotypes and enhances the anti-tumor efficacy of adoptive T cell immunotherapies.
INTRODUCTION
Adoptive T cell transfer immunotherapy (ACT) using tumor-infiltrating lymphocytes (TIL) and gene-modified T cells can induce complete and durable regression of metastatic human malignancies that are otherwise refractory to treatment (Rosenberg and Restifo, 2015). Successful T cell-based treatment of multiple cancer histologies have been reported in recent years, but most patients with common epithelial cancers do not respond to treatment (Tran et al., 2017).
Efforts to obtain large numbers of T cells with qualities associated with anti-tumor success is the subject of intense study (Tang et al., 2018). The overall fitness of therapeutic T cells is multi-dimensional and includes factors related to the genome, mitochondria, and other cellular qualities. These factors can alter the expansion, differentiation, homing, persistence, and cytotoxicity of T cells that may ultimately affect the clinical outcome of ACT (Besser et al., 2013; Fraietta et al., 2018; Goff et al., 2016; Rosenberg et al., 2011).
T cell differentiation is often linked with cell expansion, and efforts to limit differentiation may therefore come at the expense of cellular proliferation (Crompton et al., 2014). Indeed, pharmacological interventions, such as glycogen synthase kinase-3β and Akt inhibition successfully increase the expression of memory T cell markers, while having a negative or neutral effect on T cell expansion, respectively (Crompton et al., 2015; Gattinoni et al., 2011; Klebanoff et al., 2017). This is particularly important for TIL-based ACT where such interventions could limit the expansion of T cell clones reactive against cancer neoantigens in the infusion products (Yamamoto et al., 2019). Using CRISPR-Cas9-based genetic screening, this study aims to identify molecular targets capable of enhancing multiple therapeutically effective anti-tumor qualities of T cells while also preserving neoantigen-specific clonotypes.
RESULTS
Selection and Validation of Phenotypes that Define Therapeutically Effective Anti-tumor T Cells
To characterize and validate the qualities of effective anti-tumor T cells for use in a multi-phenotype CRISPR-Cas9 screen of primary murine T cells, we identified phenotypes from the published literature using the following selection criteria: representative markers should have an association with T cell dysfunction in pre-clinical or clinical studies; markers must be measurable using a high-throughput single-cell assay to ensure adaptability, scalability, and reproducibility (Figure S1A). We initially selected three phenotypes—cell expansion, memorylike (stemness), and metabolic fitness—to use in these screens based on their association with clinical efficacy in ACT (Figure 1A).
Figure 1. Phenotype Selection and Validation for the Multi-phenotype CRISPR-Cas9 Genetic Screens.
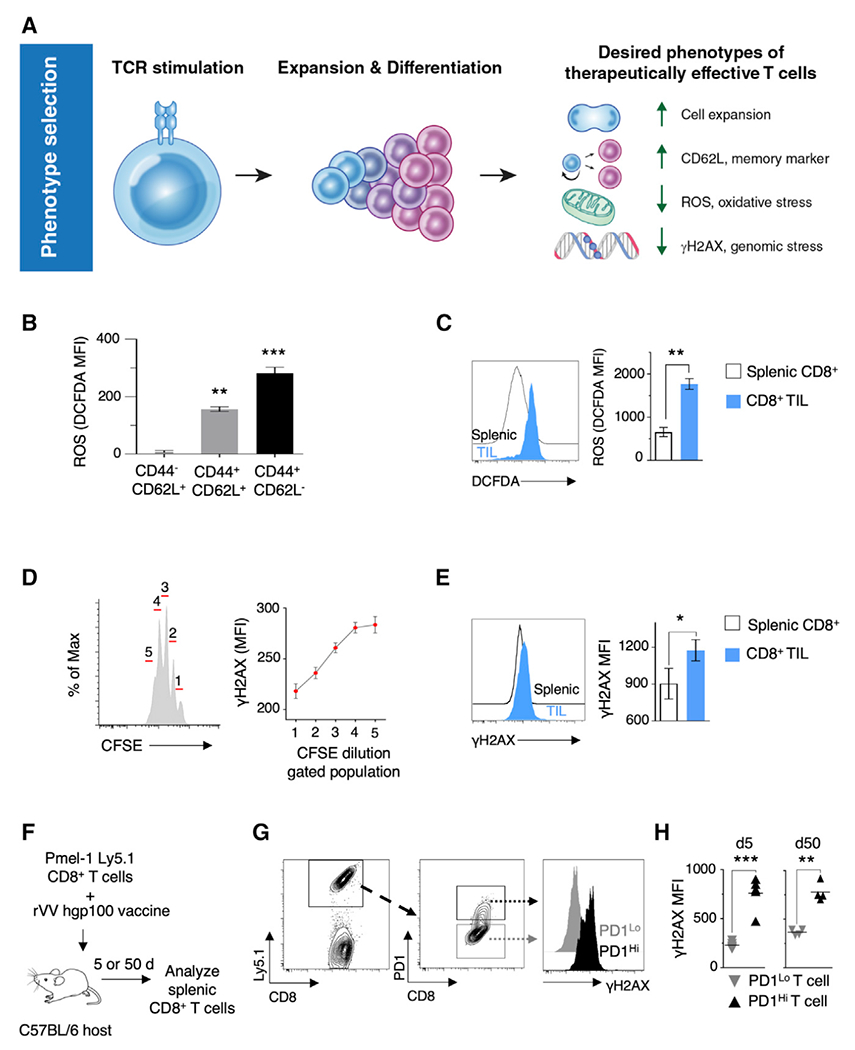
(A) Schematic of selected clinical and pre-clinical phenotypes of therapeutically effective T cells used in T cell-based adoptive immunotherapies.
(B) Fluorescence-activated cell sorting (FACS)-based quantification of total cellular ROS levels in different subsets of murine CD8+ T cells (n = 3).
(C) FACS-based quantification of total cellular ROS in T cells isolated on day 20 from spleens and tumors of Pmel-Thy1.1 host animals implanted subcutaneously with B16 melanoma tumors (n = 5 mice; data representative of ≥2 independent experiments).
(D) Quantification of γH2AX levels in populations of T cells that have undergone one to five cycles of cell-division after TCR stimulation in vitro (n = 3).
(E) FACS-based quantification of γH2AX in T cells isolated on day 20 from spleens and tumors of Pmel-Thy1.1 hosts implanted subcutaneously with B16 melanoma tumors (n = 5 mice; data are representative of ≥2 independent experiments).
(F) Schematic diagram of methodology for the measurement of γH2AX levels in CD8+ T cells post adoptive transfer and rVV hgp100 challenge.
(G) FACS plots showing the gating strategy for determining γH2AX levels in PD1Lo and PD1Hi T cells.
(H) Scatterplots showing FACS-based quantification of γH2AX levels in PD1Lo and PD1Hi T cells expanded in vivo upon viral challenge with cognate antigen hgp100 for 5 or 50 days (n = 4 mice).
Data represented as mean ± SEM. (C, E, and H) Significance assessed using paired t test statistic. *p < 0.05, **p < 0.01, ***p < 0.001. See also Figure S1.
Cell counts were included in our screen as a phenotypic readout (Figure 1A). Cell expansion is relevant given the reported clinical associations between increased T cell numbers in ACT infusion products and treatment efficacy (Besser et al., 2013; Goff et al., 2016; Klebanoff et al., 2011). A stem cell-like memory phenotype, characterized by expression of L-selectin (CD62L), was chosen as the second phenotype (Figure 1A). Cells possessing a T cell memory-like phenotype were associated with enhanced ability to engraft and persist longer in clinical studies (Fraietta et al., 2018; Gattinoni et al., 2011; Rosenberg et al., 2011).
Metabolic fitness of T cells can be a predictor of clinical effectiveness (Fraietta et al., 2018). Reactive oxygen species (ROS), a byproduct of cellular metabolism, plays a significant role in T cell biology. While low levels of ROS are required for T cell activation and antigen-specific proliferation (Sena et al., 2013), high ROS levels lead to cell death and attenuated proliferation (Kesarwani et al., 2013). The use of antioxidants during ex vivo T cell expansion has been reported to promote a more potent anti-tumor immune response in mouse models of ACT (Eylar et al., 1993; Pilipow et al., 2018; Scheffel et al., 2018). We measured ROS using DCFDA (2′,7′-dichlorofluorescein diacetate) after staining for CD62L and CD44, markers of lymphocyte activation, in T cells expanded for 5 days in vitro (Figure 1B). We observed an increase in ROS in differentiated effector memory T cells (TEM) (CD44+ CD62L−) compared with less-differentiated central memory (TCM) (CD44+ CD62L+) and naive cells (CD44− CD62L+), showing association of higher ROS levels with effector differentiation. We next examined the levels of ROS in tumor-infiltrating CD8+ T cells (Figure S1B). We observed that intratumoral CD8+ T cells had significantly increased levels of ROS compared with splenic T cells (Figure 1C). Given these associations of ROS with T cell differentiation and dysfunction in tumors, ROS was selected as the third phenotypic readout (Figure 1A).
The extent of DNA damage (genomic stress) in T cells used for ACT remains poorly studied. Nevertheless, an indirect association of genomic stress with T cell persistence has been observed (Liu et al., 2018; Rosenberg et al., 2011; Sukumar et al., 2016). We sought to quantify genomic stress in T cells via flow-based measurement of phosphorylation of serine 139 on H2AX (γH2AX) (Rogakou et al., 1998). To investigate if γH2AX levels were associated with cell division, we measured γH2AX levels in CFSE-labeled in-vitro-cultured Pmel T cell receptor (TCR) transgenic T cells. A stepwise increment in γH2AX levels was observed with successive cycles of cell replication (Figure 1D), indicating an intrinsic link between genomic stress and T cell expansion. We also investigated the levels of DNA damage in intratumoral CD8+ T cells, and observed significantly increased levels of γH2AX compared with splenic T cells (Figures 1E and S1B). Furthermore, assessment of DNA damage in T cells that were expanded in vivo after adoptive transfer and a vaccine challenge indicated a significant increase in γH2AX levels in PD1Hi T cells compared with PD1Lo T cells 5 and 50 days post transfer (Figures 1F–1H). Furthermore, analysis of the non-proliferating Ki67Lo T cell compartment of splenocytes from vaccinated Pmel transgenic animals indicated significantly higher γH2AX levels in PDHi T cells compared with PD1Lo T cells (Figures S1C and S1D). These data suggest that DNA damage, as marked by γH2AX, is high in non-proliferating PD1Hi T cells.
To determine if genomic stress was associated with T cell dysfunction, we interrogated the expression of the DNA damage response genes (DDRs) using a previously published gene expression dataset of dysfunctional TIL (Singer et al., 2016). Elevated expression of PD1 and Tim3 is a well-characterized feature of dysfunctional and exhausted TIL (Singer et al., 2016). Compared with naive T cells, 17% (29 out of 167) of DDR transcripts were differentially expressed in PD1HiTim3Hi TIL (Figure S1E). The most significantly upregulated 12 genes in PD1Hi−Tim3Hi TIL (>2-fold) included genes known to protect cells against oxidative DNA damage (Figures S1F and S1G). These data suggest dysfunctional TIL actively engage DDR pathways to deal with oxidative stress and DNA damage. Finding gene regulators that can minimize genomic stress during ex vivo T cell culturing while allowing for cellular expansion would likely benefit ACT. Given these observations, we included low γH2AX levels as the fourth phenotypic readout in our screen (Figure 1A).
Multi-phenotype CRISPR-Cas9 Genetic Screen
Following selection of phenotypes, we designed an arrayed CRISPR-Cas9-based gene perturbation screen to concurrently evaluate CRISPR-modified T cells for multiple phenotypes (Figure 2A). We optimized CRISPR-Cas9-mediated gene knockout (KO) efficiency in primary mouse T cells by using single-guide RNAs (sgRNAs) targeting B2m. Primary naive or total splenic CD8+ T cells were stimulated for 24 h and then electroporated with Cas9 nuclease complexed with modified sgRNAs and evaluated by flow cytometry (Figure S2A). We achieved efficiencies of up to 90% functional β2m KO as measured by the loss of major histocompatibility complex (MHC) class I molecules on the cell surface after 5 days of culture (Figure S2B). An ~75% KO efficiency was maintained after a 10-day culture period (Figure S2C). In naive T cells, a high KO efficiency of >50% was observed for multiple sgRNAs (Figure S2D).
Figure 2. Multi-phenotype CRISPR-Cas9 Genetic Screens Identify p38 Kinase as a Regulator of Desired Phenotypes in T Cells.
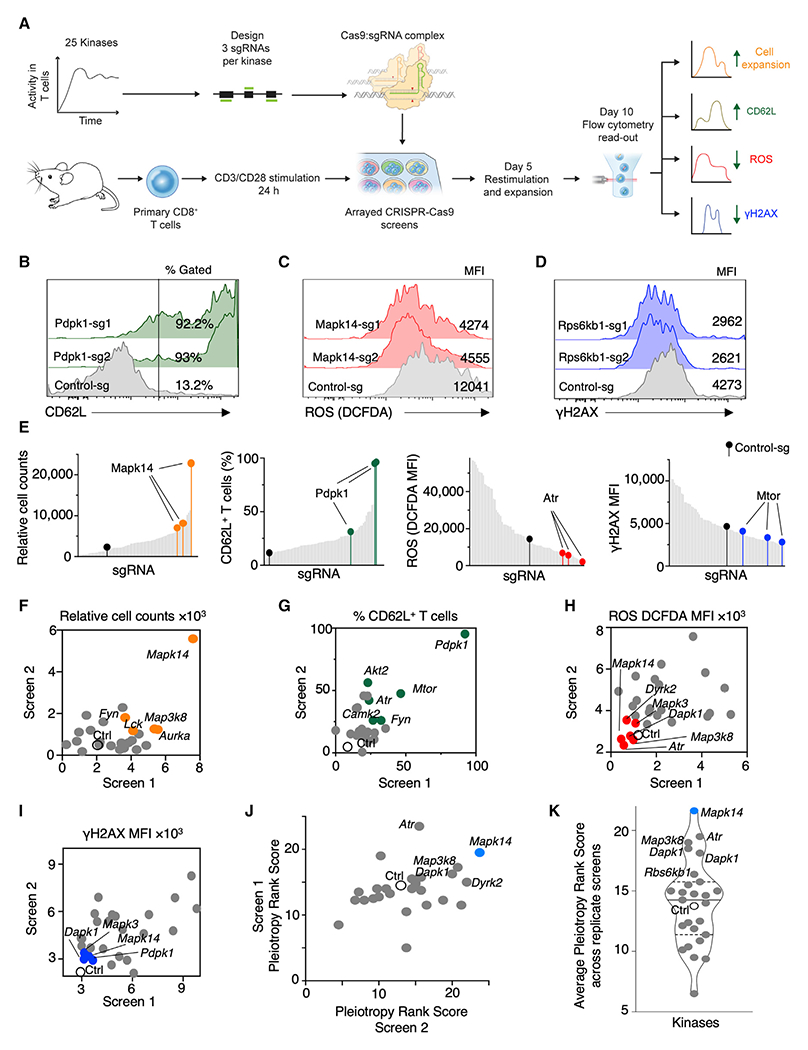
(A) Schematic of multi-phenotype CRISPR-Cas9 screens performed in an arrayed format on primary T cells.
(B–D) Representative FACS histograms of the top-ranked genes for increased CD62L expression (B) or decreased levels of ROS (C) and γH2AX (D) from a replicate screen after second-best guide RNA metric-based ranking.
(E) Histograms showing the ranking of sgRNAs in the phenotypic assays for cell expansion, CD62L expression, ROS, and DNA damage phenotypes. Multiple sgRNAs targeting Mapk14, Pdpk1, Atr, and Mtor are indicated.
(F–I) Scatterplots showing overlap of the kinases modulating cell expansion (F), CD62L expression (G), ROS levels (H), and γH2AX (I) across replicate screens. The median value of the phenotypic readout from the three sgRNAs for a gene is plotted across replicate screens. Open circles denote control guide, and the colored circles denote top-ranked kinases for the phenotype based on the second-best guide metric.
(J) Scatterplot representing the “pleiotropic rank score” of each kinase across replicate CRISPR-Cas9 screens.
(K) Violin plot showing average pleiotropic rank score across replicate screens. Solid line represents the median, and the dashed lines represent quartiles of the distribution. See also Figure S2 and Tables S1 and S2.
We targeted kinases in our CRISPR-Cas9 screens due to their established druggability and the clinical safety profile (Ferguson and Gray, 2018). We selected 25 kinases (Table S1; Figure 2A), shown to have sustained kinase activity in T cells after TCR stimulation, as measured by global phosphoproteome analysis (Tan et al., 2017). We targeted exonic regions of kinase-encoding genes in primary T cells using three sgRNAs per gene in an arrayed CRISPR-Cas9 screen and assayed for increased cell expansion and CD62L expression along with decreased levels of ROS and γH2AX (Figures 2A–2D).
To elucidate the effects of targeting each kinase with Cas9-sgRNA complexes on individual phenotypes, we generated a ranked list of all the values for every phenotype. Figure 2E shows the placement of the three sgRNAs targeting a gene within an analyzed phenotype. For example, all three sgRNAs targeting Mapk14 led to improved CD8+ T cell expansion (Figure 2E). The expressions of CD62L, ROS, and γH2AX were evaluated by fluorescence-activated cell sorting in the same fashion across replicate screens (Figures 2B–2E and S2E–S2H).
We analyzed the data using a second-best-sgRNA rank metric (Patel et al., 2017), resulting in ranked lists of individual kinases for each desired phenotype (Table S2). To reduce false discovery rates, we computed the overlap between the top 10 ranked genes for each phenotype from the two independent screens (Figures 2F–2I). Multiple genes repeatedly demonstrated the desired effects on each phenotype. Thus, using multi-phenotype CRISPR-Cas9 genetic screens, we identified roles for multiple kinases in affecting therapeutically relevant T cell phenotypes.
Multi-phenotype readouts are valuable to identify the effect of a single gene KO on different T cell properties. To visualize these effects, we generated a heatmap of the phenotype rank score for each of the analyzed phenotypes from the two replicate screens (Figure S2I). The importance of the multi-phenotype analysis is illustrated with the examples of sgRNAs targeting Pdpk1 (encoding PDPK1) and Mtor (encoding mammalian target of rapamycin [MTOR]), both genes with important roles in CD8+ T cell signaling. While KO of either Pdpk1 or Mtor ranked high for CD62L and γH2AX, neither kinase ranked high for cell proliferation or ROS (Figure S2I). To identify a target that can positively impact all four desired T cell characteristics, we computed a pleiotropy rank score where each phenotype was allocated equal weight. Based on the pleiotropic rank score from two independent screens, we identified Mapk14 encoding p38α kinase as a unique modulator of all desired phenotypes (Figures 2J, 2K, and S2E–S2H; Table S2). Collectively, these findings demonstrate that kinase targets regulating single or multiple cellular phenotypes could be identified using a multi-phenotype CRISPR-Cas9 screen.
Genetic and Pharmacological Validation of p38 as a Target in T Cells
To validate Mapk14, we designed an independent sgRNA, Mapk14-sg4, not included in the screen (Figure 3A). Protein analysis of Mapk14 KO cells obtained in the CRISPR-Cas9 screen confirmed efficient reduction of MAPK14 levels (Figure S3A). Intracellular flow cytometry analyses on cells that were CRISPR-Cas9 edited using Mapk14-sg4 confirmed the efficiency of this independent sgRNA (Figure S3B). Mapk14 KO cells exhibited an increase in cell expansion and CD62L expression (Figures 3B and 3C) and a decrease in ROS and γH2AX accumulation in T cells (Figures 3D–3E), validating our screen results.
Figure 3. Genetic and Pharmacological Validation of p38 Kinase as a Target to Augment Desired Phenotypes during Mouse T Cell Expansion.
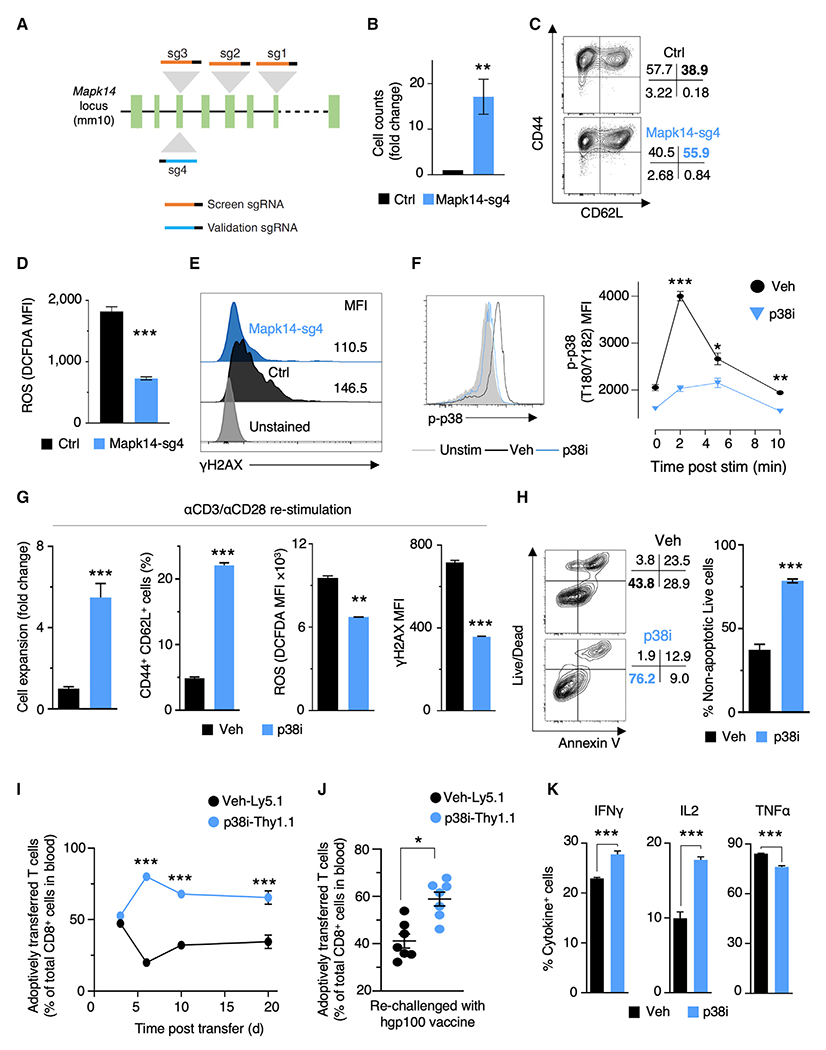
(A) Illustration of sgRNAs targeting different exons of Mapk14 used in CRISPR screens and validation experiments.
(B) Relative cell counts of control and Mapk14-sg4 cells expanded for 10 days (n = 2).
(C) Representative FACS plot showing the frequencies of TCM (CD44+CD62L+) and TEM (CD44+CD62L−) cells in control and Mapk14-sg4 T cells expanded for 10 days.
(D) Bar plots showing levels of ROS in control and Mapk14-sg4 T cells expanded for 10 days (n = 2).
(E) Representative FACS histogram of γH2AX levels in control and Mapk14-sg4 T cells expanded for 10 days.
(F) Representative FACS plot and quantification (n = 3) of p38 phosphorylation at residues T180/Y182 at specific time points after CD3ε stimulation with or without pharmacologic inhibition of p38 with 500 nM BIRB796 (p38i). Gray shading: unstimulated T cells.
(G) Bar plots showing cell expansion, TCM population, ROS, and γH2AX levels in T cells expanded for 10 days after TCR restimulation in the presence or absence of p38i (n = 3).
(H) Representative FACS plot and quantification (n = 3) of apoptosis and cell death of T cells expanded for 10 days with or without p38i.
(I and J) Analysis of in vivo peripheral expansion of CD8+ T cells expanded in vitro with (p38i-Thy1.1) or without (vehicle-Ly5.1) p38i for 10 days. The ratio of persisting cells in the peripheral blood was measured by FACS at multiple time points after initial challenge with recombinant vaccinia virus encoding hgp100 (n = 9 mice) (I). Mice that had received congenically marked cells were re-challenged with recombinant adenovirus encoding hgp100 (J). FACS-based analysis of in vivo peripheral expansion of CD8+ T cells at day 5 post re-challenge (n = 7).
(K) FACS-based measurement of intracellular IFNγ, IL2, and TNFα in murine CD8+ T cells. p38i was washed out from the culture media after 10 days of expansion, followed by 5 h stimulation with plate-bound αCD3/αCD28 in the presence of brefeldin and monensin to measure intracellular cytokine levels (n = 3).
Data are represented as mean ± SEM. Statistical significance was determined using unpaired t tests (B, D, G, H, and K), two-way ANOVA with multiple comparisons (F and I), and paired t test (J). *p < 0.05, **p < 0.01, ***p < 0.001, ****p < 0.0001. Data are representative of ≥2 independent experiments. See also Figure S3.
We then attempted to mimic the phenotypic effects of genetic KO of Mapk14 in a reversible manner using a clinically relevant small-molecule inhibitor. Doramapimod (BIRB796, hereafter referred to as p38i) is a clinically used inhibitor that selectively inhibits all isoforms of p38 (Kuma et al., 2005; Lanna et al., 2014). Its reversibility confines inhibition of p38 to in vitro expansion, thus avoiding any long-term functional loss of p38 after in vivo transfer. In murine T cells, p38i significantly repressed activation of both acute and long-term signaling of p38 (Figures 3F and S3C). This inhibition had minimal effects on TCR stimulation-induced Akt phosphorylation and downstream activation of S6 and Erk1/2 kinases (Figures S3D–S3G). Thus, specific p38 inhibition could be accomplished using p38i.
To test whether p38i replicates Mapk14 KO, we expanded cells in the presence of p38i for 5 days and followed changes in cell counts, γH2AX levels, and TCM cell population. Inhibition of p38 activity resulted in improved cell yields in a dose-dependent manner (Figure S3H), reduced DNA damage (Figure S3I), and increased TCM population (Figure S3J). To understand the relationship between p38 activity and DNA damage in T cells, we measured phosphorylation levels of p38 in T cells expanded for 5 days. We observed that γH2AXHi T cells contained significantly more phospho-p38 levels than γH2AXLo T cells (Figure S3K), indicating the association of p38 kinase activity with DNA damage. An additional TCR stimulation on day 5 and the expansion of T cells for 10 days total in the presence of p38i enhanced all four desired phenotypes (Figure 3G). Thus, pharmacological inhibition of p38 effectively enhanced desired T cell phenotypes, mimicking results of p38 KO.
p38 is activated in responses to stimuli, such as DNA damage and oxidative stress, and can affect cellular proliferation and apoptosis (Cuenda and Rousseau, 2007). To identify the mechanism by which p38i improves cell expansion, we assessed the extent of cell proliferation and cell death. No appreciable difference was observed in T cell proliferation between vehicle and p38i cultures (Figure S3L). However, a significant decrease in apoptosis and cell death was observed after culture with p38i (Figures S3M and 3H). Taken together, the addition of p38i improved absolute cell number by decreasing overall cellular apoptosis and death.
To ensure that inhibition of p38 activity is confined to the duration of the in vitro exposure, we characterized the reversibility of p38 inhibition in T cells. We added p38i either during the first or secondary stimulation of Pmel T cells and assessed their differentiation state after 10 days in culture. p38 inhibition, either during the first or second stimulation, showed a limited increase in the TCM and TCF7+ cell populations, compared with the significant improvement observed with continuous administration (Figures S3N and S3O). Similarly, ROS levels were significantly reduced only following continuous p38i exposure compared with the other tested conditions (Figure S3P). These results suggest that the effects of p38 inhibition are more pronounced with continuous p38i addition during ex vivo expansion.
To determine the long-term functional effects of p38i on T cell function after in vivo transfer, we assessed the in vivo expansion and persistence of T cells cultured with p38i. After washout of p38i from T cells, we transferred equivalent numbers of congenically marked vehicle- or p38i-treated cells to congenically marked C57BL/6 mice (Figure S3Q). T cells exposed to p38i during ex vivo expansion had better expansion and persistence upon primary challenge with cognate hgp100 antigen in vivo (Figures 3I and S3R). A 1.5-fold expansion of p38i-cultured cells was observed upon secondary challenge compared with vehicle (Figures 3J and S3R). In agreement with the findings of the screen, T cells cultured with p38i demonstrated superior expansion and persistence in vivo post adoptive transfer.
Irreversible p38 inhibition is reported to attenuate T cell effector function and secretion of inflammatory cytokines. We tested if we could restore or improve effector cytokine production upon removal of p38i from T cell cultures. T cells expanded under p38i conditions followed by inhibitor washout and stimulation in the absence of p38i demonstrated enhanced production of interferon-γ (IFNγ) and interleukin-2 (IL2) with a mild diminution in tumor necrosis factor alpha (TNFα) production (Figure 3K). Collectively, these results suggest that p38 inhibition in ex vivo cultures improved therapeutically desired characteristics of murine CD8+ T cells.
p38 Blockade Improves T Cell Fitness via Metabolic and Transcriptional Alterations
To gain insight into the metabolic impact of p38i, we performed liquid chromatography-tandem mass spectrometry-based global metabolome analysis. This analysis captured a total of 381 metabolites, of which 51 were significantly altered in p38i-cultured T cells (p < 0.05, Figure 4A; Table S3). We observed that p38i-cultured T cells had reduced levels of linoleic acid oxidation products, 9-hydroxyoctadecadienoic acid (HODE) and 13-HODE, and oxidized glutathione (GSSG) (Figures 4B and 4C). These findings suggest that p38 inhibition affects ROS levels by targeting multiple cellular redox homeostasis pathways.
Figure 4. p38 Kinase Drives Oxidative and Genomic Stress via Distinct Transcriptional and Metabolic Alterations.
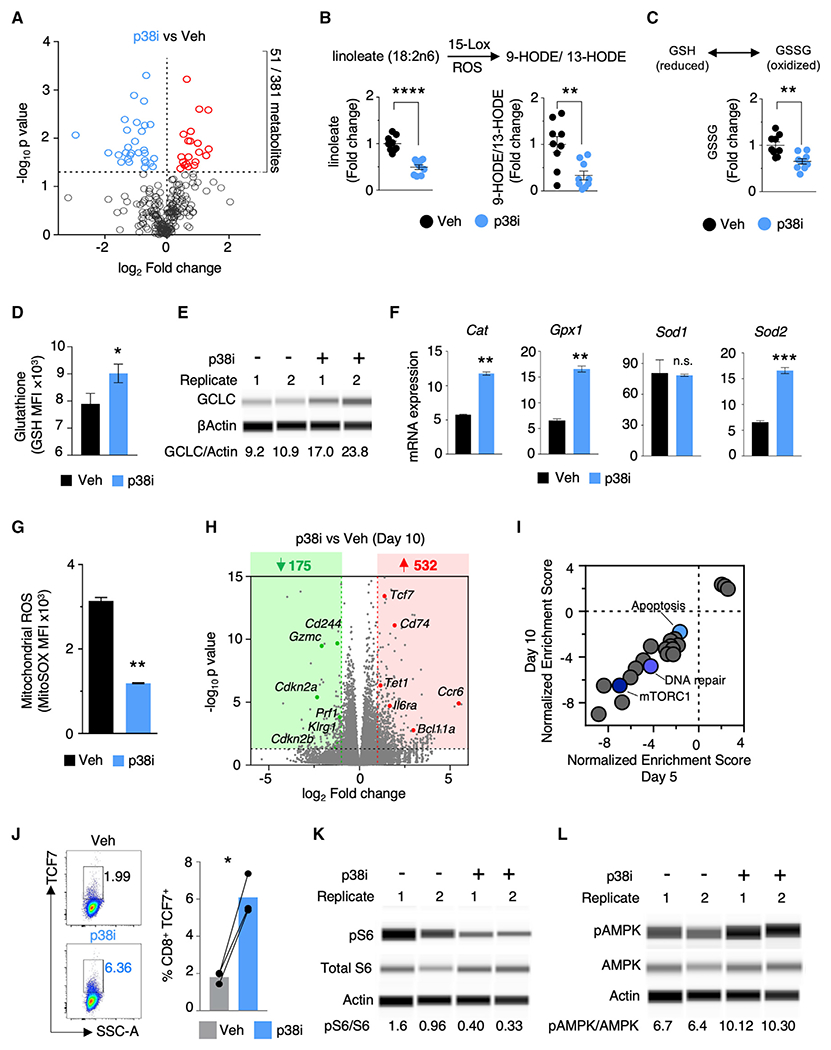
(A) Volcano plot depicting global profile of metabolites in T cells expanded for 5 days with or without p38i. The horizontal line marks p value cut off < 0.05.
(B and C) Liquid chromatography-tandem mass spectrometry-based quantification of linoleic acid oxidation products (B) and oxidized glutathione (C) in T cells treated with vehicle or p38i (n = 3).
(D) Quantification of glutathione levels 5 h after TCR stimulation in T cells expanded for 5 days with or without p38i (n = 3).
(E) Protein analysis of the rate-limiting enzyme of glutathione synthesis, gamma-glutamylcysteine synthetase (GCLC), in T cells expanded for 5 days with or without p38i. Densitometric ratios (×100) of GCLC to β-actin levels are reported below each lane. Data shown from two biological replicates.
(F) RT-PCR analysis of the induction of mRNA expression of antioxidant gene expression 5 h after TCR stimulation in T cells primed and expanded under p38i or vehicle for 5 days (n = 2).
(G) FACS-based quantification of levels of mitochondrial ROS using MitoSOX dye in T cells expanded with or without p38i (n = 3).
(H) Volcano plot showing differentially expressed genes (DEGs) (cutoff >2-fold change, p < 0.05) in T cells expanded for 10 days with or without p38i. n = 3 biological replicates.
(I) GSEA of ranked DEGs (p38i/vehicle) using MSigDB Hallmark collections (Broad Institute) in T cells cultured for 5 or 10 days with or without p38i (false discovery rate cutoff < 0.05); blue circles identify signatures of interest.
(J) Representative FACS and bar plots representing quantification of TCF7 expression in T cells expanded under p38i or vehicle for 10 days (n = 3).
(K and L) Protein analysis of phosphorylated S6 (K) and AMPK (L) in T cells expanded for 5 days with or without p38i. Densitometric ratios (×100) of phosphorylated protein to total protein levels are reported below each lane.
Data are represented as mean ± SEM. Significance assessed by unpaired t test (B, C, F, and G) and paired t test (D and J). *p < 0.05, **p < 0.01, ***p < 0.001, ****p < 0.0001. Data are representative of ≥2 independent experiments. See also Figure S4 and Tables S3, S4, S5, and S6.
We studied the influence of p38 on the glutathione pathway, which is necessary for buffering cellular ROS levels. p38 inhibition increased the intracellular levels of glutathione (Figure 4D), suggesting that p38 activity could be restricting GSH production in T cells. This view was further supported when p38i increased the expression of γ-glutamylcysteine synthetase, a rate-limiting enzyme for glutathione synthesis (Figure 4E). These results collectively propose an important role of p38 in regulating T cell glutathione metabolism.
To explore the influence of p38i more broadly on antioxidant gene expression programs, we measured gene expression of the antioxidant enzymes catalase (Cat), glutathione peroxidase (Gpx1), and superoxide dismutases (Sod1 and Sod2) (Figure 4F). After T cell stimulation under p38i conditions, we observed significant increases in Cat, Gpx1, and Sod2 expression, but not Sod1. These results suggest that T cells cultured with p38i can better regulate intracellular ROS levels through the genetic control of antioxidant enzymes. p38i also decreased mitochondrial ROS levels as determined using MitoSOX (Figure 4G). Collectively, these results implicate p38 in the regulation of ROS and redox metabolism in T cells.
To capture the transcriptional programs regulated by p38, we performed RNA sequencing on T cells cultured for 5 and 10 days in the presence or absence of p38i. Genes involved in effector differentiation, including Eomes, Klrg1, Prf1, Havcr2, Cdkn2a, Gzmc, and Gzmd, were significantly downregulated in p38i cultures, while genes associated with a memory phenotype, such as Tcf7, Cd74, Il6ra, Gata2, Ccr6, and Bcl11a were significantly upregulated (p < 0.05; fold change > 2, Figures 4H and S4A; Table S4). Gene set enrichment analysis (GSEA) on the total transcriptome showed enrichment of downregulated genes pertaining to several pathways, including DNA damage (Figure 4I; Table S5), which is consistent with our observation of reduced levels of γH2AX in the multi-phenotype screen. Consistent with RNA expression, p38i-treated cells had a significantly higher frequency of TCF7-expressing cells compared with controls (Figure 4J). Furthermore, GSEA of the immunological C7 signature identified several enriched gene sets related to a more memory-like differentiation state of p38i-cultured T cells compared with vehicle (Table S6).
The global transcriptome analysis also revealed an enrichment of genes downregulated in the mTORC1 pathway in p38i-treated cells (Figure 4I). In addition, phosphorylated S6 was significantly downregulated, while phosphorylated AMPK was increased, in p38i-treated cells (Figures 4K, 4L, S4B, and S4C). These results suggest restrained mTOR activity, the inhibition of which has been shown to promote a memory-like T cell phenotype by others and in our multi-phenotype screen (Araki et al., 2009; Rolf et al., 2013). Given that memory T cells have increased mitochondrial respiratory capacity (van der Windt et al., 2012), we measured the oxygen consumption rate (Figure S4D). An increase in basal oxygen consumption, as well as an increase in maximal respiration, was observed in T cells cultured in the presence of p38i compared with vehicle-treated cells. This was further corroborated by decreased levels of tricarboxylic acid cycle (TCA) metabolites, such as succinate and α-ketoglutarate, in our global metabolomic analysis (Figure S4E). Combined, these results suggest that p38i enhances the memory-like characteristics of T cells at both the transcriptional and metabolic levels.
To study the glycolytic potential of T cells cultured under p38i, we first measured the extracellular acidification rate (ECAR) (Figure S4F). p38i cells favored high glycolysis, as seen by the rapid increase in ECAR upon glucose injection. Data from our metabolomics assay also showed a significant drop in the levels of glucose (Figure S4G), suggestive of increased glucose flux to the glycolytic pathway. We also observed an increase in the uptake of glucose by T cells confirmed by two measurements: increased expression of Slc2a1 (Figure S4H), encoding glucose transporter Glut1, and increased uptake of a fluorescent glucose analog, 2-NBDG (Figure S4I). No appreciable difference in the expression levels of Cpt1a, a mitochondrial outer membrane fatty acid transporter, was observed (Figure S4H). Taken together, these observations indicate that T cells expanded under p38i display a unique metabolic profile where both glycolysis and oxidative phosphorylation capacity were augmented.
Pharmacological Inhibition of p38 on Human PBMC and TIL
To investigate if the benefits of inhibiting p38 extended to human T cells, we expanded CD8+ T cells and bulk lymphocytes from healthy donor peripheral blood mononuclear cells (PBMC) in the presence and absence of p38i (Figure 5A). p38i was effective in blocking the phosphorylation of Thr180 and Tyr182 in human cultures (Figure S5A), and significantly increased CD8+ T cell expansion (Figure 5B). Despite the minimal effect observed in the frequency of CD62L+ cells, a significant increase in the absolute number of CD62L+ and CD27+ cells was observed in p38i cultures (Figure 5C). Furthermore, CD8+ T cells expanded with p38i had significantly reduced levels of mitochondrial ROS (Figure 5D). These results demonstrate that p38 inhibition during human CD8+ T cell expansion improves their capacity for cell expansion while preserving memory marker expression and decreasing mitochondrial oxidative stress.
Figure 5. p38 Inhibition Enhances Desired Properties in Human PBMC and TIL for Adoptive Transfer.
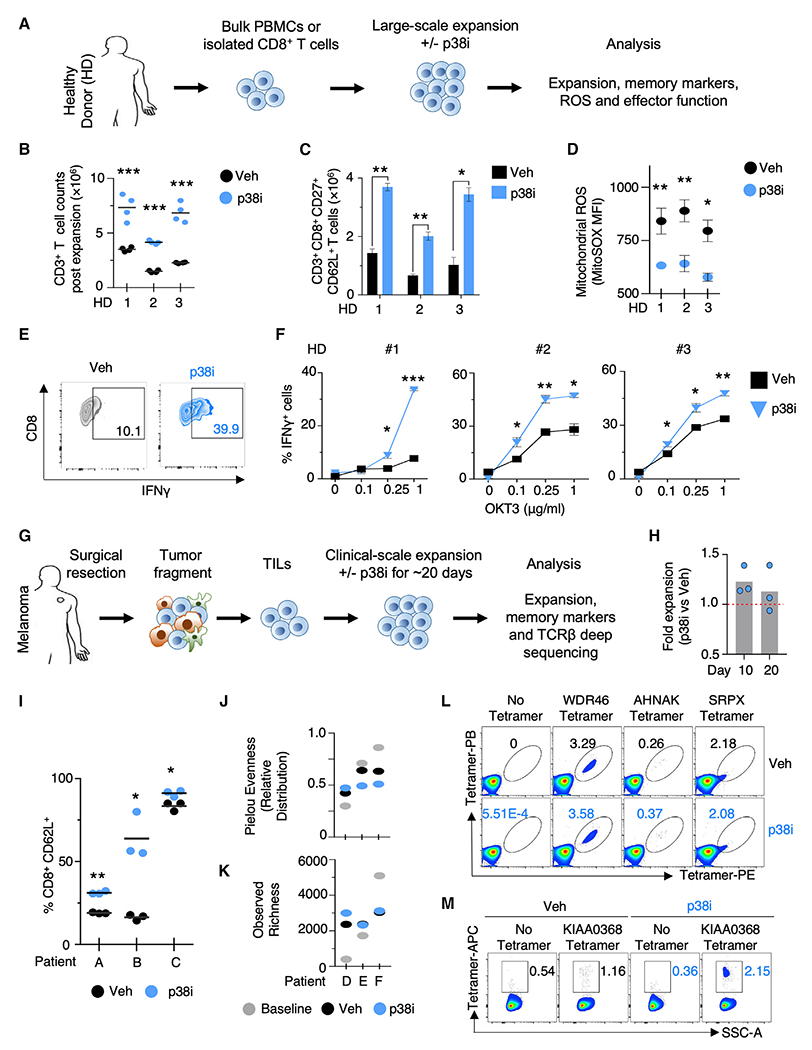
(A) Schema of phenotypic analyses on isolated CD8+ T cells or bulk PBMC from healthy donors (HD) expanded at large scale under p38i.
(B and C) Number of total human CD3+ T cells (B) and CD8+CD27+CD62L+ cells (C) after stimulation with αCD3/αCD28 and in vitro expansion for 27 days with or without p38i from 3 HD (n = 4 replicates).
(D) FACS-based quantification of levels of mitochondrial ROS in human CD8+ T cells using MitoSOX dye post expansion with or without p38i from 3 HD (n = 4). (E and F) Representative FACS plot (1 μg/mL αCD3 antibody; OKT3) (E) and quantification of IFNγ production after OKT3 stimulation in CD8+ T cells expanded ex vivo at clinical scale with or without p38i (F). Data from three HD are plotted individually (n = 4).
(G) Schema of the clinical expansion of human melanoma TIL with or without p38i.
(H) Number of total cells in TIL post clinical scale expansion for 10 and 20 days with or without p38i.
(I) FACS-based quantification of CD62L+ T cells in TIL post clinical scale expansion for 20 days with or without p38i.
(J and K) TCR Vβ CDR3 deep sequencing of patient TIL after clinical scale expansion for 20 days with or without p38i was analyzed using Pielou’s evenness (also known as the Shannon equitability) metric (J) and observed richness of TCR rearrangements (K).
(L) FACS plots from patient 3713 melanoma TIL showing tetramer staining for known neoantigen-specific reactive T cells using the indicated phycoerythrin (PE)- and Pacific blue (PB)-labeled tetramers in cells expanded for 10 days with or without p38i. The frequency of tetramer double-positive cells post expansion is indicated.
(M) FACS plot from patient 4136 Breast TIL showing the APC-tetramer staining for mutant KIAA0368-reactive CD8+ T cells expanded with or without p38i for 10 days.
Data are represented as mean ± SEM. Significance assessed by multiple t tests (C, D, and I), two-way ANOVA with multiple comparisons (F). *p < 0.05, **p < 0.01, ***p < 0.001. Data are representative of ≥ 2 independent experiments. See also Figure S5 and Table S7.
Current clinical protocols of ACT involve the bulk infusion of both CD4+ and CD8+ T cell populations (Hinrichs and Rosenberg, 2014). Given this, we investigated the effect of p38i on the expansion and memory phenotype of bulk cultures containing both CD8+ and CD4+ T cells (Figure 5A). Consistent with results from CD8+ T cell-exclusive cultures, p38i was effective in blocking the phosphorylation of Thr180 and Tyr182 in both CD4+ and CD8+ T cells in bulk cultures (Figure S5B), and promoted the significant expansion of CD3+ T cells (Figure S5C). Specifically, we observed significant increases to CD8+ T cell numbers and a trend toward increased CD4+ T cell numbers (Figures S5D and S5E). Furthermore, the number of CD62L+ CD27+ cells was significantly increased in CD3+ T cells in p38i cultures, a result attributed to the CD8+ T cell subset (Figures S5F–S5H). Collectively, the findings from healthy donor cultures indicate that addition of p38i during large-scale expansion specifically benefits the CD8+ T cell population, with regard to improved cell yield and expansion of a memory-like subset. The limited benefit of p38i on the expansion and memory phenotypes of CD4+ T cells suggests p38 signaling might have a differential role in phenotypic regulation in CD8+ versus CD4+ T cells.
To further interrogate the biology of p38 inhibition in bulk T cells, we stimulated and expanded PBMC using a clinical scale rapid expansion protocol (REP) in the presence of p38i for 20 days (Dudley et al., 2003). Inhibition of p38 signaling reduced levels of ROS (Figure S5I) and resulted in higher amounts of IFNγ upon TCR stimulation (Figures 5E and 5F). The ability of p38i to reduce ROS levels, along with the ability to increase IFNγ expression in human T cells, may prove valuable for clinical protocols involving genetic engineering of human PBMC for ACT.
We next investigated if inhibition of p38 can improve cellular expansion and memory phenotypes of human TIL. Human TIL from melanoma patients were cultured for 20 days with or without p38i using the high-dose IL2 REP protocol to mimic current clinical protocols (Figure 5G) (Dudley et al., 2003). The large-scale expansion of TIL was not inhibited by p38i (Figure 5H), and p38i significantly increased CD62L expression (Figure 5I).
The success of immunotherapy in patients with melanoma has been linked to TCR clonal diversity (Gros et al., 2016; Postow et al., 2015). We thus evaluated the influence of p38i on TCR clonal diversity in TIL cultures using immunosequencing of the variable TCR-β chain region. To measure the clonal diversity, we computed “Pielou’s evenness index” metric, which measures how uniformly TCR rearrangements are distributed (Figure 5J), and the “Richness” metric, which represents the total number of unique TCR rearrangements (Figure 5K). Pielou’s evenness index values range from 0 to 1, and values near 1 indicate that every TCR rearrangement is present at nearly identical frequency, whereas values near 0 indicate a skewed distribution. No systematic or significant differences in TCRVβ CDR3 Richness or Pielou’s evenness metrics were observed between the vehicle and p38i cultures (Figures 5J and 5K). More importantly, we did not find significant differences in overall productive TCR diversity measured either using the Morisita-Horn index (Table S7), which represents the overlap between baseline TCR versus vehicle or p38i, or by using Pearson product-moment correlation coefficient analysis (r2) (Figure S5J), a measure of the linear correlation of the frequencies of all sequences shared in the two samples.
We further tested the effect of p38i on clonal diversity by explicitly measuring the expansion of known tumor neoantigen-reactive T cells. TIL from melanoma patient ID 3713 have three unique neoantigen reactivities, as described previously (Cohen et al., 2015). The TIL sample was rapidly expanded with or without p38i for 10 days, and the frequencies of neoantigen-specific T cells was measured by flow cytometry using neoantigen-specific tetramers (Figure 5L). Consistent with the TCR clonality data, the expansion of all three neoantigens-specific T cell clones was maintained between vehicle and p38i cultured TIL.
To assess the effects of p38 inhibition in other histologies, TIL from breast cancer patient ID 4136, with ER-positive and HER2-negative metastatic breast cancer, were expanded with or without p38i. Inhibition of p38 improved the expansion of breast TIL, specifically of CD8+ T cells, and the expansion of previously characterized class I restricted tumor neoantigen-reactive T cells against KIAA0368 antigen (Figures 5M, S5K, and S5L) (Zacharakis et al., 2018). Similar to melanoma TIL cultures, the expansion of breast TIL under p38i significantly increased the levels of expression of CD62L and CD27 (Figures S5M–S5P). Collectively, these data demonstrate that the inhibition of p38 in TIL cultures improved CD62L expression while preserving the overall TCR clonality, suggesting that future human immunotherapies based on TIL might benefit from the pharmacological inhibition of p38.
Pharmacological Inhibition of p38 Signaling Promotes Memory Features and Cytotoxic Ability of T Cells Engineered to Target Solid and Hematological Malignancies
Next, we investigated if p38 inhibition could benefit engineered human T cell cultures for use in clinical protocols. The NY-ESO-1 antigen is a tumor antigen expressed and presented by MHC molecules on solid tumors, such as melanoma and synovial sarcoma (Rosati et al., 2014; Zhao et al., 2005), while the CD19 antigen is highly expressed on tumors cells of some B cell malignancies. We characterized the effects of p38 inhibition during the activation, expansion, and receptor transduction of NY-ESO-1 T cell receptor (mNY-ESO-1 TCR) or anti-CD19 chimeric antigen receptor (αCD19-CAR) into human PBMC-derived T cells using methods and reagents used in current clinical cell manufacturing processes (Figure 6A).
Figure 6. Pharmacological Inhibition of p38 Signaling Promotes Expansion of CD62L-Expressing Receptor Engineered Human Peripheral Blood T Cells with Superior Cytolytic Ability.
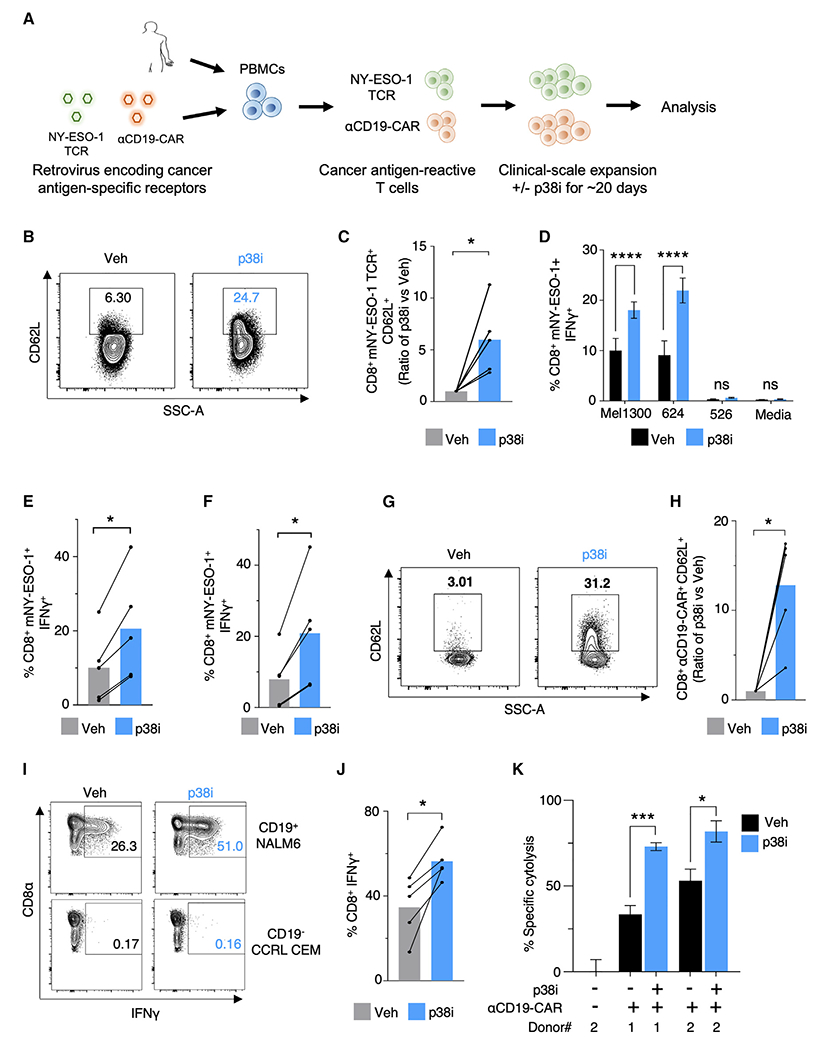
(A) Schema of clinical scale retroviral transduction and expansion of mNY-ESO-1 TCR or αCD19 CAR receptor engineered T cells with or without p38i.
(B and C) Representative FACS plots (B) and quantification (C) of CD62L expression on mNY-ESO-1 TCR+CD8+T cells after 22 days of clinical scale transduction and expansion with or without p38i. n = 5 HD.
(D) Percent IFNγ-positive cells in mNY-ESO-1 TCR+CD8+T cells upon 6 h of coculture with NY-ESO-1+ Mel1300 and Mel624 tumor cell lines, NY-ESO-1−Mel526 tumor cell line, and media alone post clinical expansion with or without p38i (n = 5).
(E and F) Quantification of the frequency of IFNγ producing mNY-ESO-1 TCR+ CD8+ T cells after 6 h coculture with NY-ESO-1+ Mel1300 (E) and NY-ESO-1+ Mel624 tumor cell lines (F).
(G and H) Representative FACS plots (G) and quantification (H) of CD62L expression on αCD19 CAR+ CD8+ T cells after 22 days of clinical scale transduction and expansion with or without p38i.
(I and J) Representative FACS plots (I) and quantification (J) of the frequency of IFNγ-positive αCD19-CAR+CD8+ T cells after 6 h coculture with CD19+ NALM6 lymphoma cell line, CD19− CCRL CEM cell line and medium alone after clinical scale expansion with or without p38i. n = 5 HD.
(K) Measurement of specific cytolysis by human αCD19-CAR+ T cells transduced and expanded ex vivo with or without p38i against CD19+ NALM6 lymphoma cells after overnight coculture at E:T of 0.5 or 1.0. αCD19-CAR+ T cells were washed to remove p38i before use in the coculture assay.
Bar plots in (C–F, H, and J) represents pooled results from five independent donors with each line corresponding to an individual subject. In (D) and (K), data are represented as mean ± SEM. Statistical comparisons were performed using a paired two-tailed Student’s t test. *p < 0.05, **p < 0.01, ***p < 0.001. See also Figure S6.
Given the need for active cell division for efficient gene integration using a γ-retrovirus, we tested if p38i influenced the efficiency of transduction. p38i did not affect the ability to introduce mNY-ESO-1 TCR into total CD3+ T cells (Figures S6A and S6B). We observed a comparable number of CD3+ mNY-ESO-1 TCR+ T cells in both vehicle- and p38i-treated cultures (Figure S6C), and a non-significant trend toward an increased number of mNY-ESO-1 TCR+ CD62L+ T cells in p38i cultures was observed within the CD4+ T cell population (Figure S6D). Importantly, we found that p38i significantly preserved CD62L expression in CD8+ mNY-ESO-1 TCR+ T cells (Figures 6B and 6C). Moreover, we found a significant decrease in the levels of total ROS measured in the mNY-ESO-1 TCR-transduced bulk CD8+ T cells in p38i cultures compared with controls, with no significant difference in bulk CD4+ T cells (Figures S6E and S6F).
We assessed antigen-specific effector cytokine production of transduced cells by co-culturing gene-engineered T cells with target tumor cells after removal of p38i. mNY-ESO-1 TCR-transduced T cells were cocultured with melanoma cell lines Mel1300 and Mel624, expressing HLA-A*02 restricted NY-ESO-1 (NY-ESO+ HLA-A*02+), and a control NY-ESO-1 non-expressing (NY-ESO− HLA-A*02+) Mel526 cell line. T cells expanded with p38i displayed a significant increase in IFNγ production in response to NY-ESO-1 antigenic stimulation (Figures 6D–6F). Taken together, we conclude that p38 inhibition permits the activation, expansion, and efficient retroviral transduction of human peripheral blood T cells with mNY-ESO-1 TCR, while simultaneously promoting the expression of CD62L and effector cytokine production.
To investigate if p38i could benefit CAR-modified PBMC transduction and expansion, we genetically engineered human T cells with a second-generation clinical CD19-CAR construct (αCD19-CAR) in the presence or absence of p38i (Figure 6A). The αCD19-CAR transduction efficiency of T cells was unaltered when T cells were activated and transduced in the presence of p38i (Figures S6G and S6H). While we observed no significant differences in total αCD19-CAR+ CD3+ T cells between vehicle or p38i conditions (Figure S6I), p38i preferentially allowed for the enrichment of CD62L+ αCD19-CAR+ CD8+ and CD62L+ αCD19-CAR+ CD4+ T cells (Figures 6G, 6H, and S6J). No differences were observed in the levels of ROS expression (Figures S6K and S6L). Finally, we assessed cytokine production of αCD19-CAR-transduced cells after coculture with CD19-expressing leukemia cell line (NALM6) or a CD19-negative control cell line (CCRL CEM). Consistent with the NY-ESO-1 TCR data, we observed a significant increase in the levels of both IFNγ and TNFα in αCD19-CAR CD8+ T cells expanded with p38i after coculture with CD19+ NALM6 cells compared with vehicle-treated cells (Figures 6I, 6J, and S6M). A significant improvement in IFNγ production was also observed within the αCD19-CAR transduced CD4+ T cell population; however, no considerable changes to levels of TNFα were observed (Figures S6N–S6P). Importantly, αCD19-CAR T cells transduced and expanded with p38i significantly enhanced the tumor-specific cytolysis (Figure 6K). These data thus establish the relevance and clinical feasibility of repressing p38 signaling during ex vivo T cell culturing for improvement of ACT.
p38 Inhibition Improves Anti-tumor Efficacy of T Cells for TCR- and CAR-Based Adoptive Immunotherapies
To test the abilities of p38i-treated T cells to expand and treat tumors in vivo, we examined the tumor infiltration and effector differentiation of p38i-cultured T cells in C57BL/6 mice bearing established hgp100-B16 tumors (Figure S7A). T cells cultured in the presence of p38i, with the inhibitor washed out before adoptive transfer, demonstrated improved homing to the spleen and tumors compared with control cells (Figures 7A–7C). Furthermore, we found an increase in the absolute number of p38i-treated Pmel TEM cells with no differences in TCM cell numbers compared with the controls at the tumor site (Figures S7B and S7C). A significant increase to the absolute number of p38i conditioned TCM and TEM T cells was observed in the spleens compared with vehicle (Figures S7D and S7E). These experiments demonstrate that T cells cultured with p38i during ex vivo expansion have significantly better in vivo expansion, effector differentiation, and tumor-infiltrating potential.
Figure 7. Inhibition of p38 Kinase in T Cells During Ex Vivo Expansion Improves Anti-tumor Efficacy of Adoptive Immunotherapy.
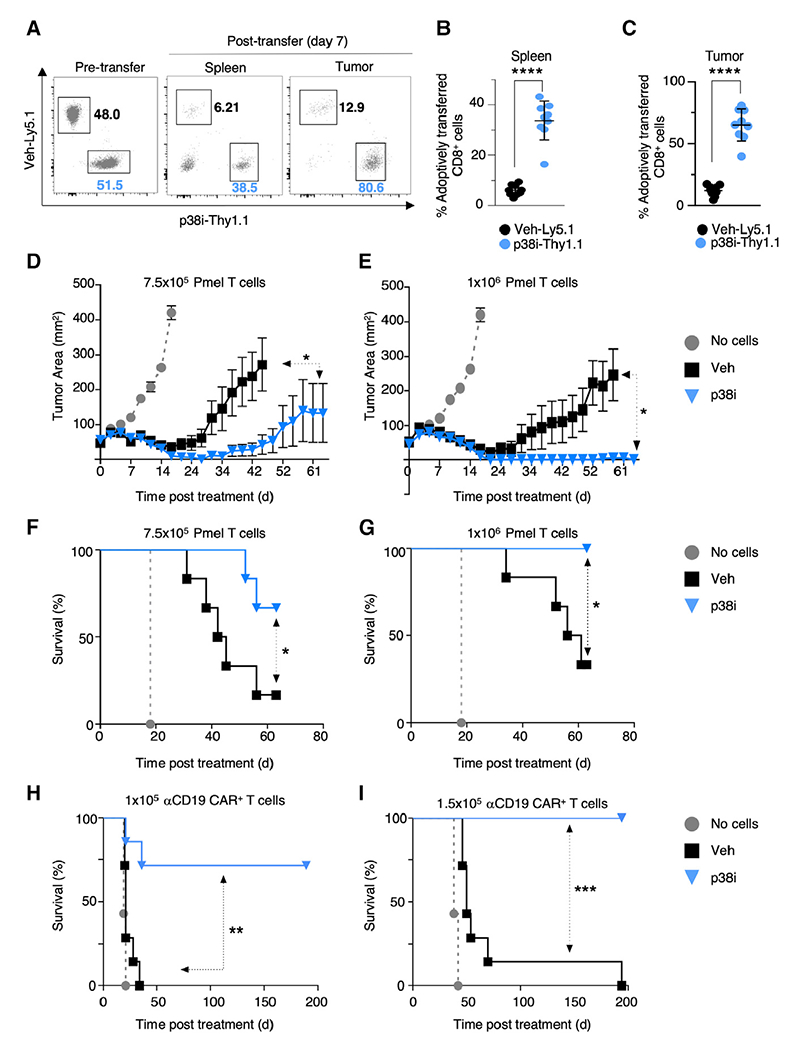
(A) Representative FACS plots of pre-transfer (day 0) and post adoptive transfer (day 7) of congenically marked Pmel T cells expanded for 10 days with (p38i-Thy1.1) or without (Veh-Ly5.1) p38i, followed by co-transfer into day 10 established B16-hgp100 tumor-bearing C57BL/6 mice (n = 9). (B and C) FACS-based quantification of transferred Pmel T cells into the spleen (B) and infiltration into established tumors (C) 7 days after T cell transfer into mice bearing day 10 established B16-hgp100 tumor-bearing C57BL/6 mice (n = 9). Statistical comparisons were performed using a paired two-tailed Student’s t test.
(D–G) Tumor area (D and E) and overall survival (F and G) in mice bearing subcutaneous tumors receiving ACT of 7.5 × 10⁵ (D and F) and 1 × 10⁶ (E and G) Pmel T cells expanded for 10 days with or without p38i (n = 6 mice/group).
(H and I) Survival of mice bearing 4-day established E2a-PBX leukemia that were untreated or received 1 × 10⁵ (H) or 1.5 × 10⁵ (I) αCD19 CAR+ Thy1.1+-modified cells transduced and cultured with or without p38i (n = 6 mice/group).
Significance was assessed using a paired t test (B and C). Significance for tumor growth kinetics (D–G) was calculated by Wilcoxon rank-sum test. A log rank Mantel-Cox test assessed significance for survival (F and G, H and I). *p ≤ 0.05, **p < 0.01, ***p < 0.001, ****p < 0.0001. Data are representative of ≥2 independent experiments. See also Figure S7.
The ultimate test of the pre-clinical utility of therapeutically effective T cells is the systemic treatment of large, established tumors. To test this, we intravenously infused T cells that had been expanded in p38i or vehicle into hgp100-B16 tumor-bearing mice at two treatment doses of 7.5 × 10⁵ and 1 × 10⁶ cells per mouse. We noted significantly reduced tumor growth and improved survival in tumor-bearing mice treated with T cells expanded in p38i compared with vehicle (Figures 7D–7G). A 100% survival benefit Was observed when 1 × 10⁶ p38i-conditioned cells were used for treatment compared with vehicle (Figure 7G). These data indicate that the potency of the cells cultured with p38i is far superior in controlling the growth of established tumors compared with the vehicle-treated cells.
We also investigated the anti-tumor efficacy of CAR-transduced T cells in a syngeneic αCD19 CAR model for the treatment of a murine B cell acute lymphoblastic leukemia, E2a-PBX. Open repertoire C57BL/6 CD8+ T cells were transduced and expanded with a previously described second-generation αCD19 28ζ CAR (Kochenderfer et al., 2010b) in the presence or absence of p38i (Figure S7F). p38i-cultured αCD19 CAR+ CD8+ T cells had a significant increase in the levels of CD62L expression compared with the vehicle (Figures S7G–S7I). More importantly, the potency of p38i-treated αCD19 CAR+ T cells at both tested doses of 1 × 10⁵ and 1.5 × 10⁵ was far superior to the vehicle-treated arm (Figures 7H and 7I). Collectively, these data support the clinical use of p38 inhibition during ex vivo T cell expansion in gene-engineered ACT as a means to improve therapeutic efficacy.
DISCUSSION
By screening for TCR-driven kinases that improve phenotypes of therapeutically effective T cells, we found that targeting of Mapk14 (p38) was successful at enhancing cell expansion and memory while reducing oxidative and genomic stress. Previous reports have shown that inhibition of the p38 pathway could reverse DNA damage and senescence-associated dysfunction in primary human T cells independent of the exhaustion-related PD1 axis (Henson et al., 2015; Lanna et al., 2014). While these studies highlight the importance of inhibiting p38 activity in senescent populations of T cells, our study identifies the importance of blocking p38 activity during early activation and expansion of less-differentiated T cells. Our work also determines the importance of p38 inhibition during the transduction and expansion of tumor-reactive gene-engineered T cells and its role in regulating their differentiation and cytotoxicity. Our findings with human T cells support the notion that p38 inhibition can improve CD62L expression, decrease levels of ROS, and improve cytokine production without depressing cell expansion or TCR clonality. A treatment strategy using p38i could be explicitly designed for ACT, avoiding the need for in vivo administration of the drug and thus avoiding any systemic off-target toxicities. The presence of a reversible inhibitor for p38, BIRB796, and its ability to mimic the loss-of-function effects of Mapk14 KO on desired phenotypes can speed the clinical translation of these findings.
In this study, we found that inhibition of p38 not only improves T cell expansion but also plays a central role in regulating global T cell antioxidant metabolism. The role of p38 in affecting antioxidant REDOX metabolism described here may ultimately play a role in DNA damage, but mechanisms involved will require further investigations.
In summary, we identified a unique role for p38 in regulating multiple desired phenotypes of T cells for ACT. Multi-phenotype CRISPR-Cas9 screens can be extended to functional manipulations of exomic and non-coding genetic elements, wherein the regulation of complex pathways and signaling in a given cell can be identified. Finally, this study establishes p38 inhibition in T cells as a potentially important strategy for improving ACT immunotherapy in the clinic for cancer patients.
STAR★METHODS
RESOURCE AVAILABILITY
Lead Contact
Further information and requests for reagents may be directed to and will be fulfilled by the Lead Contact, Nicholas P. Restifo (restifon@mail.nih.gov).
Materials Availability
This study did not generate new unique reagents.
Data and Code Availability
RNA sequencing data generated during this study are available at the NCBI-GEO database with the project accession ID GEO: GSE114087. The published article includes all datasets generated or analyzed during this study.
EXPERIMENTAL MODEL AND SUBJECT DETAILS
Mice
Animal experiments were approved by the Institutional Animal Care and Use Committees of the NCI and performed in accordance with the National Institutes of Health (NIH) guidelines. C57BL/6NCR mice were purchased from Charles River Laboratory. Thy1.1 and Ly5.1 Pmel-1 TCR-transgenic (Pmel, C57BL/6 .Cg-/Cy Tg [TcraTcrb] 8Rest/J) mice were maintained in house under specific pathogen-free conditions, as previously described (Overwijk et al., 2003). All animals used in our experiments were between 6–8 weeks of age.
Cell Lines
B16F10 (B16) (H-2Db), a mouse melanoma cell line expressing glycoprotein 100 (gp100) with human residues at position 25-27 (EGS to KVP), B16-hgp100, as previously described (Eil et al., 2016), was used in our experiments. Cell lines were confirmed mycoplasma negative using Mycoplasma detection kit (Biotool #B3903). B16F10 (B16) cells were cultured in D10 medium containing DMEM supplemented with 10% fetal bovine serum (FBS, Hyclone, Logan, UT), 2 mM L-glutamine, and 1% penicillin-streptomycin (Life Technologies). E2a-PBX cells were cultured in RPMI supplemented with 10% fetal bovine serum (FBS, Hyclone, Logan, UT), 2 mM L-glutamine, and 1% penicillin-streptomycin (Life Technologies), 1% MEM NEAA supplement (Life Technologies), 1% Sodium Pyruvate supplement (Life Technologies) and 0.1% 2-Mercaptoethanol (Life Technologies).
Human Specimen
Peripheral blood mononuclear cells (PBMC) were isolated from healthy donors, and tumor samples were isolated from patients with metastatic melanoma and breast cancer enrolled in Surgery Branch, National Cancer Institute (NCI) clinical protocols. PBMC and lymphocytes used for transduction and as feeder cells were obtained from the apheresis of NCI Surgery Branch patients on IRB-approved protocols. All human samples were isolated in accordance with approved clinical protocols and in accordance with NIH institutional review board approval and informed consent from patients and healthy donors.
Culture of Pmel Cells
Primary mouse T cells were cultured in RPMI supplemented with 10% fetal bovine serum (FBS, Hyclone, Logan, UT), 2 mM L-glutamine, and 1% penicillin-streptomycin (Life Technologies), 1% MEM NEAA supplement (Life Technologies), 1% Sodium Pyruvate supplement (Life Technologies) and 0.1% 2-Mercaptoethanol (Life Technologies). Splenocytes from Pmel mice were stimulated with hgp10025-33 peptide (1 μM) and 60 IU/mL recombinant human IL2 (Aldesleukin Proleukin; Novartis) in the presence or absence of 0.5 μM p38 inhibitor BIRB796 (p38i; Selleckchem). CD8+ T cells were harvested on day 5 or day 10 and used for further experiments. Secondary stimulation was performed on day 5 using peptide-pulsed irradiated C57BL/6 splenic feeder cells or plate-bound αCD3ε (2 μg/ml) and αCD28 (1 μg/ml).
METHOD DETAILS
CRISPR-Cas9 Kinome Screens and Data Deconvolution
We genetically perturbed 25 kinases that have sustained kinase activity in T cells for up to 16 h post-TCR stimulation (Tan et al., 2017) in mouse primary T cells using the CRISPR-Cas9 system. Non-targeting control guide and β2m sgRNA were included as controls in the CRISPR-Cas9 screen. Protospacer sequences of sgRNA that target exons of selected kinases were obtained from mouse Brie library designed with improved on-target activity predictions (Rule Set 2) and with an off-target score, the Cutting Frequency Deter-mination (CFD) (Doench et al., 2016) (Table S1). Non-targeting control sgRNA was also included. Chemically modified single guide RNAs (sgRNAs) were synthesized by Synthego. In vitro, sgRNA-Cas9 complexes were prepared following manufacturer’s instruc-tions using purified Cas9-2NLS nuclease (Synthego) in electroporation buffer R (Neon transfection, Thermo Fisher). sgRNA-Cas9 complexes were electroporated in T cells post 24 h stimulation with plate-bound αCD3ε and soluble αCD28 using Neon transfection (Thermo Fisher, setting: 1600V, 10 milliseconds, 3 pulses). T cells were expanded for 9 days post electroporation, and then flow-cy-tometry data was collected for each phenotype. Kinases were ranked for each desired phenotype by the second-best sgRNA metric (Patel et al., 2017). All kinases regulating a given phenotype were designated with a phenotype-score of 1 to 27 such that the top-ranked kinase gets a score of 27, and 27th ranked kinase gets a phenotype score of 1. The average of these scores for all four phe-notypes, which we termed as ‘pleiotropy rank score’, was used to determine the cumulative impact of perturbation of a given kinase on all four desired phenotypes.
Murine Tumor Processing to Analyze TIL
Tumors were minced with scissors and enzymatically digested with 200 μg/mL DNase I (Sigma-Aldrich) and 400 U/mL collagenase Type IV (Gibco) in DMEM complete media in 5% CO2at 37°C for 3 h. The tumor digests were then serially passed through 100 μm and then a 40 μm nylon cell filter to generate a single-cell suspension. The resulting single-cell suspension was ACK lysed for 3 min at room temperature and washed with PBS containing 2 mM EDTA. The resulting single-cell suspension of the tumor cells was used for downstream flow cytometry staining and analysis after blocking for the Fc receptors with Fc-block (2.4G2, BD Biosciences) for 30 min on ice. T cells were identified using a combination of positive selection by staining for canonical T cell markers (CD3ε, CD4, and CD8a) and congenic markers (Thy1.1 and Ly5.1).
Western Analysis/Protein Simple Capillary Electrophoresis Immunoassay
T cell total protein was extracted with 1X RIPA buffer (Millipore) with 1X protease inhibitor (Sigma). Protein concentration was determined using the BCA protein assay (Pierce/Thermo Fisher). Protein Simple capillary electrophoresis was performed per the Protein Simple manufacturer’s protocol. Briefly, total cellular protein 2 μg were mixed with a master mix (Protein Simple) to a final concentration of 1X sample buffer, 1X fluorescent molecular weight markers, and 40 mmol/L DTT and then heated at 95°C for 5 min. The samples were blocked, incubated with the primary and secondary antibodies, and developed with a chemiluminescent substrate using the fully automated protein simple capillary detection system. The results were analyzed using the Compass Software (Protein simple), and β-actin was used as our loading control. The antibodies used in the Wes™ protein analysis are listed in the Key Resources Table.
KEY RESOURCES TABLE
| REAGENT or RESOURCE | SOURCE | IDENTIFIER |
|---|---|---|
| Antibodies | ||
| Annexin V | BD Biosciences | Cat# 550475 |
| AntI CD45.1 (Clone A20) | BD Pharmingen | Cat # 553775; RRID: AB_395043 |
| Anti CD45.2 | BD Pharmingen | Cat# 552950; RRID: AB_394528 |
| Anti-phospho-Histone H2A.X (Ser139) Antibody, clone JBW301, FITC conjugate | EMD Millipore | Cat# 16-202A; RRID: AB_568825 |
| Anti H2AX (pS139)-Alexa Fluor® 647; clone N1-431 | BD Biosciences | Cat# 560447; RRID: AB_1645414 |
| Anti-human CD3 Clone: UCHT1 | BD Horizon | Cat#563852; RRID: AB_2744391 |
| Anti-human CD4 Clone: OKT4 | Biolegend | Cat#317442; RRID: AB_2563242 |
| Anti-human CD8 Clone: RPA-T8 | Biolegend | Cat# 301044; RRID: AB_2562906 |
| Anti human CD45RO Clone UCHL1 | Biolegend | Cat# 304230; RRID: AB_11203900 |
| Anti human CD62L Clone DREG | Biolegend | Cat# 304820; RRID: AB_493769 |
| Anti-human CD27 Clone M-T271 | Biolegend | Cat# 356408; RRID: AB_2561906 |
| Anti human IFNg | BD Pharmingen | Cat# 557995; RRID: AB_396977 |
| Anti human IL2 | BD Pharmingen | Cat# 554567; RRID: AB_398571 |
| Anti human TNFa | BD Pharmingen | Cat# 559321; RRID: AB_397219 |
| TCR beta Monoclonal Antibody (H57-597) | eBiosciences | Cat# 12-5961-82;RRID: AB_466066 |
| Anti Ki67 | Ebiosciences | Cat# 48-5698-82; RRID: AB_11149124 |
| Anti mouse Akt (pan) (C67E7) Rabbit mAb (Alexa Fluor 647) | Cell Signaling | Cat# 5186; RRID: AB_10695877 |
| Anti mouse CD62L | BD Pharmingen | Cat# 560516; RRID: AB_1645257 |
| Anti mouse H-2Db | BD Pharmingen | Cat# 553574; RRID: AB_394932 or Cat# 553573; RRID: AB_394931 |
| Anti mouse H-2Kb | Biolegend | Cat# 116518; RRID: AB_10564404 or Cat# 116514; RRID: AB_1967129 |
| Anti mouse IFNg Clone: XMG1.2 | Ebiosciences | Cat# 48-7311-82; RRID: AB_1834366 or Cat# 554412; RRID: AB_395376 |
| Anti mouse IL2 | BD Pharmingen | Cat# 554428; RRID: AB_395386 or Cat# 554427; RRID: AB_395385 |
| Anti mouse phospho Akt (Thr 308) (C31E5E) (Alexa Fluor 647) | Cell Signaling | Cat# 3375S; RRID: AB_2202760 |
| Anti mouse phospho-Akt (Ser 473) (D9E) (PE conjugate) | Cell Signaling | Cat# 5315S; RRID: AB_10694850 |
| Anti mouse TCRVβ 13 | BD Biosciences | Cat# 561542; RRID: AB_10894393 |
| Anti mouse TNFa | BD Pharmingen | Cat# 557644; RRID: AB_396761 |
| Anti PD1 | BD Biosciences | Cat# 563059; RRID: AB_2737980 or Cat# 562523; RRID: AB_2737634 |
| Anti Thy1.2 | BioLegend | Cat# 140316;RRID: AB_10642813 |
| Anti-mouse TCF1/TCF7 (C63D9) Rabbit mAb (PE Conjugate) | Cell Signaling | Cat# 14456; RRID: AB_2798483 |
| Anti-CD3 clone: 145-2C11 | BD Biosciences | Cat# 553058; RRID: AB_394591 |
| Anti-Human CD3 Functional Grade Purified (clone OKT3) | Ebiosciences | Cat# 16-0037; RRID: AB_468855 |
| Anti-Mouse CD28 Functional Grade Purified (clone 37.51) | Ebiosciences | Cat# 16-0281; RRID: AB_468922 |
| Anti-Mouse CD3 Functional Grade Purified (clone 17A2) | Ebiosciences | Cat# 14-0032; RRID: AB_467055 |
| Anti-mouse/human CD44 Antibody | Biolegend | Cat# 103059; RRID: AB_2571953 |
| Anti-TCRVβ13 | BD Biosciences | Cat# 553204; RRID: AB_394706 |
| CellTrace™ CFSE Cell Proliferation Kit | Thermo Fisher Scientific | Cat# C34554 |
| eBioscience™ Fixable Viability Dye eFluor™ 450 | Thermo Fisher Scientific | Cat# 65-0863-14 |
| eBioscience™ Fixable Viability Dye eFluor™ 780 | Thermo Fisher Scientific | Cat# 65-0865-14 |
| Proleukin® (aldesleukin)-Human recombinant IL2 | Novartis | |
| Phospho-p44/42 MAPK (Erk1/2) (Thr202/Tyr204) (197G2) Rabbit mAb (Pacific Blue) | Cell Signaling | Cat# 14196S; RRID: AB_2798421 |
| Phospho-S6 Ribosomal Protein (Ser235/236) (D57.2.2E) Rabbit mAb (Alexa Fluor 647) | Cell Signaling | Cat# 4851S; RRID: AB_10695457 |
| Propidium Iodide | BD Biosciences | Cat# 556463 |
| RetroNectin® GMP grade, Recombinant Human Fibronectin Fragment CH-296 | Takara | Cat# T202 |
| FITC-Labeled Recombinant Protein L | ACRO Biosystems | Cat# RPL-PF141 |
| Anti-GCLC antibody | Abcam | Cat# ab41463; RRID: AB_941717 |
| beta-Actin (clone AC-74) | Sigma | Cat# A5316; RRID: AB_476743 |
| Catalase (D5N7V) Rabbit mAb #14097 | Cell Signaling | Cat# 14097S;RRID: AB_2798391 |
| p38 MAPK Antibody #9212 | Cell Signaling | Cat# 9212S; RRID: AB_330713 |
| Phospho-p38 MAPK (Thr180/Tyr182) (D3F9) XP® Rabbit mAb | Cell Signaling | Cat# 4511S; RRID: AB_2139682 |
| Bacterial and Virus Strains | ||
| Recombinant vaccinia virus | Overwijk et al., 2003 | N/A |
| Chemicals, Peptides, and Recombinant Proteins | ||
| 2-Deoxy-2-[(7-nitro-2,1,3-benzoxadiazol-4-yl) amino]-D-glucose (2-NBDG) | Sigma | Cat# 72987 |
| 2-Deoxy-D-A73glucose (2-DG) | Sigma | Cat# D6134 |
| 2-Mercaptoethanol (1000X) | Life Technologies | Cat# 21985-023 |
| Annexin V Binding Buffer, 10X concentrate RUO | BD Biosciences | Cat# 556454 |
| BIRB796/Doramapimod | Selleckchem | Cat# S1574 |
| FBS Batch Number: 12C483H1 | Sigma | Cat# 12306C-500ML |
| GlutaMAX (100X) | Thermo Fisher Scientific | Cat# 35050-061 |
| Golgi Plug | BD Biosciences | Cat# 512301KZ, 555029 |
| Golgi STOP | BD Biosciences | Cat# 512092KZ, 554727 |
| H2DCFDA (H2-DCF, DCF) | Thermo Fisher Scientific | Cat# D399 |
| Human gp100 peptide | Genscript | Cat# 282077-1, KVPRNQDWL |
| MitoSOX™ Red Mitochondrial Superoxide Indicator | Thermo Fisher Scientific | Cat# M36008 |
| Penicillin/streptomycin | Thermo Fisher Scientific | Cat# 15140-122 |
| Phosphate buffered saline pH 7.4 (1X) | Thermo Fisher Scientific | Cat# 10010-023 |
| Protein L | Genscript | Cat# M00097 |
| Sodium Pyruvate (100mM) | Life Technologies | Cat# 11360-070 |
| Trypsin-EDTA (0.05%), phenol red | Thermo Fisher Scientific | Cat# 25300-062 |
| AIM V serum free lymphocyte growth medium | Gibco | Cat# 31035025 |
| Human Serum - Sterile filtered Heat Inactivated | Valley Biomedical Inc | Cat# HP1022HI |
| MEM NEAA, 100X | Life Technologies | Cat# 11140-050 |
| Critical Commercial Assays | ||
| 12-230 kDa Wes Separation Module, 8 × 25 Capillary Cartridges | Protein Simple | Cat# SM-W004 |
| Anti-Mouse Detection Module for Wes, Peggy Sue or Sally Sue | Protein Simple | Cat# DM-002 |
| Anti-Rabbit Detection Module for Wes, Peggy Sue or Sally Su | Protein Simple | Cat# DM-001 |
| BD Phosflow Fix Buffer I | BD Biosciences | Cat# 557870 |
| BD Phosflow Perm Buffer III | BD Biosciences | Cat# 558050 |
| Fluorescent 5x Master Mix 1 | Protein Simple | Cat# PS-FL01-8 |
| High Capacity cDNA Reverse Transcription Kit with RNase Inhibitor | Applied Biosystems | Cat# 4374966 |
| Mycoplasma Detection kit | Biotool | Cat# B3903 |
| Pierce BCA Protein Assay Kit | Thermo Scientific | Cat# 23225 |
| RNeasy Plus Mini Kit | Qiagen | Cat# 74134 |
| RNeasy Plus Micro kit | Qiagen | Cat# 74034 |
| Seahorse Bioassay Plates | Agilent Technologies | Cat# 102416 |
| Seahorse XF base medium, 500 mL | Agilent Technologies | Cat# 103334-100 |
| Seahorse XF Calibrant Solution 100 mL | Agilent Technologies | Cat# 103059-000 |
| Seahorse XF Cell Mito Stress Test Kit | Agilent Technologies | Cat# 103015-100 |
| Seahorse XF Glycolysis Stress Test Kit | Agilent Technologies | Cat# 103020-100 |
| Taqman® PCR Master Mix, no AmpErase UNG | Applied Biosystems | Cat# 4324018 |
| Deposited Data | ||
| Raw data files for RNA sequencing | This paper; NCBI Gene Expression Omnibus | GEO: GSE114087 |
| Metabolome Data | This paper | Table S3 |
| Experimental Models: Cell Lines | ||
| B16-mhgp100 melanoma | Eil et al., 2016 | N/A |
| E2a-PBX Leukemia | Jacoby et al., 2016; Yang et al., 2017 | N/A |
| Experimental Models: Organisms/Strains | ||
| C57BL/6N | NCI/Charles River | N/A |
| Pmel-1 TCR-transgenic (Pmel, C57BL/6 .Cg-/Cy Tg [TcraTcrb] 8Rest/J) | In house | N/A |
| Oligonucleotides | ||
| Gene Symbol: Actb | Applied Biosystems/Thermo Fisher | Mm02619580_g1 |
| Gene Symbol: Cat, mCG9645 | Applied Biosystems/Thermo Fisher | Mm00437992_m1 |
| Gene Symbol: Gpx1, mCG13024 | Applied Biosystems/Thermo Fisher | Mm00656767_g1 |
| Gene Symbol: Sod1, mCG129575 | Applied Biosystems/Thermo Fisher | Mm01344233_g1 |
| Gene Symbol: Sod2, mCG16695 | Applied Biosystems/Thermo Fisher | Mm01313000_m1 |
| sgRNA used in CRISPR-Cas9 screens and validation | This paper | Table S1 |
| Recombinant DNA | ||
| murine NY-ESO-1 T cell receptor | Rosati et al., 2014 | N/A |
| human MSGV-FMC63-28Z encoding the anti-CD19 CAR | Kochenderfer et al., 2010a | N/A |
| murine MSGV-1D3-28Z (anti-CD19 CAR) | Kochenderfer et al., 2010b | N/A |
| Software and Algorithms | ||
| Agilent 2200 TapeStation | Agilent Technologies | http://www.genomics.agilent.com/article.jsp?pageId=9100002 |
| FlowJo v10 | FlowJo, LLC | https://www.flowjo.com/ |
| Gene Set Enrichment Analysis (GSEA) | GSEA (Broad Institute) | http://software.broadinstitute.org/gsea/index.jsp |
| ImageJ software | NIH | http://rsb.info.nih.gov/ij/ |
| Immunoseq Analyzer | Adaptive Biotechnologies | https://www.adaptivebiotech.com/ |
| Ingenuity pathway analysis | Qiagen | https://www.qiagenbioinformatics.com/products/ingenuity-pathway-analysis/ |
| Prism 6 | GraphPad Software | http://www.graphpad.com/ |
| R-package DeSeq2 | Bioconductor | https://bioconductor.org/packages/release/bioc/html/DESeq2.html://bioconductor.org/packages/release/bioc/html/edgeR.html |
| STAR v2.4.2a | Star | http://code.google.com/p/rna-star/ |
Flow Cytometry Analysis
Suspensions containing T cells were stained with a fixable live/dead stain (Invitrogen) in PBS followed by surface antibody staining in FACS buffer (PBS with 0.5% BSA and 0.1% sodium azide). Antibodies used for cell surface staining or intracellular staining are listed in Key Resources Table. Cell expansion in ex vivo cultures was monitored by enumeration of live CD8+ T cell by using a FACS-based Count Bright bead method (Life Technologies). For phosphostaining, BD PhosFlow reagents were used, and the fixation and permeabilization process was carried out according to the manufacturer’s protocols. To determine intracellular cytokine expression, T cells were stimulated with either αCD3ε or phorbol 12-myristate 13-acetate (PMA) and ionomycin in the presence of monensin and brefeldin A (BD Biosciences) for 4-6 h. After stimulation, cells were stained with an amine-reactive exclusion-based viability dye (Invitrogen) and with antibodies against cell-surface antigens. Cells stained for viability and cell surface markers were fixed and permeabilized for staining with intracellular anti-cytokine antibodies. Cells were washed three times with wash buffer, and the samples were immediately acquired using a Fortessa or LSR flow cytometer. The data was analyzed using FlowJo software (TreeStar).
Total Cellular and Mitochondrial ROS Measurements
For analysis of intracellular ROS, CD8+ T cells were incubated with 5 μM dichlorofluorescein diacetate (DCFDA, Invitrogen) at 37°C for 30 min. Cells were washed twice with cold PBS and immediately analyzed with flow cytometry. Mitochondrial ROS was measured using flow-cytometry based assay of MitoSOX dye according to manufacturer’s instructions (Thermo Fisher). All samples were acquired with a Fortessa or LSR flow cytometer (Becton Dickinson) and analyzed using FlowJo software (TreeStar).
Apoptosis and Cell-Proliferation Assays
The number of cells experiencing apoptosis and necrosis during ex vivo expansion was determined using flow-cytometry based Annexin V Apoptosis detection kit (Thermo Fisher). Cell population doubling was measured using CellTrace™ CFSE Cell Proliferation Kit (Thermo Fisher).
2-NBDG Uptake Assay
To determine glucose uptake, T cells were incubated with 100 μM 2-NBDG (Invitrogen) for 2 h at 37°C before measuring fluorescence by flow cytometry. The 2-NBDG uptake reaction was stopped by removing the incubation medium and washing the cells twice with pre-cold phosphate buffered saline (PBS). The cells were maintained at 4°C and the flow acquisition was performed within 30 min. The data was analyzed using FlowJo software (TreeStar).
Mitochondrial and Metabolism Assays
T cell mitochondrial stress test and glucose stress test were measured at 37°C using an XFe96 extracellular analyzer (Seahorse Bioscience) as previously described (van der Windt et al., 2016). Oxygen consumption rates (OCR) and extracellular acidification rates (ECAR) for the mitochondrial stress test were measured in XF media (containing 25 mM glucose, 2 mM L-glutamine, and 1 mM sodium pyruvate) under basal conditions and in response to 1 μM oligomycin, 0.5 μM fluoro-carbonyl cyanide phenylhydrazone (FCCP), and 0.5 μM rotenone and antimycin A (Sigma). For glucose stress test, the cells were cultured in XF media (containing 2 mM L-glutamine) and the OCR and ECAR readout was obtained at basal conditions and in response to 10 mM glucose, 1 μM Oligomycin and 10 mM 2-DG.
Glutathione Detection Assay
The levels of intracellular glutathione in the T cells cultured with or without p38i for 5 days was determined using the Cellular Glutathione Detection Assay Kit (Cell Signaling). Briefly, 1 × 10⁶ T cells were incubated with the cell permeable dye monochlorobimane (MCB) for 30 min at 37°C per manufacturer’s instructions. The level of intracellular glutathione was measured using flow cytometry-based detection after excitation at 380 nm and detection at 460 nm.
Global Metabolomics Analysis
Pmel T cells were expanded for 5 days in the presence of p38i or vehicle. Cells were washed with cold PBS twice and snap-frozen on dry ice for metabolite analysis. Samples from 3 biological replicates of vehicle and p38i cultured cells were analyzed. Each of these samples were split into three technical replicates for separate analysis on GC/MS abd LC/MS/MS platforms. Metabolite analysis was performed by Metabolon (Durham, NC).
RNAseq and Quantitative PCR
Total RNA was extracted from cells using the RNeasy Plus Mini Kit (Qiagen). The quality and quantity of extracted total RNA were determined using Tape Station 2200 (Agilent) and the RNA integrity Algorithm (RIN). For genome-scale transcriptome analysis, 200 ng of total RNA was used to prepare the RNA-seq library using the TruSeq RNA sample preparation kit (Illumina). Paired-end RNA sequencing was performed on a HiSeq 2500 platform at the NCI CCR Sequencing Facility (Illumina). Sequenced reads were aligned either to the mouse genome (mm10) using STAR (version 2.4.2a). Subread (version 1.4.6) was used to count the number of reads mapped to each gene. Genes with reads that were less than 5 across all samples were removed, and the data were normalized using the Trimmed Mean of M-values (TMM) normalization. Differential gene expression values were computed using DESeq2 (Bioconductor) (Love et al., 2014; Robinson et al., 2010). To define differentially expressed genes, we used a two-fold change and p < 0.05 difference between groups.
Quantitative Reverse-Transcription Polymerase Chain Reaction
Cells were pelleted in RNALater solution (Qiagen) and stored at −80°C. Total RNA from pelleted cells was isolated using the RNeasy Plus mini kit (Qiagen). First-strand cDNA synthesis was performed using the high-capacity cDNA synthesis kit (Applied Biosystems). The obtained cDNA was used as a template for quantitative PCR reactions using Taqman primer probes designed against specific mRNA transcripts (Life Technologies) using the real-time PCR instrument (Applied Biosystems). FAM channel intensity was normalized to ROX intensity, and Ct values were calculated using automatically determined threshold values with SDS software (Applied Biosystems). Relative mRNA expression was determined via the ΔΔCt method. Probes are listed in Key Resources Table.
In Vivo T cell Expansion Assay
Age- and gender-matched Pmel T cells that were congenically marked with Thy1.1 and Ly5.1 were expanded ex vivo for 10 days under vehicle or p38i condition. On the day of transfer, congenically marked T cells cultured in vehicle or p38i were washed and mixed at a 1:1 ratio. C57BL/6 mice were subjected to 6 Gy total-body γ-radiation from a 137Cs source. Mice were intravenously injected with 1 × 10⁶ total admixed T cells and were challenged with 1 × 10⁶ PFU rVV-hgp100. Mice received intraperitoneal injections of IL-2 in PBS (6 × 10⁴ IU per 0.5 ml) once daily for 3 consecutive days. In recall response experiments, mice were re-challenged with 1 × 10® PFU AAV-hgp100 on day 30 post T cell transfer.
Retroviral Vectors and Transduction of Murine CD8+ T Cells with Murine αCD19 CAR
Murine αCD19 CAR encoding retroviral particles were generated by transducing Platinum-E ecotropic packaging cells (Cell Biolabs Inc.) with MSGV-1D3-28Z (anti-CD19 CAR) (Kochenderfer et al., 2010b) construct. Briefly, Platinum-E cells were plated overnight in Biocoat dishes (Corning). The following day, 24 μg of the MSGV-1D3-28Z construct along with 6 μg of pCL-Eco packaging plasmid DNA were transduced into the Platinum-E cells using 60 μl of Lipofectamine 2000 reagent (Thermo Fisher Scientific) and OptiMEM (Gibco) in antibiotic-free media for 7 h. Media was replaced after 7 h into viral supernatant collection media. Viral supernatants were collected from the cells after 48 h and centrifuged to remove debris. Retroviral supernatants were spun for 2 h- at 2000 g, 32°C on non-tissue culture treated 24 well plates that had been coated with 20 μg/ml RetroNectin®. C57BL/6 CD8+ T cells that were activated for 24 h with αCD3/αCD28 stimulation in the presence or absence of p38i were added to the retrovirally coated plates after removal of the supernatant. The cells were spun for 5 min at 300g at 32°C and then incubated overnight in vehicle or p38i media, respectively. The transduction was repeated for a second time the next day in vehicle or p38i media, respectively. The T cells were expanded until day 10 with a restimulation on day 5 in the presence or absence of p38i. The frequency of αCD19 CAR transduced cells was estimated by staining for protein L using a FITC-labelled recombinant protein L (ACRO Biosystems). Transduction efficiency of ~40% was obtained in CD8+ T cells transduced with αCD19 CAR in both the vehicle and p38i conditions.
Adoptive Cell Transfer Immunotherapy
For solid cancer immunotherapy experiments, we used mouse-human chimeric gp100 antigen overexpressing B16 melanoma (B16-hgp100) cells that are responsive to the adoptive transfer of Pmel-1 TCR transgenic CD8+ T cells in an in vivo setting. C57BL/6 mice were subcutaneously implanted with 5 × 10⁵ hgp100-B16 cells and 10 days post tumor implantation recipient mice were randomized and sub-lethally irradiated (600 cGy). Recipient animals (n = 6 for treatment groups) were injected intravenously with 0.75 x 10⁶ or 1 × 10⁶ Pmel-1 CD8+ T cells and received intraperitoneal injections of IL-2 in PBS (6 × 10⁴ IU per 0.5 ml) once daily for 3 consecutive days. Tumor size was measured in a blinded fashion approximately every two days after transfer, and the tumor area was calculated as length × width of the tumor. Mice with tumors approaching 400 mm2 were euthanized. The products of the perpendicular tumor diameters are presented as mean ± SEM at the indicated times after ACT.
For the treatment of syngeneic B cell acute lymphoblastic leukemia (B-ALL), male or female C57BL/6 mice were injected with 1 x 10⁶ cells CD19+ E2a-PBX leukemia cells. Tumor-bearing mice received 5 Gy total body radiation on day 4 post tumor establishment. On day 5, mice were left untreated as controls or received tail vein injection of vehicle or p38i treated αCD19 CAR T cells at the indicated doses. The animals in all the treatment arms received intraperitoneal injections of IL-2 in PBS (6 × 10⁴ IU per 0.5 ml) once daily for 3 consecutive days. The animals were monitored for hind limb paralysis, and the survival of the animals was recorded.
Culture of T Cells from Healthy Donors
Healthy donor PBMC were isolated from buffy coat by density gradient centrifugation using lymphocyte separation medium (Lonza). Total CD8+ T cells were isolated from PBMC cultures using CD8+ T cell negative enrichment kit as per manufacturer’s instructions (Stem Cell Technologies). The purity of enriched population was confirmed to be >95% using flow cytometry. 1 x 10⁶ purified CD8+ T cells were stimulated using αCD3/αCD28 coated Dynabeads on day 1 (cells: beads ratio 1:4) (Invitrogen). On day 15, the cells were collected, and 1 x10⁶ cells were restimulated with αCD3/αCD28 coated Dynabeads in the presence or absence of p38i, BIRB796. The cells were maintained in lymphocyte stimulation media (AIM V medium, 100U/ml penicillin, 100μg/ml streptomycin, 5% human serum, 300 IU/ml IL-2) in the presence or absence of 0.5 μM p38 inhibitor BIRB796 throughout the culture process.
For bulk T cell expansion, peripheral blood lymphocytes were resuspended at a density of 1 x10⁶ cells/ml in lymphocyte stimulation media (AIM V medium, 100 U/ml penicillin, 100 μg/ml streptomycin, 5% human serum, 300 IU/ml IL-2) and were stimulated with 50 ng/ml OKT3 in the presence or absence of 0.5 μM p38 inhibitor BIRB796. On day 10 of the culture process, 1 x10⁶ T cells from each of the cultures were either restimulated with soluble αCD3/αCD28 (Immunocult) or were expanded using the rapid expansion protocol as described below.
Culture of Human Melanoma TIL
Human TIL cultures were expanded to clinical-scale, as previously described (Dudley et al., 2003). Briefly, tumor fragments or digests were cultured in 6,000 IU/mL IL2 for 2 weeks to obtain TIL. The TIL were then subsequently expanded with a rapid expansion protocol (REP) using 30 ng/mL OKT3 (anti-CD3) antibody (Miltenyi Biotec) and 300 IU/mL IL2 in the presence of irradiated (50 Gy) allogeneic feeder cells at a 200:1 ratio of feeder cells to TIL/PBMC in the presence or absence of 0.5 μM p38 inhibitor BIRB796. Human TIL were REPed on day 1, and a second REP was carried out on day 10. Total cell counts of expanded melanoma TIL were measured on days 10 and 20 of the REP. Human TIL were REP in 300 IU/mL IL2 containing 50:50 media comprised of 500 mls of complete human media (10% human AB serum (Valley Biomedical, Winchester, VA), 100 U/mL penicillin and 100 μg/mL streptomycin, 2 mM L-glutamine and 12.5 mM HEPES (Life Technologies) and 500 mls of AIM-V medium.
Tetramer Based Detection of Neoantigens in Human Melanoma TIL Culture
Patient 3713 TIL expanded in the presence or absence of p38i was stained with the neoantigen-specific tetramers for SRPX, WDR46, AHNAK, as previously described (Cohen et al., 2015). Neoantigen specific HLA-A*02:01 tetramers were made using UV exchangeable HLA-A*02:01 Flex-T monomers from Biolegend (San Diego, CA) according to the manufacturer’s instructions in two channels using the APC and PE fluorochromes. Cells were washed (1500 rpm, 5 min) twice in staining buffer (1X PBS, EDTA, and 2% FBS) and re-suspended in 1 mL of AIM-V media with 1mM Dasatinib following incubation at 37°C for 20 minutes. After washing with the staining buffer, the cells were stained with dual-colored tetramers at a 1:50 dilution for 30 minutes at 4°C. After tetramer staining the cells were washed and stained with surface antibodies for CD3 (aCD3-APC-Cy7(1:50)), CD8 (αCD8-PE-Cy7 (1:300)) and CD4 (αCD4-BV785 (1:100)) for 30 minutes at 4°C. Samples were then washed once with staining buffer, stained with Propidium iodide for dead cell exclusion (1:60), and analyzed by flow cytometry. Gates for expression of different markers and tetramers were determined based on fluorescence minus one (FMO) samples for each color after dead cell exclusion, and doublet discrimination.
Culture of Human Breast TIL and Tetramer Based Detection of Neoantigens in Human Breast TIL Culture
The identification of mutated-KIAA0368-reactive T cells in a patient with metastatic breast cancer has been described previously (Zacharakis et al., 2018). Briefly, TIL from a metastatic tumor lesion were isolated and cocultured with the patient’s APCs pulsed with peptides or transfected with tandem minigenes (TMGs) expressing all autologous somatic mutations. Following an 18 h or longer coculture, the recognition of mutated KIAA0368 (p.S186F) was identified by IFNγ secretion (ELISPOT) and 4-1BB upregulation by the reactive CD8+ TIL. Further experimentation verified the predicted epitope MPYGYVLNEF, restricted by HLA-B*35:01 to be the minimal antigenic determinant.
The frequency of mutKIAA0368-reactive T cells following REP in the presence of p38 inhibitor (or vehicle) was assessed by flow cytometry following staining with HLA-B35:01/ MPYGYVLNEF tetramer (APC-conjugated, MBL international corporation). Specifically, 5 x 10⁶ TIL from each condition were washed and resuspended in FACS buffer (PBS supplemented with 2 mM EDTA and 2.5% FBS), followed by surface staining with the above mutKIAA0368 tetramer, αCD3-APC-Cy7 (BD Biosciences) and αCD8-AF700 (BD Biosciences) (all in dilution 1:20), for 30min at 4°C. The cells were then washed twice with cold FACS buffer and finally resuspended in FACS buffer containing propidium iodide (PI: 1 μg/ml, Sigma Aldrich). All data acquisition was performed using a BD FACS Canto II flow cytometer (BD Biosciences), and data analysis was performed using the FlowJo software (FlowJo, LLC).
NY-ESO-1 T cell Receptor Transduction and Cytotoxicity Assay to Determine Intracellular Cytokine Production
Clinical-grade NY-ESO-1 TCR T cells were produced from 5 healthy donors in independent experiments using a retroviral vector encoding murine NY-ESO-1 T cell receptor (Rosati et al., 2014). Total unfractionated PBMC were used for receptor engineering experiments to mimic source cells used in current clinical protocols. PBMC were resuspended at a density of 1 x 10⁶ cells/ml in lymphocyte stimulation media (AIM V medium, 100U/ml penicillin, 100μg/ml streptomycin, 5% human serum, 300 IU/ml IL-2) and were stimulated with 50 ng/ml OKT3 in the presence or absence of 0.5 μM p38 inhibitor for 2 days. The cells were retrovirally transduced with mNY-ESO-1 TCR retroviral on days 2 and 3. Briefly, 6-well non-TC plates were coated with 10 μg/ml RetroNectin® at 4°C overnight. The RetroNectin® coated plates were washed and blocked with 2 mls of 1% human albumin in 1X PBS at room temperature for 30 minutes and washed once with 2 mls of 1X HBSS containing 2.5% HEPES, pH 7.0 (v/v). Approximately 4 mls of retroviral supernatant were added to each RetroNectin® coated well and centrifuged at 32°C. Retroviral supernatant was then removed, and 5 x 10⁶ activated PBLs were resuspended in lymphocyte growth medium supplemented with 300 IU/ml IL-2, and 5% human serum (without OKT3) in the presence or absence of 500 nM p38i. The cells were incubated at 37°C, 5% CO2 incubator overnight, and a second round of transduction was carried out on day 3. The cells were transferred to a new plate a day after the transduction.The transduction efficiency was measured on day 10 of the culture by assessing the expression of the mTCR by staining with an anti-mouse TCR antibody using flow cytometry. mNY-ESO-1 TCR transduced effector T cells were expanded on day 10 using the rapid expansion protocol. Briefly, 105 effector T cells were expanded in the presence of 2 x 10⁷ irradiated (50 Gy) allogeneic feeder cells at a 200:1 ratio using 30 ng/mL OKT3 (anti-CD3) antibody (Miltenyi Biotec) and 300 IU/mL IL2 in the presence or absence of 0.5 μM p38 inhibitor BIRB796.
Transduced T cells were collected on day 22, and their ability to produce IFNγ and TNFα was measured by co-culturing the T-cells with NY-ESO-1 expressing (NY-ESO+HLA-A*02+) target tumor cells Mel1300 and Mel624 in cytokine free complete human media. Media alone or a NY-ESO-1 non-expressing (NY-ESO− HLA-A*02+) Mel526 cell line were used to assess baseline cytokine production and cytokine production against irrelevant targets, respectively. After an hour of incubation, monensin and brefeldin A (BD Biosciences) were added to the cultures to facilitate intracellular staining of cytokines. The cells were harvested after 5 h and stained for IFNγ and TNFα expression by intracellular flow staining.
αCD19-CAR T Cells Transduction and Cytotoxicity Assay
Clinical-grade αCD19-CAR T cells were produced from seven healthy donors in independent experiments using retroviral vector MSGV-FMC63-28Z encoding the anti-CD19 CAR as previously reported (Kochenderfer et al., 2010a). T cells were transduced and expanded in either presence or absence of 0.5 μM p38i. On day 8-10 of first stimulation, transduced CAR T cells were stimulated with irradiated allogeneic feeders at an effector:feeder ratio of 1:200 and expanded for another 10 days in the presence of 300 IU/mL IL2. Finally, CAR T cells were cocultured overnight with CD19+ NAML6 at an effector to target (E:T) ratio of 0.5 or 1 to determine the specific cytolytic efficacy of αCD19 CAR T cells.
For target-specific cytokine release assay, αCD19 CAR transduced cells were cocultured with CD19+ NALM6 or CD19− CCRL CEM cells in the presence of monensin and brefeldin A for 6 h (BD Biosciences). Cytokine production was measured using intracellular staining protocol for IFNγ and TNFα following manufacturer’s instructions (BD Biosciences).
Sample Preparation for ImmunoSeq TCR-Vβ Deep Sequencing
Bulk T cells from either baseline cultures (prior to REP) or day 20 REP TIL cells cultured in the presence of vehicle or p38 inhibitor were pelleted and snap-frozen. TCR-Vβ deep sequencing was performed on these T cells by ImmunoSeq, Adaptive Biotechnologies (Seattle, WA). Sequencing data were analyzed using the ImmunoSeq Analyzer (Adaptive Biotechnologies). Only productive TCR rearrangements were utilized in the calculations of TCR-Vβ frequencies.
QUANTIFICATION AND STATISTICAL ANALYSIS
Experimental sample sizes were based on previous experience of variability in similar experiments. Samples that had undergone technical failure during processing were excluded from analyses. Unless otherwise specified, statistical tests were performed using a two-tailed Student’s t-test. Unless otherwise indicated, a p value less than or equal to 0.05 was considered statistically significant for all analyses, and not corrected for multiple comparisons. To compare multiple groups, we used an analysis of variance (ANOVA) with the Bonferroni correction. All group results are represented as mean ± SEM, if not stated otherwise. Prism (GraphPad Software Inc.) was used for these analyses.
Supplementary Material
Significance.
Advances in the use of adoptive T cell transfer-based (ACT) immunotherapy for cancer have revealed the need for improved quantity and quality of infusion products. Using CRISPR-Cas9, we gene edited and functionally tested T cells for therapeutically effective T cell qualities. Our screen identified that perturbation of p38a resulted in T cells with robust cellular expansion and with limited oxidative and genomic stress and terminal differentiation. Expansion of human T cells with a pharmacological inhibitor of p38 (p38i) resulted in the generation of CD62L+CD27high T cells with boosted tumor-specific cytolysis. Finally, p38i-conditioned TCR and CAR gene-engineered cells were more effective in mouse models of established tumors, illustrating potential use of p38i at improving the anti-tumor functionalities of T cells for ACT.
Highlights.
Expansion, memory, and oxidative and genomic stress define effective anti-tumor T cells
Multi-phenotype CRISPR-Cas9 screen reveals functional role of TCR-driven kinases
p38 regulates memory, redox homeostasis, and anti-tumor function of T cells
p38 is established as a target for improving TCR and CAR adoptive T cell therapies
ACKNOWLEDGMENTS
The research was supported by the Intramural Research Program of the NCI, and by the Cancer Moonshot program for the Center for Cell-based Therapy at the NCI, NIH. The work was also supported by the Milken Family Foundation. The work presented here was entirely performed at the NIH. We thank S.A. Rosenberg, J. Ashwell, and A. Nussenzweig for their valuable discussions and intellectual input, Z. Franco, L.L. Parker, A. Navi, M. Langhan, R. Yoseph, G. Cafri, R. Somerville, D. Deniger, Y. Huang, A. Lalani, and P.H. Lee for helpful discussions in this project. We thank E. He for the illustrations. We thank S. Farid and A. Mixon in the flow cytometry facility of the Surgery Branch. We thank J. Shetty and B. Tran for help with sequencing work. All sequencing work was conducted at the Frederick National Laboratory for Cancer Research (FNLCR) at the CCR Sequencing Facility, NCI, NIH, Frederick. This work used the computational resources of the NIH HPC Biowulf cluster (http://hpc.nih.gov).
Footnotes
SUPPLEMENTAL INFORMATION
Supplemental Information can be found online at https://doi.org/10.1016/j.ccell.2020.05.004.
DECLARATION OF INTERESTS
The work presented here was conducted entirely at NIH. S.K.V., R.J.K., and N.P.R. are employees of Lyell Immunopharma, and S.J.P. is an employee of NextCure Inc. A patent application has been filed based on some of the findings presented in this work. The authors declare no competing interests.
REFERENCES
- Araki K, Turner AP, Shaffer VO, Gangappa S, Keller SA, Bachmann MF, Larsen CP, and Ahmed R (2009). mTOR regulates memory CD8 T-cell differentiation. Nature 460, 108–112. [DOI] [PMC free article] [PubMed] [Google Scholar]
- Besser MJ, Shapira-Frommer R, Itzhaki O, Treves AJ, Zippel DB, Levy D, Kubi A, Shoshani N, Zikich D, Ohayon Y, et al. (2013). Adoptive transfer of tumor-infiltrating lymphocytes in patients with metastatic melanoma: intent-to-treat analysis and efficacy after failure to prior immunotherapies. Clin. Cancer Res 19, 4792–4800. [DOI] [PubMed] [Google Scholar]
- Cohen CJ, Gartner JJ, Horovitz-Fried M, Shamalov K, Trebska-McGowan K, Bliskovsky VV, Parkhurst MR, Ankri C, Prickett TD, Crystal JS, et al. (2015). Isolation of neoantigen-specific T cells from tumor and peripheral lymphocytes. J. Clin. Invest 125, 3981–3991. [DOI] [PMC free article] [PubMed] [Google Scholar]
- Crompton JG, Sukumar M, and Restifo NP (2014). Uncoupling T-cell expansion from effector differentiation in cell-based immunotherapy. Immunol. Rev 257, 264–276. [DOI] [PMC free article] [PubMed] [Google Scholar]
- Crompton JG, Sukumar M, Roychoudhuri R, Clever D, Gros A, Eil RL, Tran E, Hanada K.-i., Yu Z, Palmer DC, et al. (2015). Akt inhibition enhances expansion of potent tumor-specific lymphocytes with memory cell characteristics. Cancer Res. 75, 296. [DOI] [PMC free article] [PubMed] [Google Scholar]
- Cuenda A, and Rousseau S (2007). p38 MAP-kinases pathway regulation, function and role in human diseases. Biochim. Biophys. Acta 1773, 1358–1375. [DOI] [PubMed] [Google Scholar]
- Doench JG, Fusi N, Sullender M, Hegde M, Vaimberg EW, Donovan KF, Smith I, Tothova Z, Wilen C, Orchard R, et al. (2016). Optimized sgRNA design to maximize activity and minimize off-target effects of CRISPR-Cas9. Nat. Biotechnol 34, 184. [DOI] [PMC free article] [PubMed] [Google Scholar]
- Dudley ME, Wunderlich JR, Shelton TE, Even J, and Rosenberg SA (2003). Generation of tumor-infiltrating lymphocyte cultures for use in adoptive transfer therapy for melanoma patients. J. Immunother 26, 332–342. [DOI] [PMC free article] [PubMed] [Google Scholar]
- Eil R, Vodnala SK, Clever D, Klebanoff CA, Sukumar M, Pan JH, Palmer DC, Gros A, Yamamoto TN, Patel SJ, et al. (2016). Ionic immune suppression within the tumour microenvironment limits T cell effector function. Nature 537, 539–543. [DOI] [PMC free article] [PubMed] [Google Scholar]
- Eylar E, Rivera-Quinones C, Molina C, Baez I, Molina F, and Mercado CM (1993). N-Acetylcysteine enhances T cell functions and T cell growth in culture. Int. Immunol 5, 97–101. [DOI] [PubMed] [Google Scholar]
- Ferguson FM, and Gray NS (2018). Kinase inhibitors: the road ahead. Nat. Rev. Drug Discov 17, 353–377. [DOI] [PubMed] [Google Scholar]
- Fraietta JA, Lacey SF, Orlando EJ, Pruteanu-Malinici I, Gohil M, Lundh S, Boesteanu AC, Wang Y, O’Connor RS, Hwang WT, et al. (2018). Determinants of response and resistance to CD19 chimeric antigen receptor (CAR) T cell therapy of chronic lymphocytic leukemia. Nat. Med 24, 563–571. [DOI] [PMC free article] [PubMed] [Google Scholar]
- Gattinoni L, Lugli E, Ji Y, Pos Z, Paulos CM, Quigley MF, Almeida JR, Gostick E, Yu Z, and Carpenito C (2011). A human memory T cell subset with stem cell-like properties. Nat. Med 17, 1290. [DOI] [PMC free article] [PubMed] [Google Scholar]
- Goff SL, Dudley ME, Citrin DE, Somerville RP, Wunderlich JR, Danforth DN, Zlott DA, Yang JC, Sherry RM, Kammula US, et al. (2016). Randomized, prospective evaluation comparing intensity of lymphodepletion before adoptive transfer of tumor-infiltrating lymphocytes for patients with metastatic melanoma. J. Clin. Oncol 34, 2389–2397. [DOI] [PMC free article] [PubMed] [Google Scholar]
- Gros A, Parkhurst MR, Tran E, Pasetto A, Robbins PF, Ilyas S, Prickett TD, Gartner JJ, Crystal JS, and Roberts IM (2016). Prospective identification of neoantigen-specific lymphocytes in the peripheral blood of melanoma patients. Nat. Med 22, 433. [DOI] [PMC free article] [PubMed] [Google Scholar]
- Henson SM, Macaulay R, Riddell NE, Nunn CJ, and Akbar AN (2015). Blockade of PD-1 or p38 MAP kinase signaling enhances senescent human CD8+ T-cell proliferation by distinct pathways. Eur. J. Immunol 45, 1441–1451. [DOI] [PubMed] [Google Scholar]
- Hinrichs CS, and Rosenberg SA (2014). Exploiting the curative potential of adoptive T-cell therapy for cancer. Immunol. Rev 257, 56–71. [DOI] [PMC free article] [PubMed] [Google Scholar]
- Jacoby E, Yang Y, Qin H, Chien CD, Kochenderfer JN, and Fry TJ (2016). Murine allogeneic CD19 CAR T cells harbor potent antileukemic activity but have the potential to mediate lethal GVHD. Blood 127, 1361–1370. [DOI] [PMC free article] [PubMed] [Google Scholar]
- Kesarwani P, Murali AK, Al-Khami AA, and Mehrotra S (2013). Redox regulation of T-cell function: from molecular mechanisms to significance in human health and disease. Antioxid. Redox Signal 18, 1497–1534. [DOI] [PMC free article] [PubMed] [Google Scholar]
- Klebanoff CA, Crompton JG, Leonardi AJ, Yamamoto TN, Chandran SS, Eil RL, Sukumar M, Vodnala SK, Hu J, Ji Y, et al. (2017). Inhibition of AKT signaling uncouples T cell differentiation from expansion for receptor-engineered adoptive immunotherapy. JCI Insight 2, 10.1172/jci.insight.95103. [DOI] [PMC free article] [PubMed] [Google Scholar]
- Klebanoff CA, Gattinoni L, Palmer DC, Muranski P, Ji Y, Hinrichs CS, Borman ZA, Kerkar SP, Scott CD, and Finkelstein SE (2011). Determinants of successful CD8+ T-cell adoptive immunotherapy for large established tumors in mice. Clin. Cancer Res 17, 5343–5352. [DOI] [PMC free article] [PubMed] [Google Scholar]
- Kochenderfer JN, Wilson WH, Janik JE, Dudley ME, Stetler-Stevenson M, Feldman SA, Maric I, Raffeld M, Nathan D-AN, Lanier BJ, et al. (2010a). Eradication of B-lineage cells and regression of lymphoma in a patient treated with autologous T cells genetically engineered to recognize CD19. Blood 116, 4099–4102. [DOI] [PMC free article] [PubMed] [Google Scholar]
- Kochenderfer JN, Yu Z, Frasheri D, Restifo NP, and Rosenberg SA (2010b). Adoptive transfer of syngeneic T cells transduced with a chimeric antigen receptor that recognizes murine CD19 can eradicate lymphoma and normal B cells. Blood 116, 3875–3886. [DOI] [PMC free article] [PubMed] [Google Scholar]
- Kuma Y, Sabio G, Bain J, Shpiro N, Márquez R, and Cuenda A (2005). BIRB796 inhibits all p38 MAPK isoforms in vitro and in vivo. J. Biol. Chem 280, 19472–19479. [DOI] [PubMed] [Google Scholar]
- Lanna A, Henson SM, Escors D, and Akbar AN (2014). AMPK-TAB1 activated p38 drives human T cell senescence. Nat. Immunol 15, 965. [DOI] [PMC free article] [PubMed] [Google Scholar]
- Liu X, Mo W, Ye J, Li L, Zhang Y, Hsueh EC, Hoft DF, and Peng G (2018). Regulatory T cells trigger effector T cell DNA damage and senescence caused by metabolic competition. Nat. Commun 9, 249. [DOI] [PMC free article] [PubMed] [Google Scholar]
- Love MI, Huber W, and Anders S (2014). Moderated estimation of fold change and dispersion for RNA-seq data with DESeq2. Genome Biol. 15, 550. [DOI] [PMC free article] [PubMed] [Google Scholar]
- Overwijk WW, Theoret MR, Finkelstein SE, Surman DR, de Jong LA, Vyth-Dreese FA, Dellemijn TA, Antony PA, Spiess PJ, Palmer DC, et al. (2003). Tumor regression and autoimmunity after reversal of a functionally tolerant state of self-reactive CD8+ T cells. J. Exp. Med 198, 569–580. [DOI] [PMC free article] [PubMed] [Google Scholar]
- Patel SJ, Sanjana NE, Kishton RJ, Eidizadeh A, Vodnala SK, Cam M, Gartner JJ, Jia L, Steinberg SM, Yamamoto TN, et al. (2017). Identification of essential genes for cancer immunotherapy. Nature 548, 537–542. [DOI] [PMC free article] [PubMed] [Google Scholar]
- Pilipow K, Scamardella E, Puccio S, Gautam S, De Paoli F, Mazza EM, De Simone G, Polletti S, Buccilli M, Zanon V, et al. (2018). Antioxidant metabolism regulates CD8+ T memory stem cell formation and antitumor immunity. JCI Insight 3, 10.1172/jci.insight.122299. [DOI] [PMC free article] [PubMed] [Google Scholar]
- Postow MA, Manuel M, Wong P, Yuan J, Dong Z, Liu C, Perez S, Tanneau I, Noel M, and Courtier A (2015). Peripheral T cell receptor diversity is associated with clinical outcomes following ipilimumab treatment in metastatic melanoma. J. Immunother. Cancer 3, 23. [DOI] [PMC free article] [PubMed] [Google Scholar]
- Robinson MD, McCarthy DJ, and Smyth GK (2010). edgeR: a Bioconductor package for differential expression analysis of digital gene expression data. Bioinformatics 26, 139–140. [DOI] [PMC free article] [PubMed] [Google Scholar]
- Rogakou EP, Pilch DR, Orr AH, Ivanova VS, and Bonner WM (1998). DNA double-stranded breaks induce histone H2AX phosphorylation on serine 139. J. Biol. Chem 273, 5858–5868. [DOI] [PubMed] [Google Scholar]
- Rolf J, Zarrouk M, Finlay DK, Foretz M, Viollet B, and Cantrell DA (2013). AMPKα1: a glucose sensor that controls CD8 T-cell memory. Eur. J. Immunol 43, 889–896. [DOI] [PMC free article] [PubMed] [Google Scholar]
- Rosati SF, Parkhurst MR, Hong Y, Zheng Z, Feldman SA, Rao M, Abate-Daga D, Beard RE, Xu H, Black MA, et al. (2014). A novel murine T-cell receptor targeting NY-ESO-1. J. Immunother 37, 135–146. [DOI] [PMC free article] [PubMed] [Google Scholar]
- Rosenberg SA, and Restifo NP (2015). Adoptive cell transfer as personalized immunotherapy for human cancer. Science 348, 62–68. [DOI] [PMC free article] [PubMed] [Google Scholar]
- Rosenberg SA, Yang JC, Sherry RM, Kammula US, Hughes MS, Phan GQ, Citrin DE, Restifo NP, Robbins PF, Wunderlich JR, et al. (2011). Durable complete responses in heavily pretreated patients with metastatic melanoma using T-cell transfer immunotherapy. Clin. Cancer Res 17, 4550–4557. [DOI] [PMC free article] [PubMed] [Google Scholar]
- Scheffel MJ, Scurti G, Wyatt MM, Garrett-Mayer E, Paulos CM, Nishimura MI, and Voelkel-Johnson C (2018). N-Acetyl cysteine protects anti-melanoma cytotoxic T cells from exhaustion induced by rapid expansion via the downmodulation of Foxo1 in an Akt-dependent manner. Cancer Immunol. Immunother 67, 691–702. [DOI] [PMC free article] [PubMed] [Google Scholar]
- Sena LA, Li S, Jairaman A, Prakriya M, Ezponda T, Hildeman DA, Wang CR, Schumacker PT, Licht JD, Perlman H, et al. (2013). Mitochondria are required for antigen-specific T cell activation through reactive oxygen species signaling. Immunity 38, 225–236. [DOI] [PMC free article] [PubMed] [Google Scholar]
- Singer M, Wang C, Cong L, Marjanovic ND, Kowalczyk MS, Zhang H, Nyman J, Sakuishi K, Kurtulus S, and Gennert D (2016). A distinct gene module for dysfunction uncoupled from activation in tumor-infiltrating T cells. Cell 166, 1500–1511.e9. [DOI] [PMC free article] [PubMed] [Google Scholar]
- Sukumar M, Liu J, Mehta GU, Patel SJ, Roychoudhuri R, Crompton JG, Klebanoff CA, Ji Y, Li P, Yu Z, et al. (2016). Mitochondrial membrane potential identifies cells with enhanced stemness for cellular therapy. Cell Metab. 23, 63–76. [DOI] [PMC free article] [PubMed] [Google Scholar]
- Tan H, Yang K, Li Y, Shaw TI, Wang Y, Blanco DB, Wang X, Cho J-H, Wang H, and Rankin S (2017). Integrative proteomics and phospho-proteomics profiling reveals dynamic signaling networks and bioenergetics pathways underlying T cell activation. Immunity 46, 488–503. [DOI] [PMC free article] [PubMed] [Google Scholar]
- Tang J, Hubbard-Lucey VM, Pearce L, O’Donnell-Tormey J, and Shalabi A (2018). The global landscape of cancer cell therapy. Nat. Rev. Drug Discov 17, 465–466. [DOI] [PubMed] [Google Scholar]
- Tran E, Robbins PF, and Rosenberg SA (2017). ‘Final common pathway’ of human cancer immunotherapy: targeting random somatic mutations. Nat. Immunol 18, 255–262. [DOI] [PMC free article] [PubMed] [Google Scholar]
- van der Windt GJ, Everts B, Chang C-H, Curtis JD, Freitas TC, Amiel E, Pearce EJ, and Pearce EL (2012). Mitochondrial respiratory capacity is a critical regulator of CD8+ T cell memory development. Immunity 36, 68–78. [DOI] [PMC free article] [PubMed] [Google Scholar]
- van der Windt GJW, Chang C-H, and Pearce EL (2016). Measuring bioenergetics in T cells using a seahorse extracellular flux analyzer. Curr. Protoc. Immunol 113, 3.16B.11–13.16B.14. [DOI] [PMC free article] [PubMed] [Google Scholar]
- Yamamoto TN, Kishton RJ, and Restifo NP (2019). Developing neoantigen-targeted T cell-based treatments for solid tumors. Nat. Med 25, 1488–1499. [DOI] [PubMed] [Google Scholar]
- Yang Y, Kohler ME, Chien CD, Sauter CT, Jacoby E, Yan C, Hu Y, Wanhainen K, Qin H, and Fry TJ (2017). TCR engagement negatively affects CD8 but not CD4 CAR T cell expansion and leukemic clearance. Sci Transl Med 9. [DOI] [PMC free article] [PubMed] [Google Scholar]
- Zacharakis N, Chinnasamy H, Black M, Xu H, Lu YC, Zheng Z, Pasetto A, Langhan M, Shelton T, Prickett T, et al. (2018). Immune recognition of somatic mutations leading to complete durable regression in metastatic breast cancer. Nat. Med 24, 724–730. [DOI] [PMC free article] [PubMed] [Google Scholar]
- Zhao Y, Zheng Z, Robbins PF, Khong HT, Rosenberg SA, and Morgan RA (2005). Primary human lymphocytes transduced with NY-ESO-1 antigen-specific TCR genes recognize and kill diverse human tumor cell lines. J. Immunol 174, 4415–4423. [DOI] [PMC free article] [PubMed] [Google Scholar]
Associated Data
This section collects any data citations, data availability statements, or supplementary materials included in this article.
Supplementary Materials
Data Availability Statement
RNA sequencing data generated during this study are available at the NCBI-GEO database with the project accession ID GEO: GSE114087. The published article includes all datasets generated or analyzed during this study.