

This systematic review and meta-analysis explores differences of the face processing system in autism spectrum disorder, as measured by the face inversion effect, across multiple mechanistic levels.
Key Points
Question
Do autistic individuals show a face inversion effect?
Findings
This systematic review and bayesian meta-analysis of 38 studies comparing face processing of upright and inverted faces in autistic and neurotypical individuals found reduced face inversion effect in autistic individuals.
Meaning
This reduced face inversion effect in autism suggests less specialization or expertise of the face processing system, particularly in recognizing emotion from faces as measured in behavioral paradigms.
Abstract
Importance
Face processing is foundational to human social cognition, is central to the hallmark features of autism spectrum disorder (ASD), and shapes neural systems and social behavior. Highly efficient and specialized, the face processing system is sensitive to inversion, demonstrated by reduced accuracy in recognition and altered neural response to inverted faces. Understanding at which mechanistic level the autistic face processing system may be particularly different, as measured by the face inversion effect, will improve overall understanding of brain functioning in autism.
Objective
To synthesize data from the extant literature to determine differences of the face processing system in ASD, as measured by the face inversion effect, across multiple mechanistic levels.
Data Sources
Systematic searches were conducted in the MEDLINE, Embase, Web of Science, and PubMed databases from inception to August 11, 2022.
Study Selection
Original research that reported performance-based measures of face recognition to upright and inverted faces in ASD and neurotypical samples were included for quantitative synthesis. All studies were screened by at least 2 reviewers.
Data Extraction and Synthesis
This systematic review and meta-analysis was conducted according to the 2020 Preferred Reporting Items for Systematic Reviews and Meta-analyses (PRISMA) reporting guideline. Multiple effect sizes were extracted from studies to maximize information gain and statistical precision and used a random-effects, multilevel modeling framework to account for statistical dependencies within study samples.
Main Outcomes and Measures
Effect sizes were calculated as a standardized mean change score between ASD and neurotypical samples (ie, Hedges g). The primary outcome measure was performance difference between upright and inverted faces during face recognition tasks. Measurement modality, psychological construct, recognition demand, sample age, sample sex distribution, and study quality assessment scores were assessed as moderators.
Results
Of 1768 screened articles, 122 effect sizes from 38 empirical articles representing data from 1764 individual participants (899 ASD individuals and 865 neurotypical individuals) were included in the meta-analysis. Overall, face recognition performance differences between upright and inverted faces were reduced in autistic individuals compared with neurotypical individuals (g = −0.41; SE = 0.11; 95% credible interval [CrI], −0.63 to −0.18). However, there was considerable heterogeneity among effect sizes, which were explored with moderator analysis. The attenuated face inversion effect in autistic individuals was more prominent in emotion compared with identity recognition (b = 0.46; SE = 0.26; 95% CrI, −0.08 to 0.95) and in behavioral compared with electrophysiological measures (b = 0.23; SE = 0.24; 95% CrI, −0.25 to 0.70).
Conclusions and Relevance
This study found that on average, face recognition in autism is less impacted by inversion. These findings suggest less specialization or expertise of the face processing system in autism, particularly in recognizing emotion from faces as measured in behavioral paradigms.
Introduction
Face perception, the ability to encode, discriminate, and recognize the faces of others, is a foundational social skill that develops within the first years of life1 and relies on an extensive network of cortical and subcortical neural systems.2,3 It is a necessary precursor for the development of social cognition4 and is central to hallmark characteristics of autism.5 Given the importance and centrality of faces to human development, humans develop highly specialized and efficient mechanisms for processing this class of social stimuli, but this specialization is specific to upright faces. The face inversion effect (FIE), the disproportionate performance cost associated with processing inverted compared with upright faces, is one of the most reliable markers of face expertise detectable across multiple measurement modalities (behavior, neural, and electrophysiological) and psychological constructs (identity and emotion recognition). For example, inverted compared with upright faces are more difficult to recognize,6,7,8 produce reduced hemodynamic brain responses in the fusiform face area,9,10 and generate significantly larger and slower electrophysiological brain responses.11,12,13 This inversion cost is widely attributed to the disruption of the canonical configuration of facial features to which face processing mechanisms are attuned (eg, holistic processing).6,14,15
Reduced face specialization in autism, including reduced use of configural or holistic processing, is cited as one mechanism by which autistic individuals struggle to recognize faces as efficiently and as accurately as their neurotypical peers. Reduced configural or holistic processing is generally supported by a reduced FIE in autism16,17,18; however, these findings are not ubiquitous19 and may systematically vary across measurement modalities, psychological constructs, recognition demands, and sample age groups. For example, when assessing behavioral task performance (accuracy), numerous studies do not find differential inversion effects between autistic and neurotypical individuals,20,21,22,23,24,25 but these findings are not universal.16,17,18,26,27 Similarly, differential neural response to upright and inverted faces as measured by the N170 event-related potential (eg, longer latency and larger amplitude to inverted compared with upright faces) or functional magnetic resonance imaging (reduced brain signal to inverted compared with upright faces) may be preserved in autism,27,28 but numerous studies show otherwise.29,30,31
This literature indicates that both behavioral and brain studies of the FIE in autism show heterogeneous results that have prevented conclusive determination of its presence in this population. The primary goal of this investigation was to systematically evaluate the factors that influence the magnitude of the FIE in autism. Given small sample sizes and methodological- and sample-related heterogeneity in published findings, we applied meta-analysis, moderation analysis, and meta-regression to synthesize and reconcile discrepant findings across the extant autism literature.
Methods
Study Search and Identification
We used the following search parameters in the MEDLINE, Embase, Web of Science, and PubMed databases from inception to August 11, 2022: (face OR faces OR facial) AND (inversion OR inverted OR “upside down” OR rotation OR holistic OR configural) AND (autism OR autistic OR ASD OR Asperger). In adherence with transparent and rigorous psychological practices,32 we identified, screened, and determined eligibility of empirical studies in accordance with the 2020 Preferred Reporting Items for Systematic Reviews and Meta-analyses (PRISMA) reporting guideline,33 including the content checklist (eTables 1 and 2 in Supplement 1) and study search flow diagram (Figure 1). A backward citation search was conducted for all studies meeting inclusion criteria.
Figure 1. Study Identification, Screening, and Inclusion Flow Diagram.

FR indicates face recognition.
Inclusion and Exclusion Criteria
All articles must have (1) been written in English; (2) included an autism sample (eg, autism, Asperger syndrome, autism spectrum disorder [ASD], autistic disorder, pervasive developmental disorder–not otherwise specified); (3) included a neurotypical control sample free of any neurological or neuropsychiatric conditions (eg, typically developing, healthy control); (4) included a measure of face processing requiring participants to view, discriminate, perceive, or recognize face stimuli in upright (canonical orientation) and inverted (180° picture rotation of upright) conditions; and (5) reported statistical information necessary for calculating the effect size between upright and inverted conditions (eg, Cohen d, t, mean, SD, N, SE).
Articles were excluded if they (1) were not an empirical study (eg, book chapter, systematic review) or (2) did not provide necessary statistical or methodological information following email request.
Study Screening
A total of 7 reviewers (J.W.G., M.A.A., S.C.-B., C.J.F., N.H., R.I., and L.H.R.) double screened all entries throughout our multiphase (title/abstract, full text, and backward title, abstract, and full-text screening) screening approach using standardized abstract and full-text screening tools (eMethods in Supplement 1). Disagreements were resolved through an experienced reviewer (J.W.G.). Team feedback was provided throughout screening to prevent coder drift and improve reliability among all reviewers.
Data Extraction
We extracted sample and methodological information used for moderator analysis (eMethods in Supplement 1) and group (ASD vs neurotypical) mean and SD values for upright and inverted conditions from the reported face recognition task paradigms. When not provided, they were calculated from other information (eg, SEs) or extracted from figures when appropriate.34 Data were requested directly from corresponding authors via email when data extraction was not possible. We extracted multiple effect sizes from studies when available; for example, studies often reported multiple FIE measures from different types of stimuli (grayscale faces, color faces, Mooney faces), emotional expressions (happy, sad, fearful, angry), and measurement sites (left and right hemispheres). All extracted data were double screened for accuracy by all reviewers; disagreements were resolved through consensus.
Quality Assessment
We used a modified version of the Newcastle-Ottawa Scale35 to assess the quality and risk of bias of included studies (eMethods in Supplement). Each included study was coded by J.W.G. and C.J.K.; disagreements were resolved through consensus.
Statistical Analysis
We calculated standardized mean change scores (upright – inverted) and the difference in standardized mean change scores (ASD – neurotypical) for each face recognition measure in each study36; standardized mean change scores were converted to Hedges g to account for small-study bias (eMethods in Supplement 1). We analyzed all data using the brms version 2.17 and rstan version 2.21.5 packages for the statistical software program R version 4.2.1 (R CoreTeam). For all analyses (main effect and moderator models), we used a bayesian random-effects multilevel framework to account for nonindependence in effect sizes by using a 3-level model: sampling variance of observed effect sizes, within-study variability, and between-study variability. Given inconsistency in the direction and magnitude of the FIE, we specified a weakly informative prior distribution centered on zero [N (0, 1)] to reflect our prior belief about the direction and magnitude of the FIE. For all variance parameters, we used a nonnegative half-Cauchy distribution [Cauchy (0, 0.3)] since variance estimates cannot be negative and the half-Cauchy distribution has desirable properties for psychological phenomena.37 A bayesian modeling framework provides distinct advantages over frequentist methods, including (1) integration of prior information; (2) improved estimation of parameters and sources of variation; and (3) direct interpretation of parameter estimates via the posterior probability distribution (PPD). We quantified heterogeneity across all levels using proportional measures of variability (I2).38 For all model coefficients, we reported 95% credible intervals (CrIs). We assessed small-study effects via funnel plot asymmetry by regressing the study-specific effect sizes onto their SEs (ie, modified Egger regression test) to account for the multilevel structure. Finally, we evaluated the presence of publication bias across study-averaged effect sizes and estimated the adjusted summary effect size using a 3-parameter selection model using the R package metafor.36
Finally, we augmented our 3-level modeling framework to evaluate the impact of measurement modality (behavior, neural), psychological construct (identity, emotion), recognition demand (perception, discrimination, recognition), sample age, sample IQ, sex distribution, and study quality assessment scores on FIE differences between autistic and neurotypical samples (see eMethods in Supplement 1 for full operationalization of these moderator variables).
Sensitivity Analysis
We conducted a series of sensitivity analyses related to prior distribution selection, correlation among upright and inverted conditions, and potential outlier/influential effect sizes. Bayesian inference can be sensitive to prior distribution selection; to test the robustness of our reported results, we compared all model results using a range of various generic prior distributions (eMethods in Supplement 1). Since the correlation between upright and inverted conditions was assumed to be moderate (r = 0.5), we compared all model results across a possible range of values (ie, r = 0.1, r = 0.3, r = 0.5, r = 0.7, r = 0.9). We conducted a leave-1-out analysis, fitting multiple meta-analyses, each excluding a single unique effect size to evaluate the robustness of our results to any single, potentially influential effect size. Finally, we also identified and evaluated the influence of outliers and influential cases for study-averaged effect sizes using dmetar.39
Results
The full study identification, screening, and selection process is displayed in Figure 1. Overall, we included 122 effect sizes from 38 studies representing data from 1764 unique individual participants (899 individuals with ASD and 865 neurotypical individuals). Each study included a mean (SD) of 3.21 (3.01) effect sizes, and the mean (SD) study sample age was 18.24 (3.91) years. Overall, the studies included a mean (SD) of 82.6% (12.5%) males and had a mean (SD) of 23.66 (32.19) autistic and 22.76 (18.35) neurotypical individuals. The individual study characteristics, including sample-related and methodological-related information, are displayed in Table 1.40,41,42,43,44,45,46,47,48,49,50,51,52,53,54,55,56,57,58,59,60,61,62,63,64
Table 1. Study Characteristics Including Sample- and Methodological-Related Information.
| Source | Autistic individuals | Neurotypical individuals | No. ES | QA | Measurement modality | Construct | Recognition demand | ||||||
|---|---|---|---|---|---|---|---|---|---|---|---|---|---|
| No. | Age, mean (SD), y | Male, % | IQ, mean (SD) | No. | Age, mean (SD), y | Male, % | IQ, mean (SD) | ||||||
| Tantam et al,18 1989 | 10 | 12.1 (3.1) | 80 | NA | 10 | 12.2 (3.1) | 90 | NA | 1 | 3 | Behavior | Emotion | Recognition |
| Grice et al,40 2001 | 8 | 36.3 | NA | NA | 8 | 30.9 | NA | NA | 1 | 0 | EEG | Identity | Perception |
| Teunisse and de Gelder,23 2003 | 17 | 19.4 (2.2) | 76.5 | NA | 24 | NA | 50 | NA | 2 | 1 | Behavior | Identity | Recognition |
| McPartland et al,29 2004 | 9 | 21.2 (8.3) | 88.9 | NA | 14 | 24.6 (6.3) | 92.9 | NA | 4 | 8 | EEG | Identity | Perception |
| Rouse et al,41 2004 | 11 | 9.6 (1.4) | 100 | NA | 15 | 9.4 (1.8) | 100 | NA | 2 | 4 | Behavior | Thatcher | Perception |
| Lahaie et al,19 2006 | 16 | 20.7 (4.7) | 93.8 | 108.7 (10.3) | 16 | 20.2 (3.5) | 93.8 | 109.6 (10.4) | 1 | 6 | Behavior | Identity | Recognition |
| Reed et al,42 2007 | 10 | 28 | 90 | 106.9 (11.8) | 14 | 34 | 57.1 | 106.9 (11.8) | 1 | 3 | Behavior | Identity | Recognition |
| Rose et al,17 2007 | 16 | 10.3 (1.6) | 81.2 | NA | 17 | 10 (1.9) | 88.2 | NA | 1 | 7 | Behavior | Identity | Recognition |
| Bookheimer et al,27 2008 | 12 | 11.3 (4) | 100 | NA | 12 | 11.9 (2.4) | 100 | NA | 3 | 6 | Behavior, Neuroimaging | Identity | Discrimination |
| Scherf et al,24 2008 | 15 | 11 (1) | 100 | 102 (15) | 15 | 12 (1) | 80 | 104 (7) | 2 | 7 | Behavior | Identity | Recognition |
| Wallace et al,43 2008 | 26 | 32 (9) | 88.5 | NA | 26 | 31 (9) | 88.5 | NA | 7 | 5 | Behavior | Emotion | Recognition |
| Annaz et al,44 2009 | 16 | 8.4 (1.8) | NA | NA | 25 | 7.2 (2.8) | 52 | NA | 6 | 3 | Behavior | Identity | Discrimination |
| Faja et al,22 2009 | 39 | 24 (7.4) | 92.3 | 111 (15) | 33 | 24.6 (7.1) | 90.9 | 110 (13) | 2 | 6 | Behavior | Identity | Recognition |
| Riby et al,45 2009 | 20 | 14.8 (2.4) | 80 | NA | 20 | 14.9 (2.2) | 70 | NA | 1 | 5 | Behavior | Thatcher | Discrimination |
| Rosset et al,46 2010 | 17 | 10.5 (2.8) | 82.4 | 93 (16) | 17 | 10.5 (2.7) | 82.4 | NA | 2 | 9 | Behavior | Identity | Discrimination |
| Hileman et al,47 2011 | 27 | 13.3 (2.8) | 85.2 | NA | 22 | 14.4 (2) | 81.8 | NA | 2 | 9 | EEG | Identity | Perception |
| McPartland et al,30 2011 | 32 | NA | NA | NA | 17 | NA | 88.2 | NA | 4 | 8 | EEG | Identity | Perception |
| McPartland et al,48 2011 | 15 | 14.5 (1.7) | 86.7 | NA | 17 | 14.5 (1.3) | 76.5 | NA | 1 | 8 | Behavior | Identity | Recognition |
| Kikuchi et al,49 2013 | 18 | 11.9 (1.8) | 94.4 | NA | 19 | 11.4 (2.3) | 68.4 | NA | 3 | 4 | Behavior | Emotion | Discrimination |
| Webb et al,31 2012 | 32 | 23.1 (6.9) | 93.8 | 111.3 (13.9) | 32 | 23.7 (6.7) | 90.6 | 110 (12.8) | 8 | 8 | EEG | Identity | Perception |
| Doi et al,50 2013 | 20 | 32.1 (7.3) | 100 | 104.2 (15.3) | 20 | 33.5 (4.7) | 100 | 107.2 (13.9) | 15 | 9 | Behavior | Emotion | Recognition |
| Ewing et al,20 2013 | 40 | 11.5 (2.2) | 82.5 | NA | 40 | 11.6 (2.7) | 82.5 | NA | 2 | 5 | Behavior | Identity | Discrimination, recognition |
| Khorrami et al,51 2013 | 14 | 14.8 (3.1) | NA | 102.3 (16.4) | 18 | 13.1 (2.8) | NA | 121.2 (15.1) | 2 | 10 | EEG | Identity | Perception |
| Zürcher et al,52 2013 | 16 | 23.5 (6.8) | 81.2 | NA | 18 | 25.8 (5.3) | 88.9 | NA | 2 | 4 | Behavior | Thatcher | Discrimination |
| Isomura et al,53 2014 | 19 | 10.2 (1.1) | 78.9 | 102.3 (15.1) | 18 | 10 (1.1) | 77.8 | 105.7 (13.4) | 2 | 5 | Behavior | Emotion | Recognition |
| O’Brien et al,54 2014 | 14 | 33.9 | 78.6 | NA | 14 | 31.1 | 50 | NA | 1 | 6 | Behavior | Identity | Recognition |
| Cleary et al,55 2015 | 14 | 13.7 (1.6) | 100 | NA | 14 | 14.2 (0.8) | 100 | NA | 1 | 3 | Behavior | Thatcher | Perception |
| Dimitriou et al,56 2015 | 16 | 8.4 (1.8) | 81.2 | NA | 25 | 7.2 (2.8) | 52 | NA | 8 | 3 | Behavior | Identity | Discrimination |
| Hedley et al,21 2015 | 26 | 28.9 (9.5) | 61.5 | 106.6 (15.1) | 33 | 25 (10) | 57.6 | 112.1 (9.3) | 1 | 7 | Behavior | Identity | Recognition |
| Tye et al,57 2015 | 6 | 22.3 (6.9) | 83.3 | 53.3 (30.8) | 13 | 29.8 (5.7) | 84.6 | NA | 4 | 7 | EEG | Identity | Perception |
| Neuhaus et al,58 2016 | 52 | 11.3 (4.4) | NA | 97.4 (19.8) | 66 | 10.1 (3.4) | NA | 116.5 (11.2) | 2 | 8 | EEG | Categorization | Perception |
| Tavares et al,28 2016 | 9 | 23.1 (7) | 100 | 95.2 (14.3) | 16 | 23.4 (5.1) | 100 | 103.1 (12.6) | 4 | 6 | EEG | Detection | Perception |
| Whyte et al,59 2016 | 13 | NA | NA | 112 (11) | 13 | NA | NA | 110 (12) | 1 | 7 | Behavior | Identity | Recognition |
| Castelhano et al,60 2018 | 10 | 23.1 (7) | 100 | 95.2 (14.3) | 10 | 23.4 (5.1) | 100 | 103.1 (12.6) | 3 | 6 | Behavior | Detection | Perception |
| Naumann et al,61 2018 | 19 | 14 (1.7) | 84.2 | 109.4 (13) | 19 | 13.9 (1.3) | 84.2 | 113.6 (17.1) | 5 | 9 | Behavior, EEG | Detection | Perception |
| Hadad et al,62 2019 | 19 | 23.7 | 63.2 | 107.7 (15.4) | 25 | 25.7 | 52 | 115.5 (8.8) | 10 | 4 | Behavior | Identity | Discrimination |
| Webb et al,63 2022 | 208 | NA | NA | NA | 114 | NA | NA | NA | 4 | 4 | EEG | Detection | Perception |
| Zhang et al,64 2022 | 12 | 5.6 (0.5) | 75 | NA | 11 | 4.1 (0.3) | 63.6 | NA | 1 | 5 | Behavior | Emotion | Discrimination |
Abbreviations: EEG, electroencephalogram; QA, quality assessment; NA, not available; No. ES, number of effect sizes represented by that moderator.
Do Autistic Individuals Show an FIE?
As expected, we found that neurotypical individuals showed strong evidence of an FIE (upright > inverted) across all studies (g = 0.95; SE = 0.17; 95% CrI, 0.63-1.30; 100% PPD upright > inverted). In contrast, we did not find strong evidence that autistic individuals showed the same advantage for upright compared with inverted face recognition (g = 0.52; SE = 0.11; 95% CrI, 0.31 to 0.76; 100% PPD upright > inverted). When comparing the FIE magnitude in ASD and neurotypical groups, we found strong evidence that the FIE was attenuated in ASD compared with neurotypical individuals (g = −0.41; SE = 0.11; 95% CrI, −0.63 to −0.18); 100% of the PPD was consistent with this interpretation (FIE for individuals with ASD < FIE for neurotypical individuals). As shown in Figure 2, there was a high degree of heterogeneity among effect sizes (I2 = 85.71%), including within-study variability (I2 = 25.5%) and moderate between-study variability (I2 = 60.21%). We evaluated if heterogeneity in findings could be systematically explained by potential moderators.
Figure 2. Forest Plot of Individual Effect Sizes of Face Inversion Effect (FIE) Differences in Autism Spectrum Disorder and Neurotypical Groups.
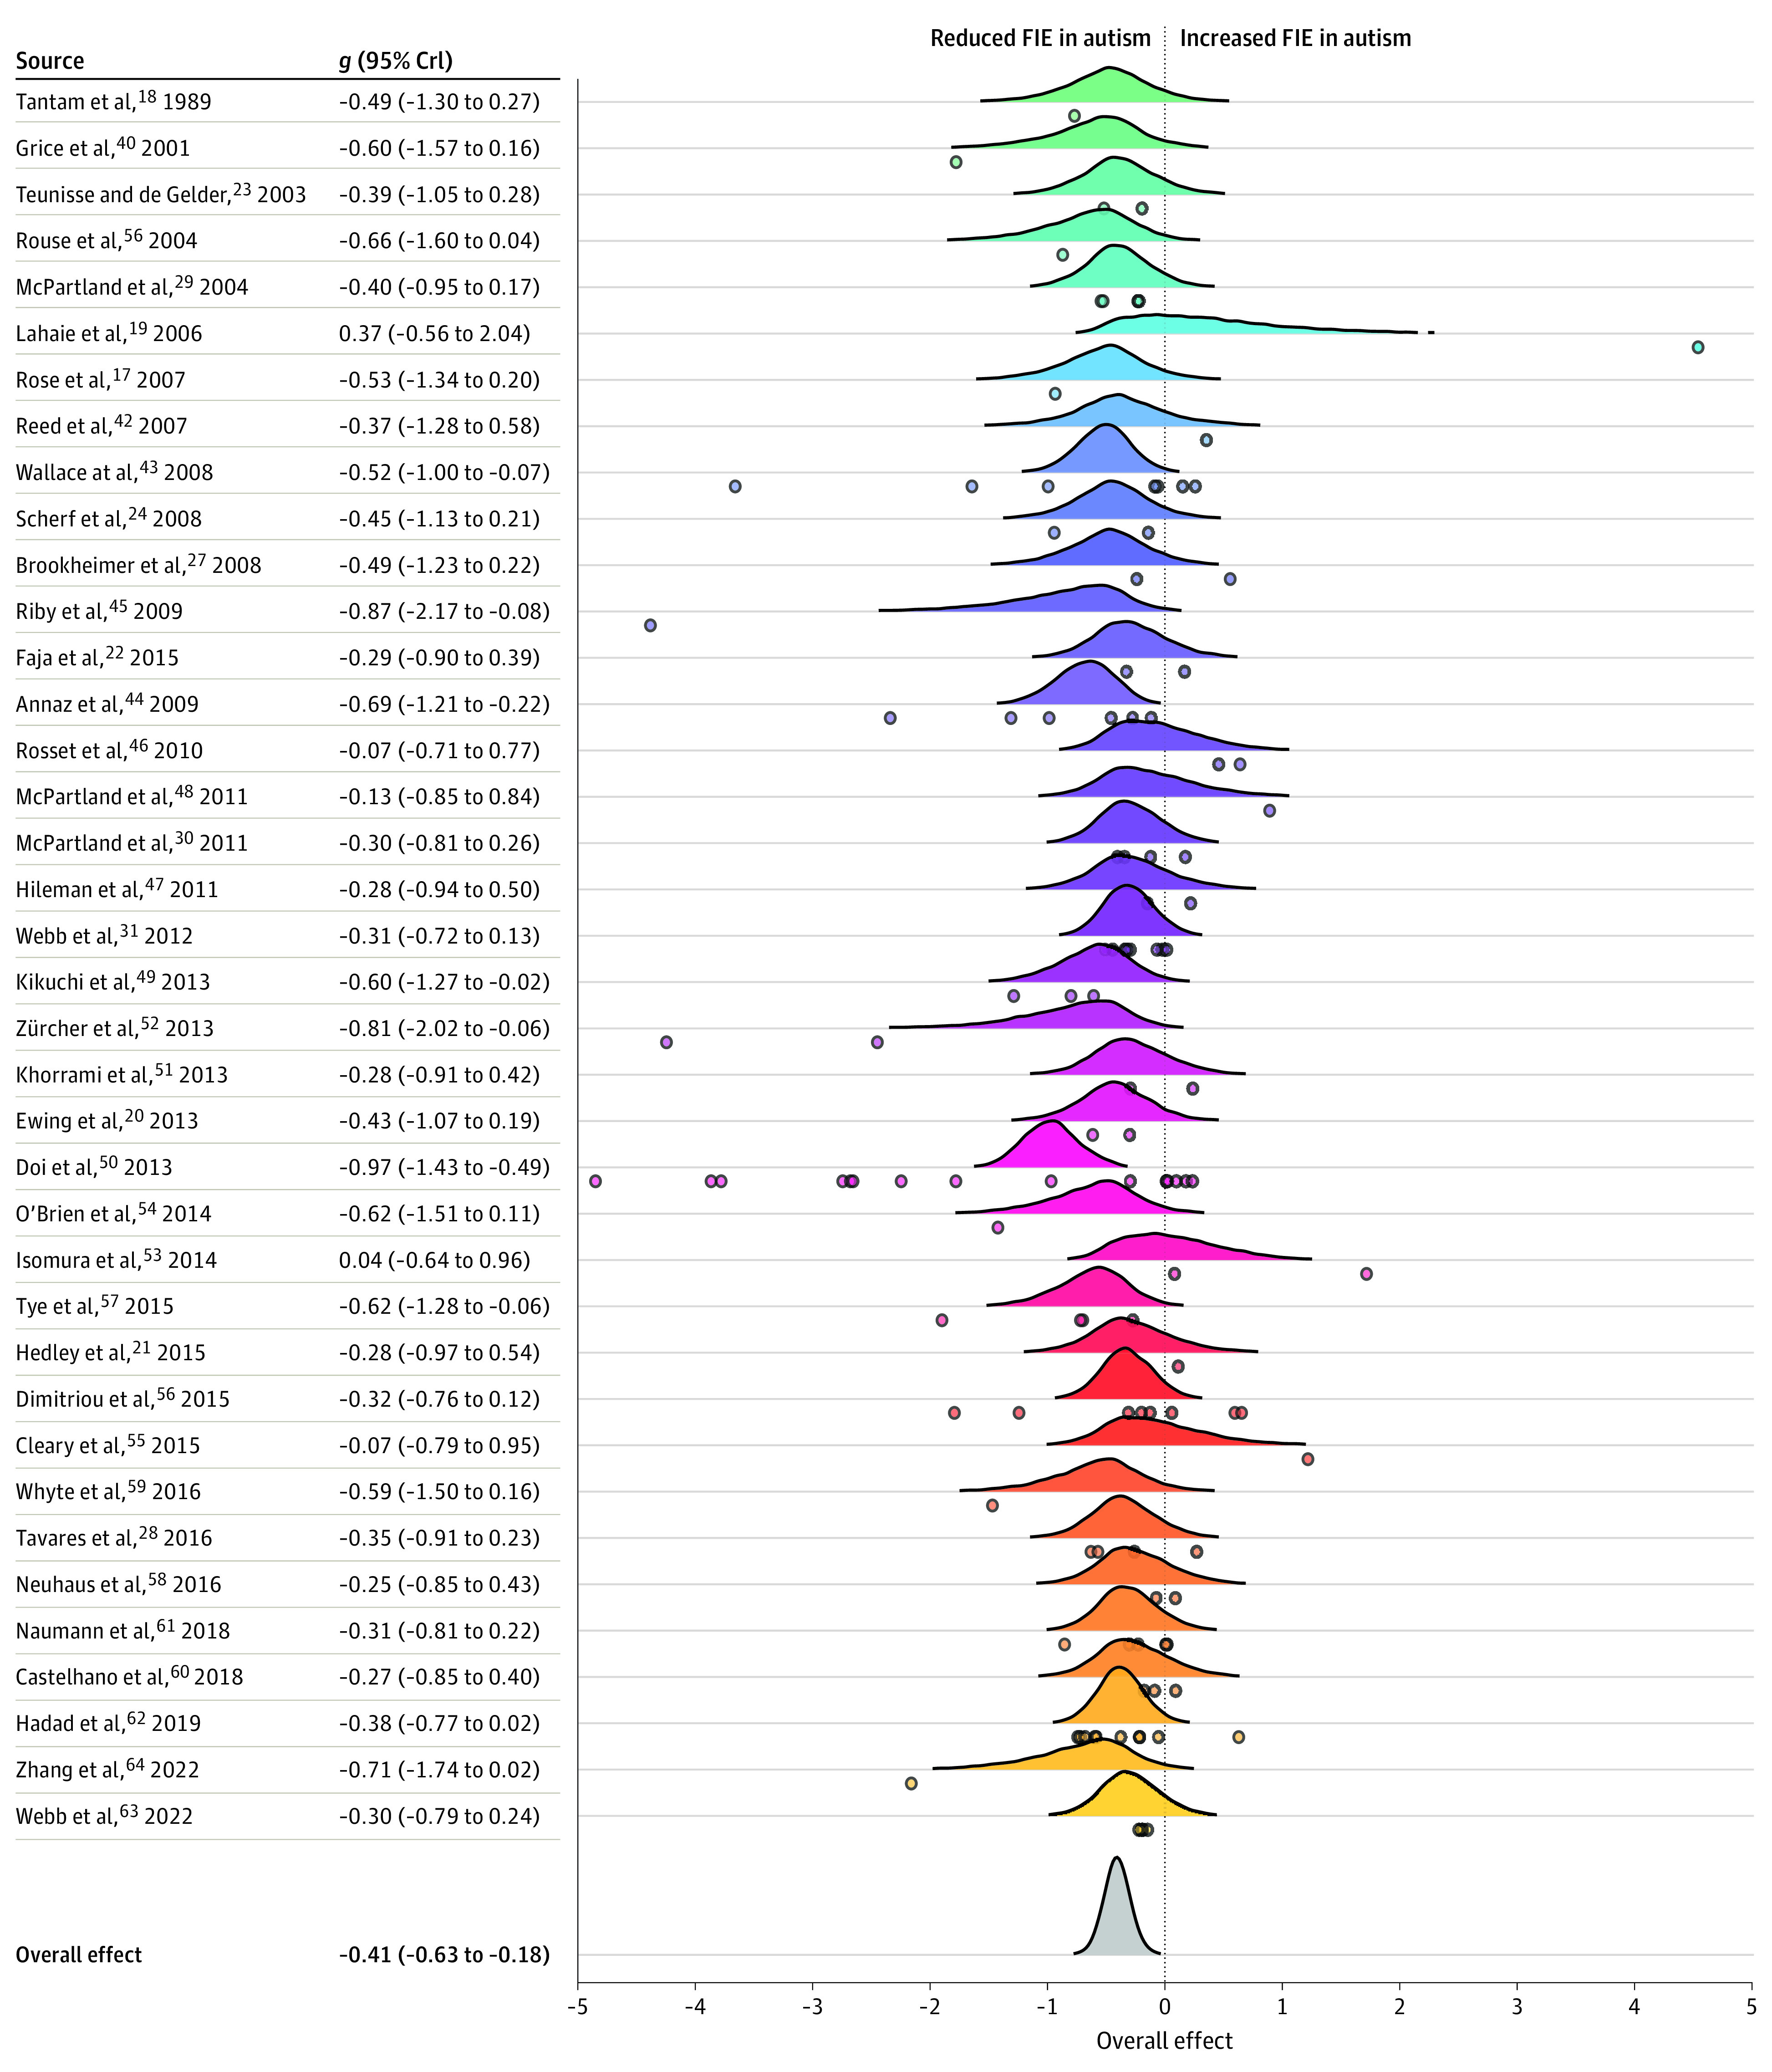
Meta-analysis forest plot of all unique studies (N = 38) depicting the mean difference in the FIE between autistic and neurotypical participants (Hedges g) for each study as represented by a posterior distribution. Individual points represent individual effect sizes nested within study. The overall summary effect shows the mean effect size of the FIE difference between autistic and neurotypical participants across all studies. Colors differentiate studies from each other. Values on the right side of the plot reflect the mean (Hedges g) and 95% credible intervals (CrIs) for the study-level posterior probability distributions. Two effect size values of −19.33 and −8.10 are not represented in this figure to avoid obscuring the figure.
What Factors Are Associated With the FIE?
We found moderate evidence that the difference in the FIE between autistic and neurotypical samples was moderated by measurement modality (b = 0.23; SE = 0.24; 95% CrI, −0.25 to 0.7; 83% PPD behavior < N170), psychological construct (b = 0.46; SE = 0.26; 95% CrI, −0.08 to 0.95; 96% PDD emotion < identity), and recognition demands (b = 0.37; SE = 0.27; 95% CrI, −0.16 to 0.91; 92% PPD discrimination < perception; Table 2).
Table 2. Summary Effect Sizes for Each Moderator Variable, Including Number of Contributing Effect Sizes and Studies.
| Moderator | No. ES | No. of studies | Autistic individuals | Neurotypical individuals | ||||||
|---|---|---|---|---|---|---|---|---|---|---|
| No. | g | SE | 95% CrI | No. | g | SE | 95% CrI | |||
| Behavior | 81 | 28 | 512 | 0.794 | 0.127 | 0.562 to 1.065 | 555 | 1.291 | 0.199 | 0.921 to 1.736 |
| EEG | 39 | 11 | 416 | 0.071 | 0.168 | −0.288 to 0.406 | 339 | 0.485 | 0.265 | −0.051 to 1.033 |
| Emotion | 29 | 6 | 105 | 0.66 | 0.151 | 0.306 to 0.963 | 104 | 1.53 | 0.231 | 1.041 to 1.988 |
| Identity | 69 | 23 | 445 | 0.339 | 0.097 | 0.159 to 0.566 | 479 | 0.69 | 0.147 | 0.402 to 0.99 |
| Discrimination | 37 | 10 | 187 | 0.515 | 0.19 | 0.154 to 0.923 | 212 | 1.031 | 0.257 | 0.542 to 1.606 |
| Perception | 46 | 14 | 441 | 0.304 | 0.159 | −0.016 to 0.65 | 368 | 0.611 | 0.229 | 0.166 to 1.092 |
| Recognition | 39 | 15 | 311 | 0.754 | 0.175 | 0.413 to 1.122 | 325 | 1.311 | 0.275 | 0.733 to 1.822 |
Abbreviations: EEG, electroencephalogram; No. ES, number of effect sizes represented by that moderator; CrI, credible interval.
The difference in the behavioral FIE between autistic and neurotypical samples (g = −0.51; SE = 0.14; 95% CrI, −0.8 to −0.2) was more negative than the difference in the N170 FIE (g = −0.28; SE = 0.19; 95% CrI, −0.68 to 0.12; Figure 3), suggesting an attenuated FIE in autistic compared with neurotypical samples during later stages of face processing (eg, explicit recognition). Similarly, the difference in the FIE for emotion recognition between autistic and neurotypical samples (g = −0.79; SE = 0.22; 95% CrI, −1.22 to −0.29) was significantly more negative than the identity recognition FIE difference (g = −0.33; SE = 0.13; 95% CrI, −0.58 to −0.06), suggesting that the face processing system in autism is less sensitive to inversion when recognizing emotional (compared with identity) information. Finally, the FIE in autism (compared with neurotypical) was reduced during face discrimination (g = −0.64; SE = 0.2; 95% CrI, −1.08 to −0.25) compared with face perception task paradigm (g = −0.28; SE = 0.17; 95% CrI, −0.64 to 0.07), suggesting that the magnitude of the FIE in autism may attenuate as cognitive load and/or recognition processes increase (eg, memory demands, encoding and recognition mechanisms).
Figure 3. Moderator Analyses and Meta-Regression of Methodological and Sampled-Related Factors.
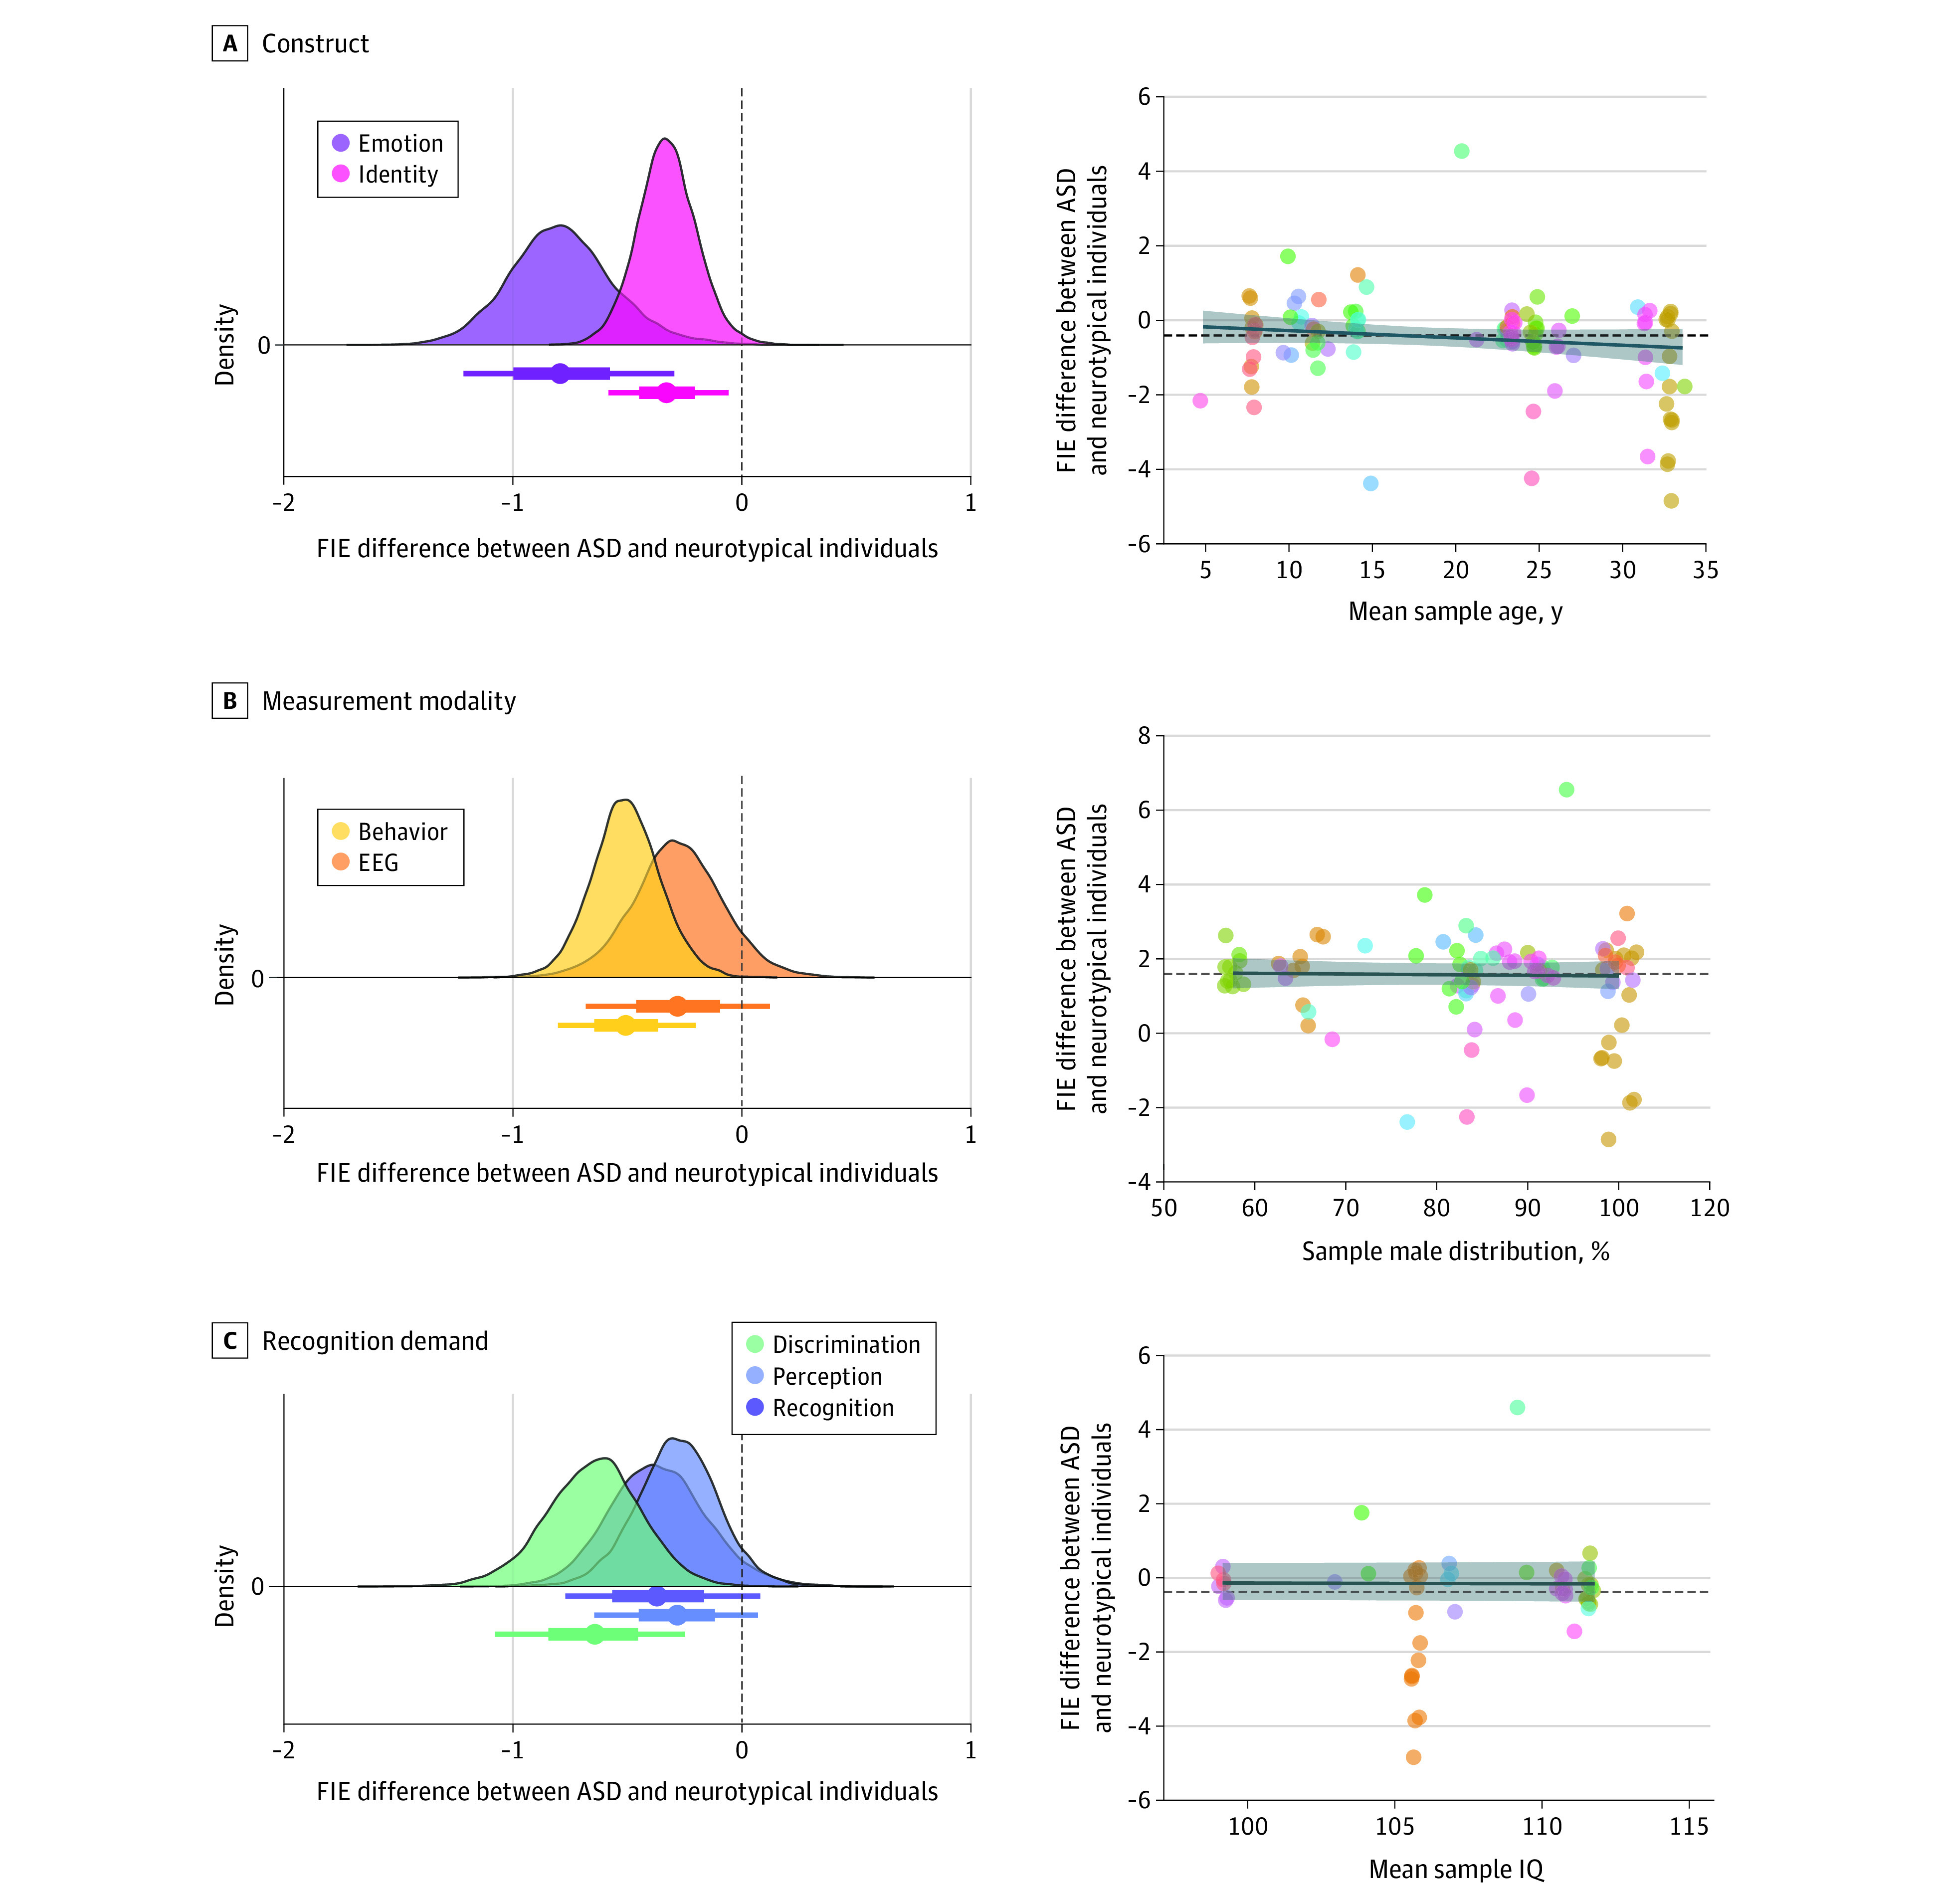
Differences in the magnitude of the summary effect size as a function of methodological factors, including psychological construct, measurement modality, and recognition demand, are shown on the left. Negative values suggest reduced face inversion effect (FIE) in autism and positive values suggest an increased FIE in autism. Point intervals reflect 95% quantile intervals. How the summary effect size is associated with sample-related factors, including mean sample age, sample sex distribution (% male), and average sample IQ score, are shown on the right. Dashed horizontal line represents the overall summary effect size (Hedges g = −0.41), whereas the solid line (with 95% CI) represents a fitted regression line. Point color differentiates individual studies. Two effect size values of −19.33 and −8.10 are not represented in this figure to avoid obscuring the figure. ASD indicates autism spectrum disorder; EEG, electroencephalogram.
Differences in the FIE between autistic and neurotypical individuals were not associated with the average sample age (b = −0.02; SE = 0.01; 95% CrI, −0.05 to 0.01; 96% PPD b = 0) or percentage of males in the sample (b = −0.16; SE = 0.64; 95% CrI, −1.4 to 1.1; 60% PPD b < 0). The reduced FIE in autism was consistent across all sample ages and sex distributions.
Quality Assessment, Publication Bias, and Sensitivity Analyses
Quality assessment (QA) scores, as measured by the modified Newcastle-Ottawa Scale, ranged between low (QA ≤ 4; k = 12), moderate (QA = 5-8; k = 16), and high (QA ≥ 8; k = 10) (Table 1 and eResults in Supplement 1). We did not find strong evidence that QA scores were systematically associated with FIE differences between autistic and neurotypical groups (b = 0.04; SE = 0.05; 95% CrI, −0.05 to 0.15; 80% PPD b > 0).
Through visualization and the modified Egger regression test, we found potential evidence of small-study effects based on funnel plot asymmetry (b = 1.53; SE = 0.26; 95% CrI, 1.04-2.06; 100% PPD intercept > 0; eResults in Supplement 1). We further evaluated sensitivity of the primary findings to potential outliers, influential cases, and publication bias. We found 6 studies classified as outliers and/or influential cases (ie, fall outside the 95% CI of the summary effect size or disproportionately contribute to heterogeneity). When excluding these studies, the magnitude of the FIE remained similar in magnitude (g = −0.45; SE = 0.09; 95% CI, −0.64 to −0.28; P < .001) but substantially reduced heterogeneity across effect sizes (I2 = 44.94%). Finally, using a 3-parameter selection model, we did not find significant evidence of publication bias (χ21 = 1.12; P = .29) and the adjusted summary effect size remained similar to the unadjusted estimate (g = −0.44; SE = 0.10; 95% CI, −0.64 to −0.24; P < .001).
Our leave-1-out analysis showed that these results were robust to any potential outliers and influential effect sizes; 100% of derived summary estimates were between −0.44 and −0.38 (eResults in Supplement 1). Furthermore, the reduced FIE in autism was not substantially impacted by the inputted correlation between upright and inverted conditions (0.1: r = −0.4; 0.3: r = −0.41; 0.5: r = −0.41; 0.7: r = −0.41; 0.9: r = −0.41). Finally, the derived results from both the main effect and moderator models were not substantially altered based on prior distribution selection (see eResults in Supplement 1).
Discussion
This systematic review and bayesian meta-analysis investigated sensitivity of the face processing system in autism by evaluating one of the most well-characterized and robust markers of specialized face processing ever studied: the FIE. The FIE has long been characterized as an indirect measure of face specialization, with inverted faces being more difficult to recognize since inversion disrupts the canonical configuration of facial features to which face processing mechanisms are attuned. For the past 30 years, researchers have hypothesized that the face processing system of autistic individuals may differ from that of neurotypical individuals; specifically, reduced use of configural or holistic processing may reduce efficient and accurate recognition of faces, one of the hallmark characteristics of autism.65,66 Here, we determined the veracity of this hypothesis by synthesizing data across the extant literature to determine whether autism is characterized by a reduced FIE and if so, what factors influence the magnitude of this FIE.
These meta-analytic results show that autistic individuals have a moderately attenuated FIE compared with neurotypical peers. Specifically, the inversion cost (upright − inverted) on face recognition performance for neurotypical peers was large (g = 0.95), which corroborates a wealth of previous literature demonstrating that inverted faces incur an inversion cost (ie, decrease in performance) relative to upright faces.6,8,67 In contrary, autistic participants did not show the same meaningful difference in performance for upright compared with inverted faces (g = 0.52). These findings reconcile the discrepant literature and demonstrate that autistic individuals, on average, show a reduced FIE, suggesting that the face processing systems of autistic individuals are less sensitive to face inversion than those of their neurotypical peers.
An attenuated FIE in autism suggests a face processing system that is less attuned to configural information. Therefore, this implies reduced reliance on configural (as opposed to featural) processing in autism. Configural information refers to the spatial relations of facial features (eg, eyes above nose, nose above mouth, distance between eyes), whereas featural information refers to the features themselves (eg, eyes, nose, mouth).7 Configural processing facilitates the rapid and efficient extraction of nonverbal facial cues that are rich in social information,68 including others’ emotional and mental states, which are of themselves complex and dynamic.69 Developmentally, sensitivity to these nonverbal cues is precursoru to higher-order social cognition, including mentalizing and theory of mind, both of which are critical in successful social interactions.70 Therefore, reduced sensitivity to configural information in autism may contribute to common clinical features of the condition, including difficulty interpreting nonverbal cues from others and challenges developing and maintaining social interactions and relationships.71
The FIE was significantly attenuated in autistic compared with neurotypical individuals when assessed with electrophysiological (eg, N170 amplitude and latency) and behavioral measures of face recognition (eg, accuracy, % correct, error rate). However, the behavioral FIE was more attenuated than the N170 FIE. The behavioral FIE is defined as the reduced accuracy in recognizing inverted (compared with upright) faces,8 whereas the N170 FIE represents increased N170 amplitude and latency to inverted (compared with upright) faces.11,72 These measures reflect different stages of processing (early and late face processing) with considerable differences in task demands (cognitive load, encoding, and recognition phases). Given that the N170 represents structural encoding of faces, the more attenuated FIE in autism at subsequent perceptual stages (ie, behavior) may reflect less specialization at structural encoding that compounds throughout later stages of face processing.
The FIE was significantly more attenuated in autistic compared with neurotypical individuals during emotion recognition compared with identity recognition of faces. Although the FIE has historically been specific to face identity recognition, inversion effects are hypothesized to be even larger for emotion recognition.73,74 Additionally, interpreting emotions from faces, not identity, is part of the diagnostic criteria for autism,71 suggesting sensitivity to emotion processing is more characteristic of the clinical phenotype. These results provide indirect support of reduced specialization in the emotional face processing system in autism, which may contribute to frequently occurring clinical features and may be a downstream consequence of reduced attention to faces during childhood.5,75
Future studies should evaluate the FIE in autism in relation to nonface objects to help disentangle the specificity of the configural processing mechanism to faces. Additionally, longitudinal studies, which directly link inversion effects to downstream development of social cognitive processing (ie, mentalizing and theory of mind) will confirm long-standing hypotheses in autism face perception research.
Limitations
Few studies included adolescent and emerging adult participants or an adequate number of females to make claims about age- and sex-related differences in the FIE, thereby limiting the generalizability of these findings. Also, most included studies (30 of 38) did not include a nonface control condition, which limited our ability to understand the face specificity or disproportionality of the FIE in autism. Finally, 12 articles met inclusion criteria but did not report data required for synthesis. Following email request for data, only 2 of 10 authors provided such data, which limited the potential precision of this study. Finally, this study was not preregistered, thereby increasing the potential risk of bias.
Conclusions
Based on this comprehensive meta-analysis, autism was associated with a reduced FIE, suggesting that autistic individuals may have less perceptual face expertise or a less specialized face processing system in comparison to neurotypical peers. This was particularly true for emotion (compared with identity) recognition, which may underlie common clinical symptomology in autism (eg, differences in interpreting emotional expressions).
eTable. PRISMA Checklist
eTable 2. PRISMA Abstract Checklist
eMethods.
eResults.
Data sharing statement
References
- 1.Simion F, Giorgio ED. Face perception and processing in early infancy: inborn predispositions and developmental changes. Front Psychol. 2015;6:969. doi: 10.3389/fpsyg.2015.00969 [DOI] [PMC free article] [PubMed] [Google Scholar]
- 2.Haxby JV, Hoffman EA, Gobbini MI. The distributed human neural system for face perception. Trends Cogn Sci. 2000;4(6):223-233. doi: 10.1016/S1364-6613(00)01482-0 [DOI] [PubMed] [Google Scholar]
- 3.Morton J, Johnson MH. CONSPEC and CONLERN: a two-process theory of infant face recognition. Psychol Rev. 1991;98(2):164-181. doi: 10.1037/0033-295X.98.2.164 [DOI] [PubMed] [Google Scholar]
- 4.Adolphs R. Social cognition and the human brain. Trends Cogn Sci. 1999;3(12):469-479. doi: 10.1016/S1364-6613(99)01399-6 [DOI] [PubMed] [Google Scholar]
- 5.Dawson G, Webb SJ, McPartland J. Understanding the nature of face processing impairment in autism: insights from behavioral and electrophysiological studies. Dev Neuropsychol. 2005;27(3):403-424. doi: 10.1207/s15326942dn2703_6 [DOI] [PubMed] [Google Scholar]
- 6.Farah MJ, Tanaka JW, Drain HM. What causes the face inversion effect? J Exp Psychol Hum Percept Perform. 1995;21(3):628-634. doi: 10.1037/0096-1523.21.3.628 [DOI] [PubMed] [Google Scholar]
- 7.Maurer D, Grand RL, Mondloch CJ. The many faces of configural processing. Trends Cogn Sci. 2002;6(6):255-260. doi: 10.1016/S1364-6613(02)01903-4 [DOI] [PubMed] [Google Scholar]
- 8.Yin RK. Looking at upside-down faces. J Exp Psychol. 1969;81(1):141-145. doi: 10.1037/h0027474 [DOI] [Google Scholar]
- 9.Kanwisher N, Tong F, Nakayama K. The effect of face inversion on the human fusiform face area. Cognition. 1998;68(1):B1-B11. doi: 10.1016/S0010-0277(98)00035-3 [DOI] [PubMed] [Google Scholar]
- 10.Kanwisher N, Yovel G. The fusiform face area: a cortical region specialized for the perception of faces. Philos Trans R Soc Lond B Biol Sci. 2006;361(1476):2109-2128. doi: 10.1098/rstb.2006.1934 [DOI] [PMC free article] [PubMed] [Google Scholar]
- 11.Itier RJ, Taylor MJ. Source analysis of the N170 to faces and objects. Neuroreport. 2004;15(8):1261-1265. doi: 10.1097/01.wnr.0000127827.73576.d8 [DOI] [PubMed] [Google Scholar]
- 12.Rossion B, Delvenne JF, Debatisse D, et al. Spatio-temporal localization of the face inversion effect: an event-related potentials study. Biol Psychol. 1999;50(3):173-189. doi: 10.1016/S0301-0511(99)00013-7 [DOI] [PubMed] [Google Scholar]
- 13.Sadeh B, Yovel G. Why is the N170 enhanced for inverted faces? An ERP competition experiment. Neuroimage. 2010;53(2):782-789. doi: 10.1016/j.neuroimage.2010.06.029 [DOI] [PubMed] [Google Scholar]
- 14.Carey S. Becoming a face expert. Philos Trans R Soc Lond B Biol Sci. 1992;335(1273):95-102. doi: 10.1098/rstb.1992.0012 [DOI] [PubMed] [Google Scholar]
- 15.Rossion B. Picture-plane inversion leads to qualitative changes of face perception. Acta Psychol (Amst). 2008;128(2):274-289. doi: 10.1016/j.actpsy.2008.02.003 [DOI] [PubMed] [Google Scholar]
- 16.Hobson RP, Ouston J, Lee A. What’s in a face? The case of autism. Br J Psychol. 1988;79(Pt 4):441-453. doi: 10.1111/j.2044-8295.1988.tb02745.x [DOI] [PubMed] [Google Scholar]
- 17.Rose FE, Lincoln AJ, Lai Z, Ene M, Searcy YM, Bellugi U. Orientation and affective expression effects on face recognition in Williams syndrome and autism. J Autism Dev Disord. 2007;37(3):513-522. doi: 10.1007/s10803-006-0200-4 [DOI] [PubMed] [Google Scholar]
- 18.Tantam D, Monaghan L, Nicholson H, Stirling J. Autistic children’s ability to interpret faces: a research note. J Child Psychol Psychiatry. 1989;30(4):623-630. doi: 10.1111/j.1469-7610.1989.tb00274.x [DOI] [PubMed] [Google Scholar]
- 19.Lahaie A, Mottron L, Arguin M, Berthiaume C, Jemel B, Saumier D. Face perception in high-functioning autistic adults: evidence for superior processing of face parts, not for a configural face-processing deficit. Neuropsychology. 2006;20(1):30-41. doi: 10.1037/0894-4105.20.1.30 [DOI] [PubMed] [Google Scholar]
- 20.Ewing L, Pellicano E, Rhodes G. Reevaluating the selectivity of face-processing difficulties in children and adolescents with autism. J Exp Child Psychol. 2013;115(2):342-355. doi: 10.1016/j.jecp.2013.01.009 [DOI] [PubMed] [Google Scholar]
- 21.Hedley D, Brewer N, Young R. The effect of inversion on face recognition in adults with autism spectrum disorder. J Autism Dev Disord. 2015;45(5):1368-1379. doi: 10.1007/s10803-014-2297-1 [DOI] [PubMed] [Google Scholar]
- 22.Faja S, Webb SJ, Merkle K, Aylward E, Dawson G. Brief report: face configuration accuracy and processing speed among adults with high-functioning autism spectrum disorders. J Autism Dev Disord. 2009;39(3):532-538. doi: 10.1007/s10803-008-0635-x [DOI] [PMC free article] [PubMed] [Google Scholar]
- 23.Teunisse JP, de Gelder B. Face processing in adolescents with autistic disorder: the inversion and composite effects. Brain Cogn. 2003;52(3):285-294. doi: 10.1016/S0278-2626(03)00042-3 [DOI] [PubMed] [Google Scholar]
- 24.Scherf KS, Behrmann M, Minshew N, Luna B. Atypical development of face and greeble recognition in autism. J Child Psychol Psychiatry. 2008;49(8):838-847. doi: 10.1111/j.1469-7610.2008.01903.x [DOI] [PMC free article] [PubMed] [Google Scholar]
- 25.Langdell T. Recognition of faces: an approach to the study of autism. J Child Psychol Psychiatry. 1978;19(3):255-268. doi: 10.1111/j.1469-7610.1978.tb00468.x [DOI] [PubMed] [Google Scholar]
- 26.Barton JJ, Hefter RL, Cherkasova MV, Manoach DS. Investigations of face expertise in the social developmental disorders. Neurology. 2007;69(9):860-870. doi: 10.1212/01.wnl.0000267842.85646.f2 [DOI] [PubMed] [Google Scholar]
- 27.Bookheimer SY, Wang AT, Scott A, Sigman M, Dapretto M. Frontal contributions to face processing differences in autism: evidence from fMRI of inverted face processing. J Int Neuropsychol Soc. 2008;14(6):922-932. doi: 10.1017/S135561770808140X [DOI] [PMC free article] [PubMed] [Google Scholar]
- 28.Tavares PP, Mouga SS, Oliveira GG, Castelo-Branco M. Preserved face inversion effects in adults with autism spectrum disorder: an event-related potential study. Neuroreport. 2016;27(8):587-592. doi: 10.1097/WNR.0000000000000576 [DOI] [PubMed] [Google Scholar]
- 29.McPartland J, Dawson G, Webb SJ, Panagiotides H, Carver LJ. Event-related brain potentials reveal anomalies in temporal processing of faces in autism spectrum disorder. J Child Psychol Psychiatry. 2004;45(7):1235-1245. doi: 10.1111/j.1469-7610.2004.00318.x [DOI] [PubMed] [Google Scholar]
- 30.McPartland JC, Wu J, Bailey CA, Mayes LC, Schultz RT, Klin A. Atypical neural specialization for social percepts in autism spectrum disorder. Soc Neurosci. 2011;6(5-6):436-451. doi: 10.1080/17470919.2011.586880 [DOI] [PMC free article] [PubMed] [Google Scholar]
- 31.Webb SJ, Merkle K, Murias M, Richards T, Aylward E, Dawson G. ERP responses differentiate inverted but not upright face processing in adults with ASD. Soc Cogn Affect Neurosci. 2012;7(5):578-587. doi: 10.1093/scan/nsp002 [DOI] [PMC free article] [PubMed] [Google Scholar]
- 32.Johnson BT. Toward a more transparent, rigorous, and generative psychology. Psychol Bull. 2021;147(1):1-15. doi: 10.1037/bul0000317 [DOI] [PubMed] [Google Scholar]
- 33.Page MJ, McKenzie JE, Bossuyt PM, et al. The PRISMA 2020 statement: an updated guideline for reporting systematic reviews. BMJ. 2021;372(71):n71. doi: 10.1136/bmj.n71 [DOI] [PMC free article] [PubMed] [Google Scholar]
- 34.WebPlotDigitizer. Accessed May 24, 2023. https://automeris.io/WebPlotDigitizer
- 35.Wells GA, Shea B, O’Connell D, et al. The Newcastle-Ottawa Scale (NOS) for assessing the quality of nonrandomised studies in meta-analyses. The Ottawa Hospital. Accessed May 24, 2023. https://www.ohri.ca/programs/clinical_epidemiology/oxford.asp
- 36.Viechtbauer W. Conducting meta-analyses in R with the metafor package. J Stat Softw. 2010;36(3):1-48. doi: 10.18637/jss.v036.i03 [DOI] [Google Scholar]
- 37.Williams DR, Rast P, Bürkner P. (2018, January 10). Bayesian meta-analysis with weakly informative prior distributions. doi: 10.31234/osf.io/7tbrm [DOI]
- 38.Higgins JP, Thompson SG. Quantifying heterogeneity in a meta-analysis. Stat Med. 2002;21(11):1539-1558. doi: 10.1002/sim.1186 [DOI] [PubMed] [Google Scholar]
- 39.Harrer M, Cuijpers P, Furukawa TA, Ebert DD. Doing Meta-Analysis with R: A Hands-On Guide. Chapman & Hall/CRC Press; 2021. doi: 10.1201/9781003107347 [DOI] [Google Scholar]
- 40.Grice SJ, Spratling MW, Karmiloff-Smith A, et al. Disordered visual processing and oscillatory brain activity in autism and Williams syndrome. Neuroreport. 2001;12(12):2697-2700. doi: 10.1097/00001756-200108280-00021 [DOI] [PubMed] [Google Scholar]
- 41.Rouse H, Donnelly N, Hadwin JA, Brown T. Do children with autism perceive second-order relational features? The case of the Thatcher illusion. J Child Psychol Psychiatry. 2004;45(7):1246-1257. doi: 10.1111/j.1469-7610.2004.00317.x [DOI] [PubMed] [Google Scholar]
- 42.Reed CL, Beall PM, Stone VE, Kopelioff L, Pulham DJ, Hepburn SL. Brief report: perception of body posture: what individuals with autism spectrum disorder might be missing. J Autism Dev Disord. 2007;37(8):1576-1584. doi: 10.1007/s10803-006-0220-0 [DOI] [PubMed] [Google Scholar]
- 43.Wallace S, Coleman M, Bailey A. An investigation of basic facial expression recognition in autism spectrum disorders. Cogn Emotion. 2008;22(7):1353-1380. doi: 10.1080/02699930701782153 [DOI] [Google Scholar]
- 44.Annaz D, Karmiloff-Smith A, Johnson MH, Thomas MS. A cross-syndrome study of the development of holistic face recognition in children with autism, Down syndrome, and Williams syndrome. J Exp Child Psychol. 2009;102(4):456-486. doi: 10.1016/j.jecp.2008.11.005 [DOI] [PubMed] [Google Scholar]
- 45.Riby DM, Doherty-Sneddon G, Bruce V. The eyes or the mouth? Feature salience and unfamiliar face processing in Williams syndrome and autism. Q J Exp Psychol (Hove). 2009;62(1):189-203. doi: 10.1080/17470210701855629 [DOI] [PubMed] [Google Scholar]
- 46.Rosset DB, Santos A, Da Fonseca D, Poinso F, O’Connor K, Deruelle C. Do children perceive features of real and cartoon faces in the same way? Evidence from typical development and autism. J Clin Exp Neuropsychol. 2010;32(2):212-218. doi: 10.1080/13803390902971123 [DOI] [PubMed] [Google Scholar]
- 47.Hileman CM, Henderson H, Mundy P, Newell L, Jaime M. Developmental and individual differences on the P1 and N170 ERP components in children with and without autism. Dev Neuropsychol. 2011;36(2):214-236. doi: 10.1080/87565641.2010.549870 [DOI] [PMC free article] [PubMed] [Google Scholar]
- 48.McPartland JC, Webb SJ, Keehn B, Dawson G. Patterns of visual attention to faces and objects in autism spectrum disorder. J Autism Dev Disord. 2011;41(2):148-157. doi: 10.1007/s10803-010-1033-8 [DOI] [PMC free article] [PubMed] [Google Scholar]
- 49.Kikuchi Y, Senju A, Hasegawa T, Tojo Y, Osanai H. The effect of spatial frequency and face inversion on facial expression processing in children with autism spectrum disorder. Jpn Psychol Res. 2013;55(2):118-130. doi: 10.1111/jpr.12000 [DOI] [Google Scholar]
- 50.Doi H, Fujisawa TX, Kanai C, et al. Recognition of facial expressions and prosodic cues with graded emotional intensities in adults with Asperger syndrome. J Autism Dev Disord. 2013;43(9):2099-2113. doi: 10.1007/s10803-013-1760-8 [DOI] [PubMed] [Google Scholar]
- 51.Khorrami A, Tehrani-Doost M, Esteky H. Comparison between face and object processing in youths with autism spectrum disorder: an event related potentials study. Iran J Psychiatry. 2013;8(4):179-187. [PMC free article] [PubMed] [Google Scholar]
- 52.Zürcher NR, Donnelly N, Rogier O, et al. It’s all in the eyes: subcortical and cortical activation during grotesqueness perception in autism. PLoS One. 2013;8(1):e54313. doi: 10.1371/journal.pone.0054313 [DOI] [PMC free article] [PubMed] [Google Scholar]
- 53.Isomura T, Ogawa S, Yamada S, Shibasaki M, Masataka N. Preliminary evidence that different mechanisms underlie the anger superiority effect in children with and without autism spectrum disorders. Front Psychol. 2014;5:461. doi: 10.3389/fpsyg.2014.00461 [DOI] [PMC free article] [PubMed] [Google Scholar]
- 54.O’Brien J, Spencer J, Girges C, Johnston A, Hill H. Impaired perception of facial motion in autism spectrum disorder. PLoS One. 2014;9(7):e102173. doi: 10.1371/journal.pone.0102173 [DOI] [PMC free article] [PubMed] [Google Scholar]
- 55.Cleary L, Brady N, Fitzgerald M, Gallagher L. Holistic processing of faces as measured by the Thatcher illusion is intact in autism spectrum disorders. Autism. 2015;19(4):451-458. doi: 10.1177/1362361314526005 [DOI] [PubMed] [Google Scholar]
- 56.Dimitriou D, Leonard HC, Karmiloff-Smith A, Johnson MH, Thomas MS. Atypical development of configural face recognition in children with autism, Down syndrome and Williams syndrome. J Intellect Disabil Res. 2015;59(5):422-438. doi: 10.1111/jir.12141 [DOI] [PubMed] [Google Scholar]
- 57.Tye C, Farroni T, Volein Á, et al. Autism diagnosis differentiates neurophysiological responses to faces in adults with tuberous sclerosis complex. J Neurodev Disord. 2015;7:33. doi: 10.1186/s11689-015-9129-2 [DOI] [PMC free article] [PubMed] [Google Scholar]
- 58.Neuhaus E, Kresse A, Faja S, Bernier RA, Webb SJ. Face processing among twins with and without autism: social correlates and twin concordance. Soc Cogn Affect Neurosci. 2016;11(1):44-54. doi: 10.1093/scan/nsv085 [DOI] [PMC free article] [PubMed] [Google Scholar]
- 59.Whyte EM, Behrmann M, Minshew NJ, Garcia NV, Scherf KS. Animal, but not human, faces engage the distributed face network in adolescents with autism. Dev Sci. 2016;19(2):306-317. doi: 10.1111/desc.12305 [DOI] [PubMed] [Google Scholar]
- 60.Castelhano J, Tavares P, Mouga S, Oliveira G, Castelo-Branco M. Stimulus dependent neural oscillatory patterns show reliable statistical identification of autism spectrum disorder in a face perceptual decision task. Clin Neurophysiol. 2018;129(5):981-989. doi: 10.1016/j.clinph.2018.01.072 [DOI] [PubMed] [Google Scholar]
- 61.Naumann S, Senftleben U, Santhosh M, McPartland J, Webb SJ. Neurophysiological correlates of holistic face processing in adolescents with and without autism spectrum disorder. J Neurodev Disord. 2018;10:27. doi: 10.1186/s11689-018-9244-y [DOI] [PMC free article] [PubMed] [Google Scholar]
- 62.Hadad BS, Schwartz S, Binur N. Reduced perceptual specialization in autism: evidence from the other-race face effect. J Exp Psychol Gen. 2019;148(3):588-594. doi: 10.1037/xge0000550 [DOI] [PubMed] [Google Scholar]
- 63.Webb SJ, Emerman I, Sugar C, et al. Identifying age based maturation in the ERP response to faces in children with autism: implications for developing biomarkers for use in clinical trials. Front Psychiatry. 2022;13:841236. doi: 10.3389/fpsyt.2022.841236 [DOI] [PMC free article] [PubMed] [Google Scholar]
- 64.Zhang K, Yuan Y, Chen J, Wang G, Chen Q, Luo M. Eye tracking research on the influence of spatial frequency and inversion effect on facial expression processing in children with autism spectrum disorder. Brain Sci. 2022;12(2):283. doi: 10.3390/brainsci12020283 [DOI] [PMC free article] [PubMed] [Google Scholar]
- 65.Griffin JW, Bauer R, Scherf KS. A quantitative meta-analysis of face recognition deficits in autism: 40 years of research. Psychol Bull. 2021;147(3):268-292. doi: 10.1037/bul0000310 [DOI] [PMC free article] [PubMed] [Google Scholar]
- 66.Weigelt S, Koldewyn K, Kanwisher N. Face identity recognition in autism spectrum disorders: a review of behavioral studies. Neurosci Biobehav Rev. 2012;36(3):1060-1084. doi: 10.1016/j.neubiorev.2011.12.008 [DOI] [PubMed] [Google Scholar]
- 67.Civile C, McLaren RP, McLaren IPL. The face inversion effect—parts and wholes: individual features and their configuration. Q J Exp Psychol (Hove). 2014;67(4):728-746. doi: 10.1080/17470218.2013.828315 [DOI] [PubMed] [Google Scholar]
- 68.Hsiao JH, Cottrell G. Two fixations suffice in face recognition. Psychol Sci. 2008;19(10):998-1006. doi: 10.1111/j.1467-9280.2008.02191.x [DOI] [PMC free article] [PubMed] [Google Scholar]
- 69.Tanaka JW, Farah MJ. Parts and wholes in face recognition. Q J Exp Psychol A. 1993;46(2):225-245. doi: 10.1080/14640749308401045 [DOI] [PubMed] [Google Scholar]
- 70.Frith CD, Frith U. Interacting minds: a biological basis. Science. 1999;286(5445):1692-1695. doi: 10.1126/science.286.5445.1692 [DOI] [PubMed] [Google Scholar]
- 71.American Psychiatric Association . Diagnostic and Statistical Manual of Mental Disorders. 5th ed. American Psychiatric Association; 2013. [Google Scholar]
- 72.Rossion B, Gauthier I, Tarr MJ, et al. The N170 occipito-temporal component is delayed and enhanced to inverted faces but not to inverted objects: an electrophysiological account of face-specific processes in the human brain. Neuroreport. 2000;11(1):69-74. doi: 10.1097/00001756-200001170-00014 [DOI] [PubMed] [Google Scholar]
- 73.McKelvie SJ. Emotional expression in upside-down faces: evidence for configurational and componential processing. Br J Soc Psychol. 1995;34(pt 3):325-334. doi: 10.1111/j.2044-8309.1995.tb01067.x [DOI] [PubMed] [Google Scholar]
- 74.Prkachin GC. The effects of orientation on detection and identification of facial expressions of emotion. Br J Psychol. 2003;94(pt 1):45-62. doi: 10.1348/000712603762842093 [DOI] [PubMed] [Google Scholar]
- 75.Chevallier C, Kohls G, Troiani V, Brodkin ES, Schultz RT. The social motivation theory of autism. Trends Cogn Sci. 2012;16(4):231-239. doi: 10.1016/j.tics.2012.02.007 [DOI] [PMC free article] [PubMed] [Google Scholar]
Associated Data
This section collects any data citations, data availability statements, or supplementary materials included in this article.
Supplementary Materials
eTable. PRISMA Checklist
eTable 2. PRISMA Abstract Checklist
eMethods.
eResults.
Data sharing statement