Abstract
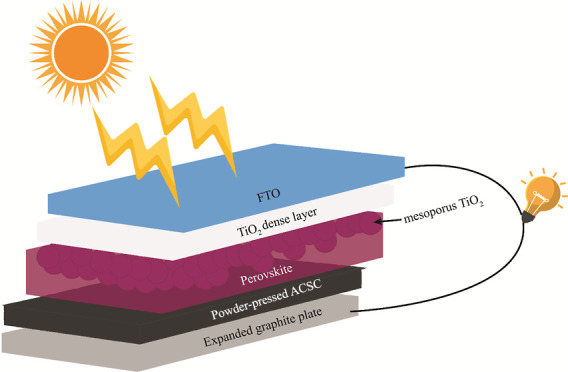
Although perovskite solar cells (PSCs) have reached a record high conversion efficiency of 25.7%, the materials used to fabricate them invoke costly hole-transporting materials, such as spiro-OMeTAD, and expensive gold back contacts. The cost of fabrication of a solar cell or any other practical device is an important issue in their practical applications. In this study, we describe the fabrication of a low-cost, mesoscopic PSC, eliminating the use of expensive p-type semiconductors and substituting them with electronically conducting activated carbon, and the gold back contact with expanded graphite. The activated carbon hole transporting material was derived from readily available coconut shells and the expanded graphite from graphite attached to rock pieces of graphite vein banks. We drastically reduced the overall cell fabrication cost using these low-cost materials and added commercial value to discarded graphite and coconut shells. Under ambient conditions, our PSC gives a conversion efficiency of 8.60 ± 0.10 % at 1.5 AM simulated sunlight. We have identified the lower fill factor as the limiting factor for the low conversion efficiency. We believe that the lower cost of the materials used and the deceptively simple powder pressing method would compensate for the relatively lower conversion efficiency in its practical application.
Introduction
Perovskite solar cells (PSCs) attract much attention in the photovoltaic research community. This worldwide popularity of PCSs stems from a simple fabrication technique compared to that of the silicon solar cell and surpassing conversion efficiencies. In a perovskite solar cell, a perovskite compound, typically a hybrid of organic–inorganic lead or tin halide, is used as a light-harvesting active layer to form a sandwich structure. Generally, the photoanode is composed of a fluorine-doped tin oxide transparent conducting oxide (FTO) plate on which a thin, dense layer (∼500 nm thick) of TiO2 or doped TiO2 is deposited, followed by a thick mesoporous layer of interconnected TiO2.1 Thereafter, the perovskite layer and hole conductor are deposited consecutively. In some cases, interfacial layers and additives are used for the passivation of trap states in perovskite.2−5 A hole conductor is used to transport photogenerated holes toward the counter electrode, typically made of a gold back contact. The highest efficiency of the PSCs achieved up to date is 25.7%.6 However, such a high efficiency has been obtained using expensive hole conducting materials (HCMs), such as spiro-OMeTAD [(N2,N2,N2′,N2′,N7,N7,N7′,N7′-octakis(4-methoxyphenyl)-9,9′-spirobi[9H-fluorene]-2,2′,7,7′-tetramine] and gold back contacts,7−9 thus escalating the fabrication cost of the device.
In attempts to reduce the fabrication cost of PSCs, several researchers have devoted their attention to replacing expensive HCMs and back contact materials with inexpensive materials.10−12 In a breakthrough study, Etgar et al.13 reported the first hole conductor-free PSC with an efficiency of 5%, which incorporated the organic–inorganic perovskite CH3NH3PbI3. Here, for reasons not sufficiently clear, of the carriers photo-generated in CH3NH3PbI3, the electrons and holes transferred to TiO2 and the metallic back contact, respectively. Since then, so-called hole conductor-free PSC research efforts have escalated, and best efficiencies of over 18% have been obtained.14 In this study, we have been able to fabricate a low-cost mesoscopic PSC that does not utilize expensive materials, such as spiro-OMeTAD and Au, but instead uses expanded graphite (EG) derived from natural vein graphite and coconut shell-based activated carbon (CSAC). CSAC increases the contact between the working electrode and the counter electrode. The CSAC powder was incorporated using the method of powder pressing (PP), which was introduced by us and revealed in a previous study.15 Also, we were able to synthesize CSAC via a low-cost method, which enabled us to reduce the cost of PSC even further. In the case of EG preparation, we were able to use graphite particles attached to rock pieces found in the mines. Using this method, we were able to reduce the fabrication cost of EG considerably. In this publication, we reveal the methods of EG and CSAC preparation, their characterization, and their application in PSC for developing low-cost PSCs with practically meaningful efficiencies.
Experimental Section
Materials
Fluorine tin oxide (FTO 15 Ω/sq) was purchased from Solaronix. Titanium diisopropoxide bis(acetylacetonate) (75 wt %) and N,N-Dimethylformamide (99.5%) were purchased from Daejung Chemicals. Titania paste (TiO2 paste of average particle size 25 nm 19 wt %) was purchased from Dyesol Industries. PbI2 (99%) was purchased from Research-lab. Methylammonium iodide and dimethyl sulfoxide (99.9%) were purchased from Sigma-Aldrich. Absolute ethanol purchased from VWR Chemicals.
Fabrication of the Photoanode
The suspension required to make the dense TiO2 layer on cleaned and pre-heated FTO plates was prepared by mixing titanium diisopropoxide bis(acetylacetonate) (700 μL) and absolute ethanol (7.0 mL) in a brown bottle. The suspension required to fabricate a mesoporous TiO2 layer was prepared by mixing titania paste and absolute ethanol at mass ratios of 2:7 by magnetic agitation on a stirrer-hotplate for 20 min at 70 °C. The perovskite precursor solution was prepared by stirring a mixture of methylammonium iodide (159.0 mg), lead iodide (461.0 mg), dimethyl sulfoxide (70 μL), and N,N-dimethylformamide (1472 μL) on a magnetic stirrer-hotplate for 1 h at 70 °C.
The fabrication of the photoanode was done under ambient atmospheric conditions. First, the suspension prepared to make a compact TiO2 layer (3.3 mL) was applied on top of cleaned FTO glass plates (2.5 cm × 1 cm), preheated at 400 °C on a hotplate, using the spray pyrolysis method. After the completion of the spray deposition, the FTO plates were kept at 400 °C for further 20 min, and subsequently, they were allowed to cool down to room temperature. Then, the suspension prepared to make the mesoporous TiO2 layer (60.0 μL) was spin-coated (spinning speed of 5000 rpm) on top of the TiO2 compact layer. Then, the plates were sintered at 500 °C for 30 min on a hotplate and subsequently allowed to cool down to room temperature. The TiO2-attached FTO plates were then heated to 70 °C on a hotplate to remove any adsorbed moisture, and the perovskite precursor solution (60.0 μL) was spin-coated (at a spinning speed of 2000 rpm) on top of the mesoporous TiO2 layer while heating at 70 °C. Then, the plates were sintered at 120 °C for 15 min on a hotplate and allowed to cool down to room temperature.
Preparation of Coconut Shell-based Activated Charcoal Powder
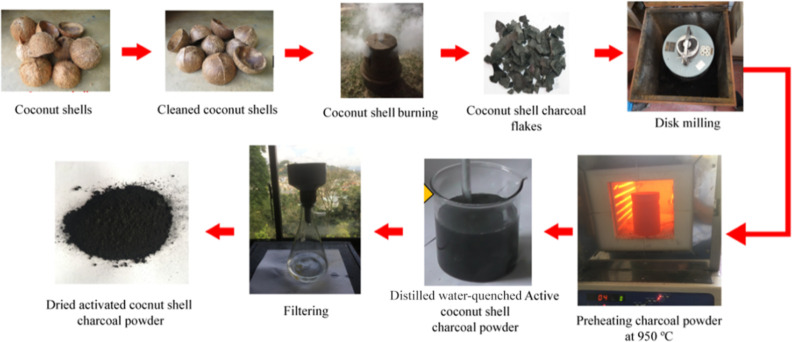
First, fiber-removed and well-cleaned coconut shells were burnt under low oxygen conditions to get coconut shell charcoal flakes. They were then milled using a disc mill for 5 min to get a fine powder. The activation process was done by heating coconut shell charcoal powder to 950 °C for 20 min and immediately quenching the heated powder in distilled water at room temperature. Then, the suspension was filtered and dried at 100 °C to get CSAC powder. The process is shown in Figure 1.
Figure 1.
Process used to prepare coconut shell-based activated carbon.
Preparation of Expanded Graphite Sheets and the Assembly of Solar Cells
The procedure used to prepare expanded graphite sheets from graphite particles attached to rock pieces found in the mines of Bogala Graphite Pvt. Ltd., Sri Lanka, is a patented process of some of the authors.16 In this process, intercalated graphite (IG) was prepared by immersing the graphite attached rock pieces in an acid mixture; more details are given in the above patent. This procedure enables the delamination of all the graphite particles attached to the rock piece and subsequent intercalation, where the intercalated graphite floats in the acid mixture and the graphite-free rock piece is then removed. Then, this IG suspension was filtered and washed with distilled water. Next, the IG was heated at 600 °C in a box furnace for 10 min. After that, the EG was pressed to prepare EG sheets using a hydraulic press. These EG sheets were cut to the desired rectangular shape using a paper cutter. The process flow diagram is shown in Figure 2A.
Figure 2.
(A) Process flow diagram showing the conversion of graphite attached to rock pieces to expanded graphite sheets: [1] a piece of rock with attached graphite on its surface, [2] intercalated graphite, [3] expanded graphite, and [4] expanded graphite sheets. (B) Steps involved in assembling the perovskite solar cell.
The assembly of the device is shown in Figure 2B. First, a small amount of CSAC powder was put on top of the perovskite layer of the working electrode. Then, using a spatula, this powder was spread across the perovskite layer to form a uniform layer of CSAC. Finally, the EG counter electrode was pressed onto the CSAC layer, and the cell was fixed using two clips.
Characterization
X-ray diffractogram (XRD) data was obtained using a Rigaku Ultima IV X-ray Diffractometer equipped with a Cu anode and dual detectors (λ = 15.4 nm). Transmission electron microscopy (TEM) images were obtained using a JEOL JEM-3010 operating at 300 kV. Scanning electron microscopy (SEM) images were obtained using an EFI Quanta 450 FEG-SEM microscope operating at 30 kV. FT-IR measurements were obtained using a Bruker Alpha FT-IR spectrometer in the range of 500–4000 cm–1. Raman spectrometry (RS) measurements were taken using the Renishaw Invia Reflex Raman microscopy system. Electrical conductivity measurements were done using the four-probe method by a VK-PA-300 K PV Power Analyzer. Electrochemical impedance spectroscopy (EIS) measurements were carried out on PSC devices using Metrohm Autolab Potentiostat/Galvanostat PGSTAT 128N with an FRA 32 M frequency response analyzer (FRA) in the frequency range between 10–2 and 106 Hz. The impedance was obtained by applying the negative value of open-circuit voltage (−VOC) as bias voltage under illumination of 100 mW cm–2. IPCE data was obtained by exposing the 0.07 cm2 surface area of the completed cell to monochromatic light illumination from a Bentham PVE 300 unit with a TMC 300 monochromator and a 150 W Xenon arc lamp covering the 300 to 800 nm wavelength range. The J–V characteristics of the solar cells were obtained by exposing the 0.07 cm2 surface area of the completed cell to AM 1.5 at 100 mW cm–2 simulated sunlight using a SPD SS-25 LED Solar Simulator and a VK-PA-300 K PV Power Analyzer.
Results and Discussion
Characterization of Coconut Shell-Based Activated Carbon
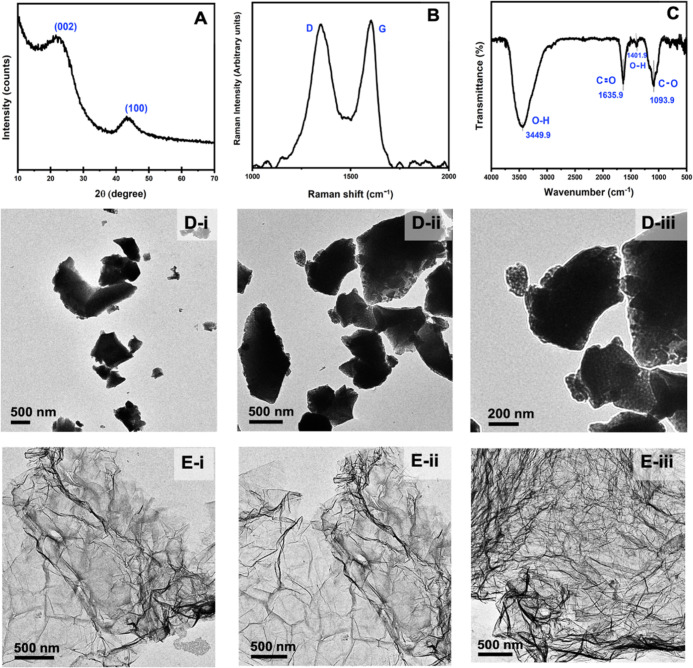
Figure 3A shows the X-ray diffractogram of the CSAC powder. The XRD pattern gives two distinct but broad diffraction features at 2θ ∼ 22 and ∼ 43°, which correspond to the diffractions from the (002) and (100) planes, respectively, of reduced graphene oxide (rGO).17,18 Although graphite gives sharp diffraction from (002) plane at 26.5°, this peak is shifted to 10.3° in graphite oxide (GO). The reduction of the graphite oxide to form rGO tends to shift this graphitic peak toward its original value close to 26.5°, and hence the peak observed at ∼ 22° can be assigned to be due to diffraction from the (002) plane of rGO. Figure 3B shows the Raman spectrum of the CSAC powder. It consists of two bands: the first band appearing around 1345 cm–1, which can be assigned as the D band, is due to the disordered characteristics of the material, and a second band appearing at 1605 cm–1 is due to the graphitic G band.19 The G band arises due to the stretching mode of sp2 hybridized carbon atoms in the rings and chains, and the D band arises due to the stretching mode of the discorded carbon atoms in planar terminations of the graphitic structure.20 The D band grows in intensity relative to the G band with the increasing disorder of the graphite structure. Also, the band intensity ratio of D and G bands (ID/IG) provides an estimation of the structural disorder of the material and is 1.08 for the CSAC material, showing high defect density created during the synthesis process. A high defect density and increased intensity of the D band relative to that of graphite are typical of rGO. Hence, the Raman study corroborates well with the conclusions made from XRD analysis. The FT-IR spectrum of the CSAC is shown in Figure 3C. It shows vibration bands centered at 3449.9, 1635.9, 1401.9, and 1093.9 cm–1, which can be assigned to intermolecular H-bonded O–H stretching, conjugated C=C stretching, the scissoring mode of the O–H bending, and the stretching vibration of C–O, respectively. The data indicates the conjugated C=C structure typical of graphitic carbon and the presence of some oxygen functionalities typical of not fully reduced graphene oxide. The TEM images shown in Figure 3D(i–iii) demonstrate the flaky morphology of the CSAC particles with sizes in the 0.5–2 μm range and extensive defects. As can be seen from Figure 3E(i–iii), the TEM images of the fully reduced graphene oxide have a morphology different from that of CSAC particles, again showing that the latter consists of not fully reduced rGO. Here, we synthesized fully reduced graphene oxide (rGO) starting from Sri Lankan vein graphite using a modified Hummers method, which was published elsewhere,21 and we used this rGO for TEM image comparison.
Figure 3.
(A) X-ray diffractogram, (B) Raman spectrum, (C) FT-IR spectrum, and (D-i–iii) TEM images of the coconut shell-based activated carbon produced. Figure 1 (E-i–iii) shows the TEM images of fully reduced graphene oxide rGO.
Characterization of the Expanded Graphite Produced
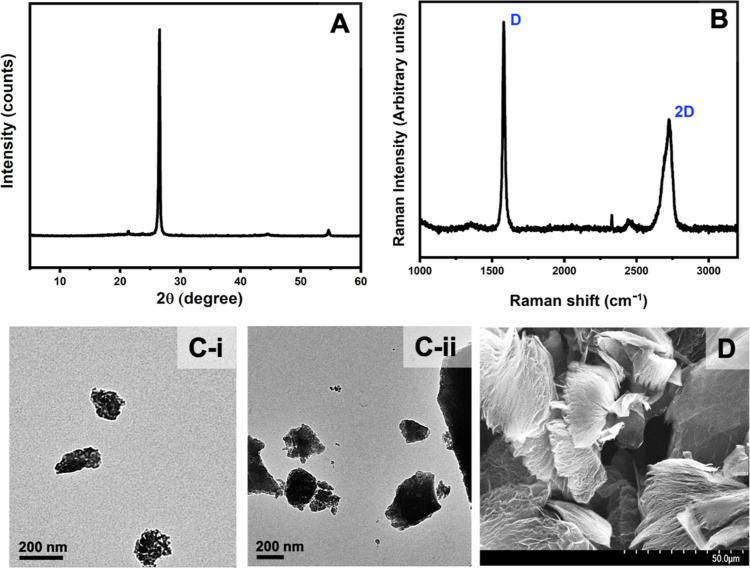
Figure 4 shows the XRD, RS, TEM, and SEM of the expanded graphite produced. The XRD pattern of EG is shown in Figure 4A. Expanded graphite shows a peak at 2θ = 26.54°. Application of the Debye–Scherrer equation to this peak gives crystal sizes of 48.55 nm. According to Figure 4B, there is no change in the Raman spectra of graphite powder and expanded graphite powder produced. The layer spacing of graphite has been increased significantly due to heat treatment in producing expanded graphite, as revealed by the SEM and TEM images (Figure 4C(i,ii),D respctively).
Figure 4.
(A) XRD spectrum, (B) Raman spectrum, (C-i and C-ii) TEM images, and (D) SEM image of expanded graphite produced from graphite powder obtained by delaminating graphite content attached to stones that are discarded from graphite mines which were subjected to the heat treatment.
The electrical conductivity of EG, measured using the VK-PA-25 PV power analyzer by the four-probe method, gives a value of 1.2 × 10⁴ S cm–1 at room temperature and is slightly lower than that of graphite (2 to 3 × 10⁵//basal plane and 3.3 × 10² ⊥ basal plane).22 However, such a high conductivity of EG merits its application as the back contact of the perovskite solar cell. The commonly used back contact is gold, with an electrical conductivity of 4.42 × 10⁵ S cm–1.23 The expanded graphite used in this study has 40 times less conductivity than that of gold, though cost-wise, the former is more than a thousand times cheaper than the latter. Therefore, replacing gold with EG as a back contact in the perovskite solar cell has a significant practical advantage.
Perovskite Solar Cell Characteristics
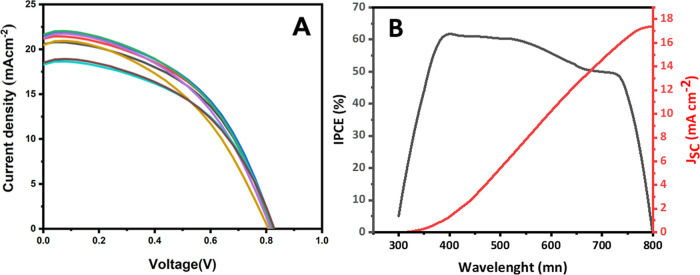
Figure 5A shows the J–V characteristics of the PSCs prepared using CSAC hole transporting material and expanded graphite back contact for seven such cells produced to check the reproducibility of the results. The solar cell parameters, short-circuit current density (JSC), open-circuit voltage (VOC), fill factor (FF), and conversion efficiency (η) are tabulated in Table 1.
Figure 5.
(A) Current density–voltage (J–V) characteristics of seven PSCs and (B) incident photon to current conversion efficiency (IPCE) of the best perovskite solar cell (black, left ordinate) and integrated photocurrent density (red, right ordinate) prepared utilizing coconut shell-based activated carbon hole transporting material and expanded graphite back contact.
Table 1. Solar Cell Parameters (Average of Three Measurements) of Seven Perovskite Cells Made Using Coconut Shell-Based Activated Carbon Hole Transporting Material and Expanded Graphite Back Contact.
| Isc (mA) | Jsc (mA cm–2) | Voc (V) | FF | η (%) |
|---|---|---|---|---|
| 1.50 ± 0.01 | 21.51 ± 0.06 | 0.823 ± 0.003 | 0.49 ± 0.01 | 8.60 ± 0.10 |
| 1.27 ± 0.02 | 18.25 ± 0.05 | 0.827 ± 0.002 | 0.49 ± 0.01 | 7.49 ± 0.08 |
| 1.44 ± 0.02 | 20.54 ± 0.04 | 0.820 ± 0.001 | 0.49 ± 0.01 | 8.21 ± 0.14 |
| 1.48 ± 0.01 | 21.14 ± 0.04 | 0.823 ± 0.003 | 0.48 ± 0.01 | 8.44 ± 0.28 |
| 1.51 ± 0.01 | 21.57 ± 0.07 | 0.820 ± 0.001 | 0.48 ± 0.01 | 8.46 ± 0.15 |
| 1.47 ± 0.02 | 21.25 ± 0.05 | 0.813 ± 0.003 | 0.46 ± 0.01 | 7.97 ± 0.32 |
| 1.43 ± 0.01 | 20.44 ± 0.04 | 0.804 ± 0.004 | 0.44 ± 0.01 | 7.31 ± 0.17 |
It is interesting to note the high reproducibility of the data obtained for all the cells. Although JSC and VOC are in reasonable ranges, the FF values are lower, between 0.44 and 0.49. Although the electrical conductivities of expanded graphite and CSAC are reasonably high, the low FF is possibly due to poor contact between the materials in the solid state. The FF due to series resistance, FFs, is related to that without the series resistance, FF0, empirically by eq 1.
| 1 |
As such, we have determined RS and other parameters of the solar cell using AC impedance analysis, and the analysis of the results obtained will be described in a subsequent section (vide infra).
Mundhaas et al. reported that the FF of PSCs is considerably lower than that of GaAs and Si solar cells.24 They have also shown that the FF loss in PSCs arises mainly from the series resistance. Pegu et al. used dibenzo-tetraphenyl diindeno as the hole transport layer in PSCs and obtained a 9.10% conversion efficiency.25 Although the low-cost hole transport layer and the back contact used in our device gives similar values for all other parameters except for a slightly lower FF, which has contributed to a slightly lower conversion efficiency of (8.60 ± 0.10) %. Their Table 1 shows that when Spiro-OMeTAD is used as the hole transporting material, the conversion efficiency is between 3.12 and 4.89% for MAPbBr3 and FAPbBr3 PSCs, where they obtained higher VOC and FF values but much lower JSC values. The lower JSC is probably due to the effect of reducing the current, I, when there is a considerable RS involved (eq 2).
| 2 |
where IPh is the photogenerated current, q is the charge, T is the absolute temperature, k is the Boltzmann constant, and n is the ideality factor.
Maqsood et al. published results on PSCs based on a compact, smooth FA0.1MA0.9PbI3 film and obtained an efficiency exceeding 22% using the Spiro-OMeTAD hole conductor.26 Gheno et al. described the solar cell performance of PSCs based on different hole transport materials.27 The cell based on the Spiro-OMeTAD hole conductor has a VOC of 1130 mV, JSC of 22.79 mA cm–2, FF of 0.75, and consequently a conversion efficiency of 19.3% for a cell with a 0.10 cm2 surface area. In addition, they also give these data for PSCs utilizing 20 different organic-type hole conductors, where efficiencies in the range of 10.93–19.30% have been quoted, giving relevant references. However, one factor to note here is that almost all these whole conductor materials have to be synthesized chemically, thus adding a burden to the environment due to waste chemical disposal and the associated high cost of synthesis. In comparison to these results, the device that we have made gives the best values for VOC, JSC, FF, and η values, which are 0.835 V, 21.57 mA cm–2, 0.49, and 8.69%, respectively, when inexpensive hole transport material and back contact are used. Table 2 gives the cost comparison of the materials used as a hole conductor and back contact in the present research (CSAC and expanded graphite, respectively) and those traditionally used (spiro-OMETAD and gold, respectively). A detailed analysis of the costs involved is given in the Supporting Information SI-1.
Table 2. Cost Comparison of CSAC, Spiro-OMeTAD, Expanded Graphite, and Gold.
It is apparent that the performance could be improved if FF could be enhanced. The lower FF is due partly to the improper adhesion of the CSAC layer to the perovskite layer due to the powder pressing method used to introduce CSAC to the device. Due to the insolubility of the material, it is not easy to find a suitable solvent to solvent-cast the hole transport layer. However, there is a possibility to form stable colloidal dispersions of CSAC, and we are currently working on improving the fill factor of the device by properly attaching a CSAC hole conductor via a solution casting process. Figure 5B shows the IPCE spectrum in the wavelength range of 300–800 nm for cell no. 1, which gave the best conversion efficiency. The highest IPCE of ∼62% was observed at a wavelength of ∼400 nm. The integrated current density is 17.40 mA cm–2, which is lower than the JSC value achieved from the J–V curve. Instruments and test environments may have caused this difference.
Electrochemical Impedance Measurements
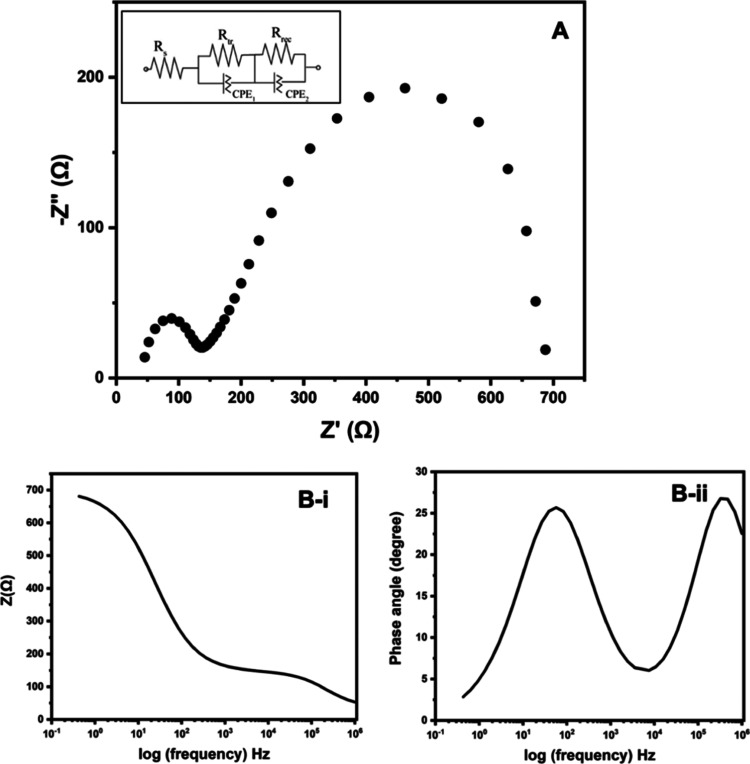
The Nyquist plot obtained for the cell that gives the best performance is shown in Figure 6A. The Nyquist plot was fitted to several possible equivalent circuits (ESs), which could be used to describe the features of the PSC. The best and perfect fit was obtained for the ES given as the inset in Figure 6A. The extracted data are tabulated in Table 3. In this, the circuit element RS describes the overall series resistance of the PSC and is represented by the real axis intercept. The electron transport resistance (Rtr) in parallel combination with the constant phase element CPE1 describing the electrical double layer capacitance (an imperfect capacitor) gives the first semicircle appearing in the high frequency regime next to the x-axis intercept. The ion diffusion in the electrolyte is described by the Warburg impedance, W, which is also an example of a constant phase element for which the phase angle is a constant 45° and is independent of frequency. Although W usually appears in serial connection with other circuit elements, interestingly, for the PSC, the serially connected W with the other circuit elements in the ES does not give a good fit. Here, W appears as CPE2, which in parallel connection with the recombination resistance, Rrec. An equivalent circuit for a parallelly connected resistor and a constant phase element gives a semicircle in the Nyquist plot. As such, the ES used clearly explains the overall circuit elements that represent electrical components associated with the PSC. The Bode plots given in Figure 6B also complement the data obtained from the Nyquist plot. The two parallelly connected resistors and CPEs are evident from both total impedance versus log(frequency) (Figure 6B(i)) and phase angle versus log(frequency) (Figure 6B(ii)) Bode plots.
Figure 6.
(A) Nyquist plot, (B-i) Bode plot of total impedance versus log(frequency), and (B-ii) Bode plot of phase angle versus log(frequency) of the perovskite solar cell device described in this research. Inset in figure (A) gives the equivalent circuit that fits perfectly with the experimental results of the Nyquist plot.
Table 3. EIS Parameters of PSC Determined by Fitting the Experimental Data to the Equivalent Circuit Mode.
| parameter | Rs/Ω | Rtr/Ω | CPE1/nMho | Rrec/Ω | CPE2/μMho |
|---|---|---|---|---|---|
| value | 37.6 | 108.0 | 140.0 | 555.0 | 66.7 |
As the data suggest, both the series resistance, Rs, and the recombination resistance, Rrec, are affecting the FF.
Assuming the ideal FF to be 1 and taking ISC and VOC values to be 1.51 mA and 0.823 V, eq 1 gives the drop (FF0 – FFs) in the FF due to Rs (37.6 Ω) of 0.075. Similarly, the drop (FF0 – FFrec) of FF due to Rrec (555 Ω) calculated from eq 3 is 0.926.
| 3 |
The fact that there is no such drastic reduction of the FF by 0.926 in the practical device suggests that the recombination resistance is not fully acting on the FF as it overestimates the loss of the FF. At the same time, the lowering of the FF due to the effect of the series resistance is underestimating the loss. It is, therefore, possible that a more sophisticated relationship connecting both Rs and Rrec to the loss of FF is required to accurately predict the lowering of FF due to these resistance components. We are currently investigating this relationship. In any case, it is clear that both the series and recombination resistances of the PSCs have to be reduced to obtain a good FF and increased conversion efficiency.
Device stability is an important factor in determining the overall performance of a solar cell device. It is also one of the major obstacles that prevent PSCs from being commercialized. Perovskite is notoriously unstable in the presence of moisture.30,31 Different techniques, such as additive, interface, and structural engineering methods, are currently being used to overcome this stability issue.32−34 The stability of the PSC was determined while it was stored in dark and ambient conditions. The un-encapsulated device lost 60% of its performance after 60 days. This may be due to the hygroscopic nature of CSAC. But, we believe that proper encapsulation will solve this issue, and we are currently working on encapsulating the device.
Conclusions
A low-cost perovskite solar cell was fabricated without the use of a p-type semiconductor as the hole collector or a separate counter electrode. For the counter electrode, we were able to fabricate a base structure with expanded graphite. To increase the contact between the working electrode and the counter electrode and facilitate hole extraction, activated coconut shell charcoal was incorporated by the powder pressing method. The use of discarded graphite extracted from mine waste to produce expanded graphite, a low-cost method of charcoal activation, and the deceptively simple powder pressing method have enabled us to drastically reduce the fabrication cost of the device. The PSC fabrication gave an efficiency of (8.60 ± 0.10) % under 1.5 AM simulated sunlight and ambient conditions. We have identified that a lower fill factor is responsible for the lower conversion efficiency, and we are currently investigating improvements to fabrication technology to improve the solar cell performance of the low-cost perovskite solar cell described here.
Glossary
Abbreviations
- PSC
perovskite solar cell
- FF
fill factor
- DSC
dye-sensitized solar cell
- FTO
fluorine-doped tin oxide
- HTM
hole transport material
- EG
expanded graphite
- CSAC
coconut shell-based activated carbon
- PP
powder pressing
- IG
intercalated graphite
- rGO
reduced graphene oxide
- XRD
X-ray diffractogram
- RS
Raman spectrum
- TEM
transmission electron microscope
- SEM
scanning electron microscope
- ES
equivalent circuits
- JSC
short-circuit current density
- VOC
open-circuit voltage
- η
conversion efficiency
- IPCE
incident photon to current conversion efficiency
- CPE
constant phase element
Supporting Information Available
The Supporting Information is available free of charge at https://pubs.acs.org/doi/10.1021/acsomega.3c00637.
Cost analysis of the synthesis of active carbon and cost analysis of the synthesis of the expanded graphite form graphite (PDF)
This work was financially supported by the National Science Foundation, Sri Lanka [grant number RG/2018/BS/03].
The authors declare no competing financial interest.
Supplementary Material
References
- Liang C.; Li P.; Zhang Y.; Gu H.; Cai Q.; Liu X.; Wang J.; Wen H.; Shao G. Mild Solution-Processed Metal-Doped TiO2 Compact Layers for Hysteresis-Less and Performance-Enhanced Perovskite Solar Cells. J. Power Sources 2017, 372, 235–244. 10.1016/J.JPOWSOUR.2017.10.079. [DOI] [Google Scholar]
- Wang B.; Ma J.; Li Z.; Chen G.; Gu Q.; Chen S.; Zhang Y.; Song Y.; Chen J.; Pi X.; Yu X.; Yang D. Bioinspired Molecules Design for Bilateral Synergistic Passivation in Buried Interfaces of Planar Perovskite Solar Cells. Nano Res. 2022, 15, 1069–1078. 10.1007/S12274-021-3600-Z/METRICS. [DOI] [Google Scholar]
- Jiang Q.; Zhao Y.; Zhang X.; Yang X.; Chen Y.; Chu Z.; Ye Q.; Li X.; Yin Z.; You J. Surface Passivation of Perovskite Film for Efficient Solar Cells. Nat. Photonics 2019, 13, 460–466. 10.1038/s41566-019-0398-2. [DOI] [Google Scholar]
- Zhang Y.; Liu X.; Li P.; Duan Y.; Hu X.; Li F.; Song Y. Dopamine-Crosslinked TiO2/Perovskite Layer for Efficient and Photostable Perovskite Solar Cells under Full Spectral Continuous Illumination. Nano Energy 2019, 56, 733–740. 10.1016/J.NANOEN.2018.11.068. [DOI] [Google Scholar]
- Fu C.; Gu Z.; Tang Y.; Xiao Q.; Zhang S.; Zhang Y.; Song Y. From Structural Design to Functional Construction: Amine Molecules in High-Performance Formamidinium-Based Perovskite Solar Cells. Angew. Chem. 2022, 134, e202117067 10.1002/ANGE.202117067. [DOI] [PubMed] [Google Scholar]
- Best Research-Cell Efficiency Chart|Photovoltaic Research|NREL. https://www.nrel.gov/pv/cell-efficiency.html (accessed on December 10, 2021).
- Tan B.; Raga S. R.; Chesman A. S. R.; Fürer S. O.; Zheng F.; McMeekin D. P.; Jiang L.; Mao W.; Lin X.; Wen X.; Lu J.; Cheng Y.-B.; Bach U. LiTFSI-Free Spiro-OMeTAD-Based Perovskite Solar Cells with Power Conversion Efficiencies Exceeding 19%. Adv. Energy Mater. 2019, 9, 1901519. 10.1002/aenm.201901519. [DOI] [Google Scholar]
- Liu Y.; Hu Y.; Zhang X.; Zeng P.; Li F.; Wang B.; Yang Q.; Liu M. Inhibited Aggregation of Lithium Salt in Spiro-OMeTAD toward Highly Efficient Perovskite Solar Cells. Nano Energy 2020, 70, 104483. 10.1016/j.nanoen.2020.104483. [DOI] [Google Scholar]
- Alharbi E. A.; Alyamani A. Y.; Kubicki D. J.; Uhl A. R.; Walder B. J.; Alanazi A. Q.; Luo J.; Burgos-Caminal A.; Albadri A.; Albrithen H.; Alotaibi M. H.; Moser J. E.; Zakeeruddin S. M.; Giordano F.; Emsley L.; Grätzel M. Atomic-Level Passivation Mechanism of Ammonium Salts Enabling Highly Efficient Perovskite Solar Cells. Nat. Commun. 2019, 10, 3008. 10.1038/s41467-019-10985-5. [DOI] [PMC free article] [PubMed] [Google Scholar]
- Zhang F.; Wang Z.; Zhu H.; Pellet N.; Luo J.; Yi C.; Liu X.; Liu H.; Wang S.; Li X.; Xiao Y.; Zakeeruddin S. M.; Bi D.; Grätzel M. Over 20% PCE Perovskite Solar Cells with Superior Stability Achieved by Novel and Low-Cost Hole-Transporting Materials. Nano Energy 2017, 41, 469–475. 10.1016/j.nanoen.2017.09.035. [DOI] [Google Scholar]
- Daskeviciene M.; Paek S.; Wang Z.; Malinauskas T.; Jokubauskaite G.; Rakstys K.; Cho K. T.; Magomedov A.; Jankauskas V.; Ahmad S.; Snaith H. J.; Getautis V.; Nazeeruddin M. K. Carbazole-Based Enamine: Low-Cost and Efficient Hole Transporting Material for Perovskite Solar Cells. Nano Energy 2017, 32, 551–557. 10.1016/j.nanoen.2017.01.015. [DOI] [Google Scholar]
- Zhao G.; Cai Q.; Liu X.; Li P.; Zhang Y.; Shao G.; Liang C. PbS QDs as Electron Blocking Layer Toward Efficient and Stable Perovskite Solar Cells. IEEE J. Photovoltaics 2019, 9, 194–199. 10.1109/JPHOTOV.2018.2877003. [DOI] [Google Scholar]
- Etgar L.; Gao P.; Xue Z.; Peng Q.; Chandiran A. K.; Liu B.; Nazeeruddin M. K.; Grätzel M. Mesoscopic CH3NH3PbI3/TiO2 heterojunction solar cells. J. Am. Chem. Soc. 2012, 134, 17396–17399. 10.1021/ja307789s. [DOI] [PubMed] [Google Scholar]
- Lv F.; Yao Y.; Xu C.; Liu D.; Liao L.; Wang G.; Zhou G.; Zhao X.; Liu D.; Yang X.; Song Q. Elimination of Charge Transport Layers in High-Performance Perovskite Solar Cells by Band Bending. ACS Appl. Energy Mater. 2021, 4, 1294–1301. 10.1021/ACSAEM.0C02535/SUPPL_FILE/AE0C02535_SI_001.PDF. [DOI] [Google Scholar]
- Uthayaraj S.; Karunarathne D.; Kumara G.; Murugathas T.; Rasalingam S.; Rajapakse R.; Ravirajan P.; Velauthapillai D. Powder Pressed Cuprous Iodide (CuI) as A Hole Transporting Material for Perovskite Solar Cells. Materials 2019, 12, 2037. 10.3390/ma12132037. [DOI] [PMC free article] [PubMed] [Google Scholar]
- National Institute of Fundamental Studies . A Method of Recovering Waste Graphite Attached to Wall Rocks in Vain Graphite Mines 19596: Sri Lanka, 2020.
- Stobinski L.; Lesiak B.; Malolepszy A.; Mazurkiewicz M.; Mierzwa B.; Zemek J.; Jiricek P.; Bieloshapka I. Graphene Oxide and Reduced Graphene Oxide Studied by the XRD, TEM and Electron Spectroscopy Methods. J. Electron Spectros. Relat. Phenomena 2014, 195, 145–154. 10.1016/j.elspec.2014.07.003. [DOI] [Google Scholar]
- Lavin-Lopez M. P.; Paton-Carrero A.; Sanchez-Silva L.; Valverde J. L.; Romero A. Influence of the Reduction Strategy in the Synthesis of Reduced Graphene Oxide. Adv. Powder Technol. 2017, 28, 3195–3203. 10.1016/j.apt.2017.09.032. [DOI] [Google Scholar]
- Sadezky A.; Muckenhuber H.; Grothe H.; Niessner R.; Pöschl U. Raman Microspectroscopy of Soot and Related Carbonaceous Materials: Spectral Analysis and Structural Information. Carbon N. Y. 2005, 43, 1731–1742. 10.1016/j.carbon.2005.02.018. [DOI] [Google Scholar]
- Keppetipola N. M.; Dissanayake M.; Dissanayake P.; Karunarathne B.; Dourges M. A.; Talaga D.; Servant L.; Olivier C.; Toupance T.; Uchida S.; Tennakone K.; Kumara G. R. A.; Cojocaru L. Graphite-Type Activated Carbon from Coconut Shell: A Natural Source for Eco-Friendly Non-Volatile Storage Devices. RSC Adv. 2021, 11, 2854–2865. 10.1039/d0ra09182k. [DOI] [PMC free article] [PubMed] [Google Scholar]
- Huang H. H.; De Silva K. K. H.; Kumara G. R. A.; Yoshimura M. Structural Evolution of Hydrothermally Derived Reduced Graphene Oxide. Sci. Rep. 2018, 8, 6849. 10.1038/s41598-018-25194-1. [DOI] [PMC free article] [PubMed] [Google Scholar]
- Reynolds J. M.; Hemstreet H. W.; Leinhardt T. E. The Electrical Resistance of Graphite at Low Temperatures. Phys. Rev. 1953, 91, 1152–1155. 10.1103/PhysRev.91.1152. [DOI] [Google Scholar]
- TIBTECH Innovations . Metal properties comparison: electric conductivity, thermal conductivity, density, melting temperature. https://www.tibtech.com/conductivite.php?lang=en_US (accessed on December 10, 2021).
- Mundhaas N.; Yu Z. J.; Bush K. A.; Wang H. P.; Häusele J.; Kavadiya S.; McGehee M. D.; Holman Z. C. Series Resistance Measurements of Perovskite Solar Cells Using Jsc – Voc Measurements. Sol. RRL 2019, 3, 1800378. 10.1002/solr.201800378. [DOI] [Google Scholar]
- Pegu M.; Caliò L.; Ahmadpour M.; Rubahn H. G.; Kazim S.; Madsen M.; Ahmad S. Dibenzo-Tetraphenyl Diindeno as Hole Transport Layer for Perovskite Solar Cells Fabrication. ChemRxiv 2020, 10.26434/chemrxiv.11952267. [DOI] [Google Scholar]
- Maqsood A.; Li Y.; Meng J.; Song D.; Qiao B.; Zhao S.; Xu Z. Perovskite Solar Cells Based on Compact, Smooth FA0.1MA0.9PbI3 Film with Efficiency Exceeding 22. Nanoscale Res. Lett. 2020, 15, 89. 10.1186/s11671-020-03313-0. [DOI] [PMC free article] [PubMed] [Google Scholar]
- Gheno A.; Vedraine S.; Ratier B.; Bouclé J. π-Conjugated Materials as the Hole-Transporting Layer in Perovskite Solar Cells. Metals 2016, 6, 21. 10.3390/met6010021. [DOI] [Google Scholar]
- Spiro-OMeTAD—Solaronix Online Shop. https://shop.solaronix.com/spiro-ometad.html (accessed on March 9, 2023).
- Wire—Vacuum Evaporation Deposition Wire and Materials. https://www.tedpella.com/vacuum_html/Materials_and_Wires_for_Vacuum_Evaporation_Deposition.aspx (accessed on March 9, 2023).
- Zhao X.; Park N. G. Stability Issues on Perovskite Solar Cells. Photonics 2015, 2, 1139–1151. 10.3390/PHOTONICS2041139. [DOI] [Google Scholar]
- Wang D.; Wright M.; Elumalai N. K.; Uddin A. Stability of Perovskite Solar Cells. Sol. Energy Mater. Sol. Cells 2016, 147, 255–275. 10.1016/J.SOLMAT.2015.12.025. [DOI] [Google Scholar]
- Grancini G.; Roldán-Carmona C.; Zimmermann I.; Mosconi E.; Lee X.; Martineau D.; Narbey S.; Oswald F.; De Angelis F.; Graetzel M.; Nazeeruddin M. K. One-Year Stable Perovskite Solar Cells by 2D/3D Interface Engineering. Nat. Commun. 2017, 8, 15684–15688. 10.1038/ncomms15684. [DOI] [PMC free article] [PubMed] [Google Scholar]
- Yan L.; Ma J.; Li P.; Zang S.; Han L.; Zhang Y.; Song Y. Charge-Carrier Transport in Quasi-2D Ruddlesden–Popper Perovskite Solar Cells. Adv. Mater. 2022, 34, 2106822. 10.1002/ADMA.202106822. [DOI] [PubMed] [Google Scholar]
- Zhang F.; Zhu K. Additive Engineering for Efficient and Stable Perovskite Solar Cells. Adv. Energy Mater. 2020, 10, 1902579. 10.1002/AENM.201902579. [DOI] [Google Scholar]
Associated Data
This section collects any data citations, data availability statements, or supplementary materials included in this article.


