

Abstract
Background:
Diffusion MRI (dMRI) is known to be sensitive to hypoxic–ischemic encephalopathy (HIE). However, existing dMRI studies used simple diffusion tensor metrics and focused only on a few selected cerebral regions, which cannot provide a comprehensive picture of microstructural injury.
Purpose:
To systematically characterize the microstructural alterations in mild, moderate, and severe HIE neonates compared to healthy neonates with advanced dMRI using region of interest (ROI), tract, and fixel-based analyses.
Study Type:
Prospective.
Population:
A total of 42 neonates (24 males and 18 females).
Field Strength/Sequence:
3-T, diffusion-weighted echo-planar imaging.
Assessment:
Fractional anisotropy (FA), mean diffusivity (MD), radial diffusivity (RD), axial diffusivity (AD), fiber density (FD), fiber cross-section (FC), and fiber density and cross-section (FDC) were calculated in 40 ROIs and 6 tracts. Fixel-based analysis was performed to assess group differences in individual fiber components within a voxel (fixel).
Statistical Tests:
One-way analysis of covariance (ANCOVA) to compare dMRI metrics among severe/moderate/mild HIE and control groups and general linear model for fixel-wise group differences (age, sex, and body weight as covariates). Adjusted P value < 0.05 was considered statistically significant.
Results:
For severe HIE, ROI-based analysis revealed widespread regions, including the deep nuclei and white matter with reduced FA, while in moderate injury, only FC was decreased around the posterior watershed zones. Tract-based analysis demonstrated significantly reduced FA, FD, and FC in the right inferior fronto-occipital fasciculus (IFOF), right inferior longitudinal fasciculus (ILF), and splenium of corpus callosum (SCC) in moderate HIE, and in right IFOF and left anterior thalamic radiation (ATR) in mild HIE. Correspondingly, we found altered fixels in the right middle-posterior IFOF and ILF, and in the central-to-right part of SCC in moderate HIE.
Data Conclusion:
For severe HIE, extensive microstructural injury was identified. For moderate–mild HIE, association fiber injury in posterior watershed area with a rightward lateralization was found.
Evidence Level:
1
Technical Efficacy:
Stage 3
As one of the most common neurological disorders in newborns, hypoxic–ischemic encephalopathy (HIE) has been a major cause of neurodevelopmental disabilities.1,2 The incidence of HIE is nearly 2–5 in 1000,3 and approximately 30%–40% of newborns with HIE may die and 20%–40% may develop life-long neurological sequelae.3 In term-born neonates, HIE is clinically classified into mild, moderate, and severe HIE, according to the Sarnat staging system.4 From MR imaging, severe HIE is characterized by lesions in metabolically active tissues such as the basal ganglia/thalamus (BGT) and also white matter (WM) such as the posterior limb of the internal capsule (PLIC).2 Moderate-to-mild HIE typically results in injury in watershed areas that involve the periventricular WM,2,5 but the injury pattern and neuroimaging markers are not well defined.
Imaging using T1- and T2-weighted sequences, diffusion MRI (dMRI), and MR spectroscopy has been widely used in the diagnosis of HIE.6 For example, Chalela et al found BGT and hippocampal injuries on T2-weighted MRI in neonatal HIE.7 Liauw et al reported T1-hyperintensities in the posterolateral putamen and peri-rolandic cortex but hypo-intensities in PLIC and the corona radiata (CR) in HIE patients.8 dMRI, on the other hand, is able to depict restricted water movement shaped by the tissue microstructural environment and thus is sensitive to HIE where a chain of microstructural changes takes place, such as cell swelling, astrocyte activation, and neurite beading.9 Hence, dMRI can capture HIE injury within the first few hours of life, before conventional T1- and T2-weighted MRI shows distinct lesions.10
Most dMRI studies of neonatal HIE focused on the apparent diffusion coefficient (ADC) or mean diffusivity (MD) measurement,11,12 which is a sensitive marker of ischemic infarction but lacks specificity to pinpoint the underlying microstructural change, given that cell swelling, change of the extracellular/intracellular diffusivity, and neurite beading could all lead to ADC reduction. Several studies employed the diffusion tensor imaging (DTI) model and generated the fractional anisotropy (FA) to evaluate WM integrity in HIE newborns.13–15 Yet, it does not reveal specific microstructural properties, given that both loss of fibers and demyelination could result in reduced FA. More recently, high-order dMRI models have been developed to resolve crossing fibers and quantify WM microstructural properties.16,17 For example, multiple fiber orientation distribution (FOD) could be reconstructed, based on which microstructural features such as fiber density (FD) and fiber cross-section (FC) could be obtained.18,19 The advantages of these methods have been demonstrated in neurological diseases,20 but not in neonatal HIE.
Moreover, previous dMRI studies of neonatal HIE typically used region of interest (ROI)-based analysis by manually selecting ROIs at high risk,14,15 with a focus on the BGT and PLIC. Whole-brain analysis was rarely reported in HIE studies.11,21 Tract-based spatial statistics (TBSS) has been tested in HIE infants, which showed comparable power in detecting group-wise differences compared to manual ROI labeling.13,22 More detailed analysis, such as tract-based analysis (TBA) that could locate abnormal segments along the tract.23 Moreover, fixel-based analysis (FBA; individual FODs within a voxel) could reveal microstructural changes along each fiber component in a voxel-wise manner.18,19
The use of microstructural features and detailed analysis may better elucidate WM injury patterns in HIE, especially in mild–moderate HIE. Therefore, in this study, we aimed to perform a systematic evaluation of the microstructural changes of tissues across the whole-brain with ROI-based, tract-based, and fixel-based analyses, from mild to severe HIE injuries. Particularly, we focused on the moderate HIE group, who has been characterized to have mild or moderate neurosensory deafness, hemiplegia, or visual impairment,1 but the WM injury pattern in this population is unclear.
Materials and Methods
The study was approved by the Institutional Research Board at the local hospital (2018-IRB-107). Written informed consents were provided by the parents or legal guardians of all control subjects and patients before the MRI scan.
Participants
A total of 74 neonates, including 14 severe HIE, 18 moderate HIE, 16 mild HIE, and 26 healthy neonates, were enrolled from February 2019 to December 2021. The degree of HIE was defined by the neonatologists (S.X. and M.X. with 10 and 20 years of experiences) based on the Sarnat score.4 The HIE neonates were enrolled due to one or more of the following acute peripartum or intrapartum events: 1) Apgar score < 5 at 5 minutes and 10 minutes after birth; 2) umbilical artery blood pH < 7.0, base deficit ≥12 mmol/L, or both; 3) symptoms of the nervous system shortly after birth that lasted for more than 24 hours, including changes in consciousness, changes in muscle tone, abnormal primordial reflexes, seizure, central respiration failure, and pupil changes. Cases with acute encephalopathy due to other causes and nonacute brain injury that occurred in utero were excluded. Hypothermia was applied to majority of the severe and moderate HIE and selected mild HIE, which was initiated as soon as the patients were administrated and lasted for 72 hours. The control neonates were referred for MRI due to febrile seizures, and who were otherwise diagnosed as normal clinically and by imaging.
According to the flowchart in Fig. 1, 19 subjects were excluded due to incomplete dMRI data; 6 were excluded because their postmenstrual age (PMA) at scan were over 30 days; four out of the nine severe HIE neonates with extremely severe injury were excluded as the drastic changes of dMRI signals affected image registration and segmentation; one moderate HIE neonate and two control neonates with abnormal dMRI measurements (outside 3-fold standard deviation of the group) were also excluded. Finally, 5 severe HIE, 13 moderate HIE, 13 mild HIE neonates, and 11 controls were included in the statistical analysis.
FIGURE 1:
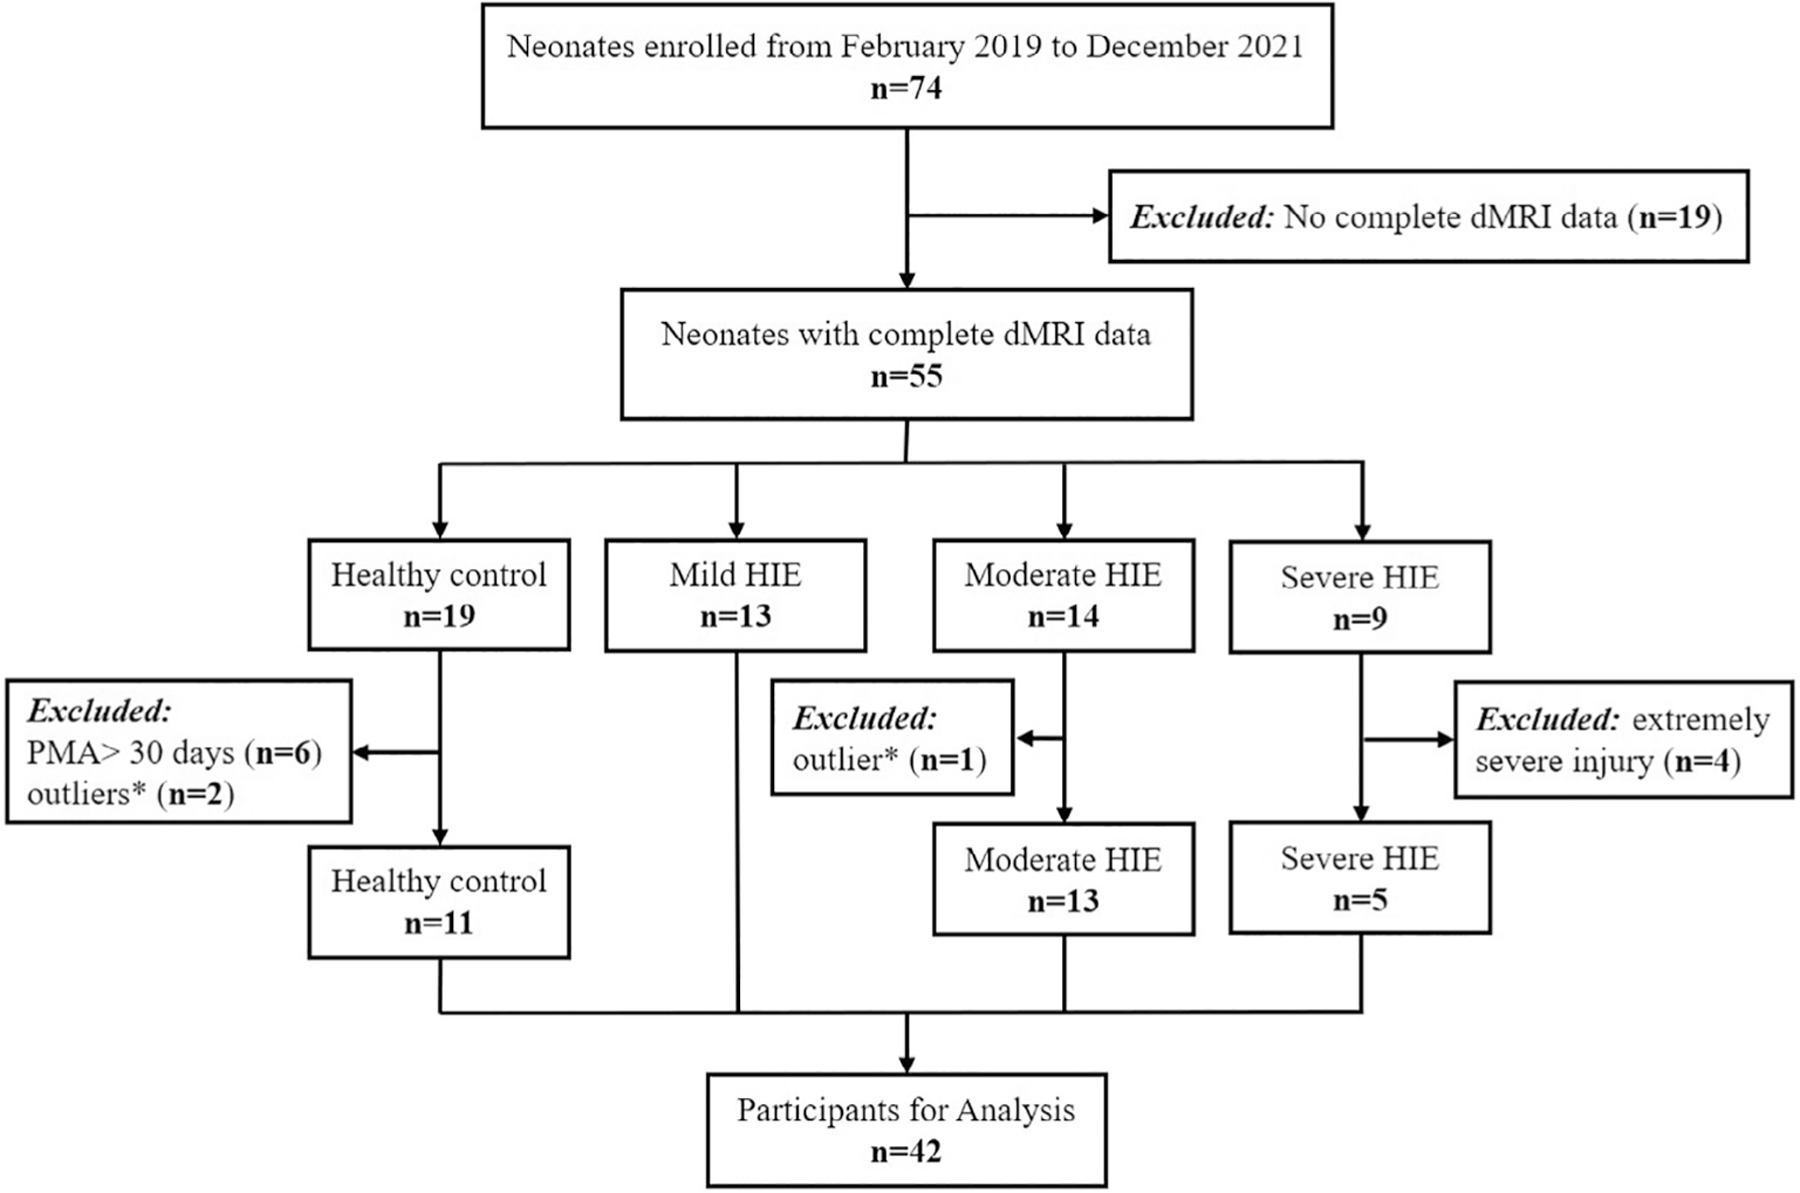
Flowchart shows participant enrollment. * outlier means one or more of the dMRI metrics were outside 3-fold of standard deviation of this group. dMRI = diffusion magnetic resonance imaging; HIE = hypoxic-ischemic encephalopathy.
Data Acquisition
MRI scans were performed at the earliest possible time after hypothermia or other necessary interventions. All MRI data were collected on a 3-T system (Achieva, Philips Healthcare, Best, The Netherlands), equipped with a gradient system of maximum gradient strength = 80 mT/m and maximum slew rate = 100 mT/m/msec and an eight-channel head coil. The neonates were sedated half an hour before scan using 10% chloral hydrate (0.5 mL/kg) via enema administration. During the scan, the neonates were wrapped using a vacuum immobilization mat to minimize motion, and earmuffs were used to attenuate the scanner noise. The physiological conditions including heart and respiratory rates were continuously monitored, and a neonatologist was always present in the scanner room for the safety check and first aid.
The dMRI data were acquired using a diffusion-weighted echo-planar imaging sequence with the following parameters: repetition time/echo time = 7177/73 msec, one non-diffusion-weighted volume, two b-values at b = 800 sec/mm2 and 1500 sec/mm2, and 15 directions per b-value, in-plane resolution of 1.4 × 1.4 mm2, 60 slices with a slice thickness of 2 mm, and scan time = 6 minutes 40 seconds, and we did not perform multiple averages for faster scan.
dMRI Preprocessing
The preprocessing used a standard pipeline20 in MRtrix3 (https://www.mrtrix.org/),24 including realignment, denoising, Gibbs ringing removal, eddy-current correction, motion correction, bias field correction, and up-sampling to 1.3 mm isotropic resolution for postprocessing.
ROI-Based Analysis
The pipeline for ROI-based analysis is shown in Fig. 2a. Diffusion tensor fitting was performed using MRtrix3, and FA, MD, axial diffusivity (AD), radial diffusivity (RD) were obtained. The brains were segmented into 126 ROIs defined in the John Hopkins University (JHU) Neonatal Atlas.25 We registered the subject brains to the atlas brain via affine and nonlinear registration based on the FA, mean diffusion-weighted image, and b0 contrasts. The tensor- and fixel-based metrics were obtained from each ROI in the atlas space. In this study, we focused on the WM and deep gray matter (GM) regions. Since some of the structures, such as corpus callosum, basal ganglia, corona radiate, corticospinal tract, were divided to subregions in the JHU atlas that we did not need. We merged some of the small ROIs (eg anterior, superior, and posterior parts of corona radiate) to 40 ROIs bilaterally for the following analysis (Supplementary Fig. S1).
FIGURE 2:
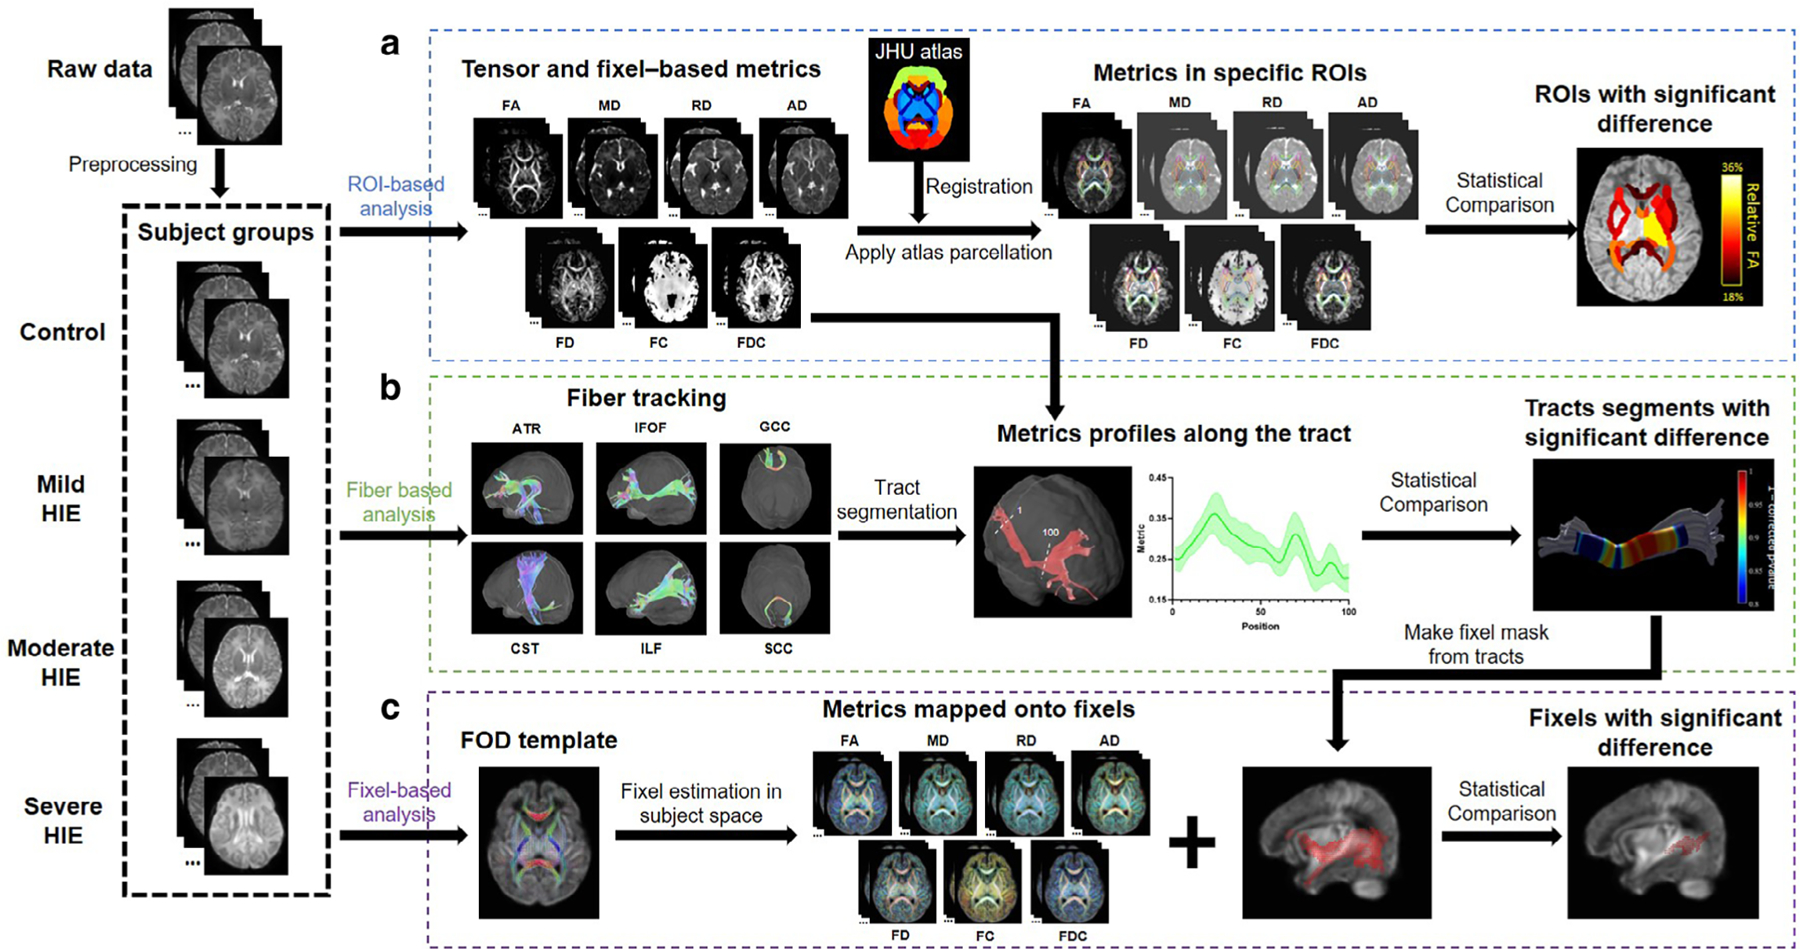
Pipeline of dMRI-based analysis of mild, moderate, and HIE neonates at ROI, tract and fixel levels. (a) For all subjects, tensor-based (FA, MD, RD, AD) and fixel-based (FD, FC, FDC) metrics were calculated. Affine and nonlinear registrations between individual subjects and the JHU atlas were performed for brain segmentation. In template space, averaged metrics were calculated in each ROI for statistical comparison between control group and mild-to-severe HIE groups. (b) Six tracts (ATR, IFOF, GCC, CST, ILF, SCC) were obtained for each subject, which were sampled in 100 segments to obtain the along-tract profiles. For each segment along the tract, statistical comparison was performed between the control and injury groups. (c) FOD were estimated for each subject and a FOD template was obtained, based on which, the microstructural metrics were calculated and transformed to fixel. Then, statistical analysis was performed in the fixel space for the tracts that were found significantly altered. IFOF = inferior fronto-occipital fasciculus; ILF = inferior longitudinal fasciculus; ATR = anterior thalamic radiation; CST = corticospinal tract; GCC = genu of corpus callosum; SCC = splenium of corpus callosum.
Tract-Based Analysis
Fiber tracking and segmentation were performed using Automatic Fiber Quantification (AFQ) toolbox in MATLAB (2020a, Mathworks Inc., Natick, MA, USA). We performed whole-brain deterministic fiber tracking with FA threshold = 0.1, step size = 0.5, minimum length = 50 mm, maximum length = 250 mm, and angle threshold = 30°, and then manually delineated the two waypoint regions to select specific tracts, referring to the AFQ toolbox23 and previous work.26 We finally obtained six tracts that can be robustly tracked in the neonatal brains, including IFOF, ILF, ATR, corticospinal tract (CST), genu of corpus callosum (GCC), and SCC (Supplementary Fig. S2). The tracts were sampled in 100 segments between two waypoint regions to quantify the tract profiles (Fig. 2b).
Fixel-Based Analysis
In FBA (Fig. 2c), individual fiber populations within each voxel, the so-called “fixels” were used as elements for quantification and statistics.19 FODs were estimated by multishell multitissue constrained spherical deconvolution. An unbiased average FOD template was generated using all control and HIE subjects, and then FODs of individual subjects can be transformed to this template to estimate fixel-based indices. FD was calculated based on FOD amplitude and FC was obtained from the transformation between template and individual FODs. To use the fixel-based indices in ROI- and tract-based analyses, the sum of FD and mean of FC in each voxel were used.
Statistical Analysis
The ROI-averaged dMRI metrics, including FA, MD, RD, AD, FD, FC, and fiber density and cross-section (FDC) were compared between the severe, moderate, and mild HIE groups and control neonates, respectively, using Analysis of Covariate (ANCOVA) with gestational age (GA) at birth, sex, PMA at scan, and body weight at birth as covariates. Multiple comparisons among the 40 ROIs was performed with the false discovery rate (FDR). All steps were performed in MATLAB (2020a, Mathworks Inc.).
For the TBA, we first performed group comparisons of the tract-averaged dMRI metrics between the HIE groups and controls using the same covariates as stated earlier, and the P values were adjusted between the 10 tracts bilaterally with FDR correction. We then compared the group difference in individual segments along the tract using ANCOVA with the same covariates, followed by FDR correction between the 100 segments.
For the FBA, we applied a mask including regions that were found to be statistical different between groups based on TBA (Supplementary Fig. S3). Fixel-wise group differences were computed in MRtrix by the general linear model with the same covariates as stated above. P values were calculated for each fixel by permutation tests and corrected across fixels using connectivity-based fixel enhancement.18 An adjusted P value < 0.05 was considered to be statistically significant for all analyses.
In addition to statistical comparison in different levels between HIE groups and healthy controls, we also performed statistical power analysis after comparison. With the number of subjects given, here we calculated the power value and power value >0.9 was considered high statistical power.
Results
Participant Characteristics
In total, 5 severe, 13 moderate, 13 mild HIE, and 11 control neonates were included in the final analysis. The demographic information is listed in Table 1, including sex, PMA, GA, weight at birth, Apgar score at 1 minute, and hypothermia status.
TABLE 1.
Demographic and Clinical Information of the Participants Included in the Final Analysis
| Group | Number | Sex (Male/Female) | PMA (days) | GA (weeks) | Weight at Birth (kg) | Apgar Score at 1 minute | Hypothermia (yes/no) |
|---|---|---|---|---|---|---|---|
| Control | 11 | 7/4 | 13.7 ± 7.3 | 38.0 ± 1.5 | 3.1 ± 0.6 | 9.6 ± 0.5 | 0/11 |
| Mild | 13 | 6/7 | 7.9 ± 3.6* | 38.6 ± 2.1 | 3.2 ± 0.6 | 4.8 ± 3.5** | 3/10 |
| Moderate | 13 | 8/5 | 7.2 ± 3.3** | 39.3 ± 1.6* | 3.3 ± 0.7 | 3.9 ± 2.8** | 11/2** |
| Severe | 5 | 3/2 | 6.2 ± 0.8* | 38.1 ± 2.2 | 2.9 ± 0.5 | 2.6 ± 1.5** | 4/1** |
P < 0.05
P < 0.01 between each patient group and controls by rank-sum test for PMA, GA, weight at birth, and Apgar at birth, and Chi-squared test for sex and hypothermia status.
PMA = post-menstrual age at scan; GA = gestational age at birth.
ROI-Based Analysis
In the severe HIE newborns, we found widespread WM and deep GM regions showing reduced FA (Fig. 3a). Specifically, 33 of 40 ROIs had statistically lower FA in the severe HIE group compared to the controls (Table 2), and the relative difference in WM varied between 13.5% in the left superior longitudinal fasciculus (SLF) and 26.9% in the left IFOF. The deep GM ROIs exhibited even more pronounced FA reductions with 29.5% in the thalamus. After decomposing the MD to RD and AD, we found a trend of RD increase and AD decrease in severe HIE (Supplementary Fig. S4), possibly leading to the reduced FA and unchanged MD.
FIGURE 3:
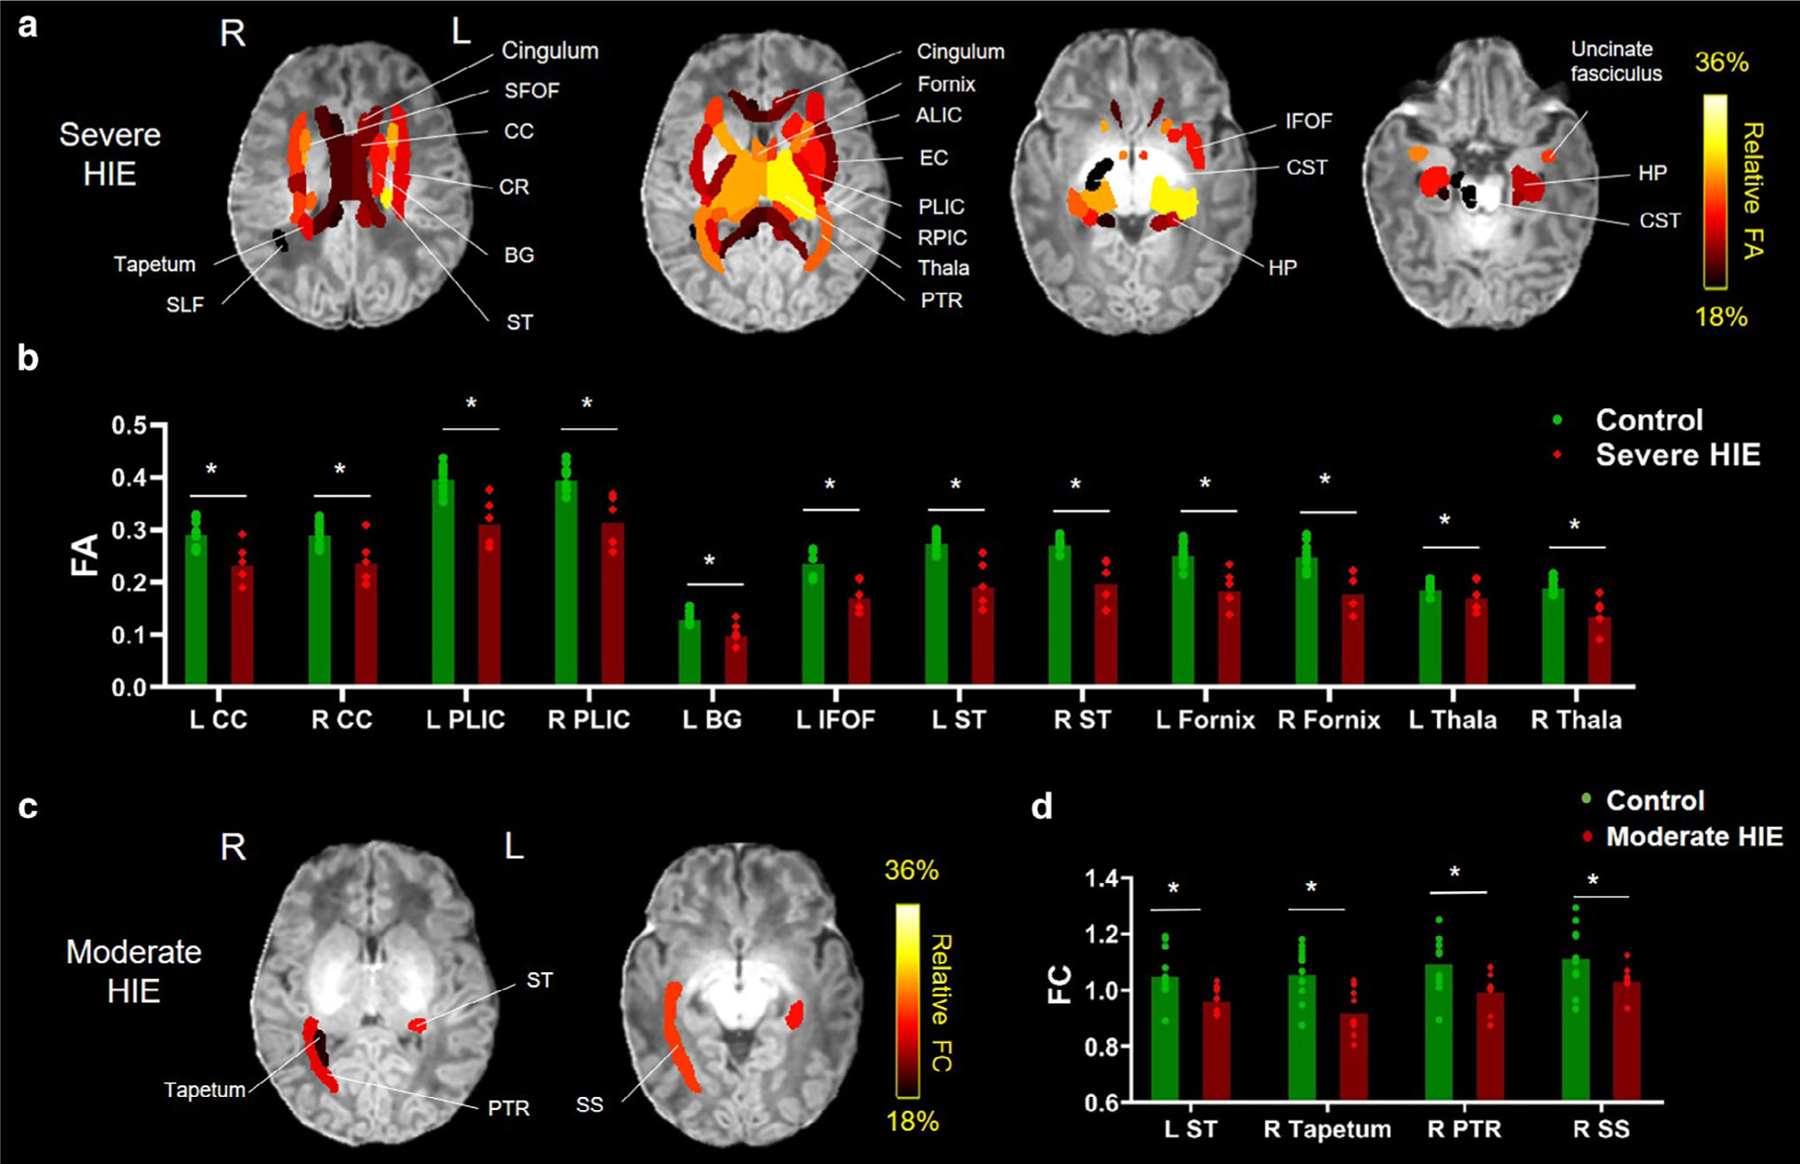
The WM and deep GM ROIs showing statistically different dMRI metrics in HIE neonates. (a) Percentage differences in the ROIs with statistically lower FA in the severe HIE group compared to the controls, overlaid on the T1-weighted image. (b) FA values in representative ROIs of the severe HIE and control groups. (c) Percentage differences in the ROIs with statistically lower FC in the moderate HIE group compared to the controls, overlaid on the T1-weighted image. (d) FC values in selected ROIs that were statistically different between moderate HIE and control groups. Adjusted *P < 0.05. CC = corpus callosum; CR = coronal radiate; BG = basal ganglia; EC = external capsule; HP = hippocampus; ALIC = anterior limb of internal capsule; PLIC = posterior limb of internal capsule; RPIC = retrolenticular part of internal capsule; ST = stria terminalis; PTR = posterior thalamic radiation; SFOF = superior fronto-occipital fasciculus; Thal = thalamus; SS = sagittal stratum; L = left; R = right.
TABLE 2.
Relative Differences of dMRI Metrics Between the Control and Severe/Moderate HIE Neonates Using ROI-Based Analysis
| HIE Group | ROI | FA (% difference) |
MD (% difference) |
FD (% difference) |
FC (% difference) |
FDC (% difference) |
|---|---|---|---|---|---|---|
| Severe HIE | Left CC | 19.91* | −2.96 | 15.15 | 6.37 | 22.02 |
| Right CC | 18.19* | −2.34 | 11.67 | 8.18 | 21.14 | |
| Left ALIC | 20.48* | 0.70 | 17.47 | 8.55 | 24.13 | |
| Right ALIC | 22.28* | 2.05 | 17.23 | 1.15 | 19.29 | |
| Left PLIC | 21.11* | −1.66 | 4.28 | 4.55 | 17.70 | |
| Right PLIC | 18.83* | −1.70 | 6.46 | 3.34 | 17.08 | |
| Left RPIC | 22.72* | −0.43 | −7.76 | −1.78 | 14.74 | |
| Right RPIC | 21.58* | −1.34 | −0.84 | −4.77 | 9.16 | |
| Left CR | 20.48* | 0.70 | 17.47 | 8.55 | 24.13 | |
| Right CR | 22.28* | 2.05 | 17.23 | 1.15 | 19.29 | |
| Left cingulum | 21.11* | −1.66 | 4.28 | 4.55 | 17.70 | |
| Right cingulum | 18.83* | −1.70 | 6.46 | 3.34 | 17.08 | |
| Left BG | 22.72* | −0.43 | −7.76 | −1.79 | 14.74 | |
| Left fornix | 26.46* | −3.76 | 17.59 | 4.78 | 22.05 | |
| Right fornix | 27.93* | −4.06 | 19.05 | 5.53 | 28.71 | |
| Left ST | 29.49* | −6.06 | 22.76 | 9.94 | 29.11 | |
| Right ST | 26.64* | −4.88 | 14.44 | 7.20 | 21.22 | |
| Left EC | 21.56* | 3.29 | 9.41 | 11.13 | 21.90 | |
| Right EC | 23.10* | 3.58 | 9.44 | 6.08 | 16.72 | |
| Left PTR | 25.17* | −0.21 | 23.87 | 13.45 | 33.40 | |
| Right PTR | 26.96* | 1.20 | 26.98 | 10.59 | 32.15 | |
| Left thalamus | 29.56* | −5.85 | 12.26 | 9.26 | 23.90 | |
| Right thalamus | 27.76* | −5.31 | 11.96 | 7.63 | 20.61 | |
| Left SFOF | 26.19* | −6.40 | 31.76 | −9.60 | 24.36 | |
| Right SFOF | 25.11* | −4.67 | 34.38 | −11.82 | 24.86 | |
| Left IFOF | 26.92* | −0.30 | 16.34 | 8.89 | 25.36 | |
| Left UNC | 23.45* | 2.84 | 8.24 | 8.93 | 17.70 | |
| Right UNC | 25.95* | −2.50 | 9.06 | 6.68 | 31.96 | |
| Left HP | 20.49* | −7.80 | 10.51 | 0.97 | 27.90 | |
| Right HP | 24.01* | −8.35 | 16.97 | −3.82 | 27.93 | |
| Right CST | 16.55* | −2.81 | 0.95 | 12.19 | 17.60 | |
| Right tapetum | 20.97* | −0.49 | 20.41 | 9.56 | 29.11 | |
| Right SLF | 13.51* | 6.85 | −0.72 | 2.27 | 0.35 | |
| Moderate HIE | Left ST | 3.47 | 0.90 | 2.93 | 8.23* | 11.34 |
| Right tapetum | −1.70 | 3.65 | −2.34 | 13.03* | 9.47 | |
| Right PTR | 7.95 | 2.61 | 6.94 | 9.14* | 15.24 | |
| Right SS | 8.94 | 0.29 | 11.59 | 7.35* | 18.36 |
The relative difference was calculated as (controls − patients)/controls × 100%. Only the ROIs showing significant differences are listed.
FA = fractional anisotropy; MD = mean diffusivity; FD = fiber density; FC = fiber cross section; FDC = fiber density and cross section; CC = corpus callosum; ALIC = anterior limb of internal capsule; PLIC = posterior limb of internal capsule; RPIC = retrolenticular part of internal capsule; CR-corona radiate; BG = basal ganglia; ST = stria terminalis; EC = external capsule; PTR = posterior thalamic radiation; SFOF = superior fronto-occipital fasciculus; UNC-uncinate fasciculus; HP = hippocampus; SS-sagittal stratum.
Adjusted P < 0.05.
In the moderate HIE group, only a few ROIs demonstrated statistical differences in FC, including the left stria terminalis (ST), right tapetum, right posterior thalamic radiation (PTR), and right sagittal stratum (SS), which are located close to the posterior watershed zone (Fig. 3c and Table 2).
In the mild HIE group, no ROIs showed microstructural difference (adjusted P ≥ 0.1398).
In addition, all regions with significant group difference showed high-power value (>0.9) in power analysis.
Tract-Based Analysis
Table 3 shows the percentage changes of the tract-averaged dMRI metrics between the moderate and mild HIE groups compared to controls. The moderate HIE patients showed significantly decreased FA, FD, and FDC in the right IFOF and right ILF and decreased FD and FDC in the SCC. The mild HIE newborns exhibited significantly reduced FD in the right IFOF similar to the moderate group and also reduced FD and FDC in the left ATR.
TABLE 3.
Relative Difference of the Whole-Tract Averaged dMRI Metrics Between the Moderate and Mild HIE Neonates Compared to Controls
| HIE Group | Tract | FA (% difference) |
MD (% difference) |
FD (% difference) |
FC (% difference) |
FDC (% difference) |
|---|---|---|---|---|---|---|
| Mild HIE | Left IFOF | 6.63 | −0.45 | 6.83 | 7.55 | 11.30 |
| Right IFOF | 11.84 | −0.07 | 15.73* | 5.74 | 19.21 | |
| Left ILF | 3.46 | 1.12 | 4.72 | 6.02 | 8.64 | |
| Right ILF | 10.05 | −0.44 | 15.49 | 4.56 | 16.39 | |
| Left ATR | 13.74 | −2.00 | 27.22* | 8.18 | 34.98** | |
| Right ATR | 5.78 | −1.51 | 10.25 | 5.46 | 11.32 | |
| Left CST | 1.05 | −1.11 | 0.47 | 7.37 | 8.42 | |
| Right CST | 1.22 | 0.13 | −3.52 | 7.71 | 4.92 | |
| GCC | −3.15 | 2.66 | 1.61 | −0.64 | 2.34 | |
| SCC | −1.08 | 3.05 | 2.32 | 3.87 | 5.17 | |
| Moderate HIE | Left IFOF | 7.64 | 0.23 | 8.32 | 8.49 | 15.58* |
| Right IFOF | 10.95* | 0.01 | 13.71* | 7.91 | 20.11* | |
| Left ILF | 8.84 | −1.25 | 10.13 | 6.85 | 16.75* | |
| Right ILF | 12.95* | −0.23 | 17.01* | 6.23 | 21.34* | |
| Left ATR | −0.85 | −0.55 | 7.40 | 2.63 | 14.26 | |
| Right ATR | −5.11 | 1.34 | 2.87 | −0.03 | 5.97 | |
| Left CST | −3.21 | −0.11 | 0.39 | 7.45 | 7.45 | |
| Right CST | 7.87 | 1.76 | 2.82 | 4.67 | 11.97 | |
| GCC | −3.33 | 3.37 | −2.29 | 2.35 | 2.13 | |
| SCC | 0.54 | 1.96 | 3.63* | 7.52 | 9.94* |
The relative difference was calculated as (controls − patients)/controls * 100%. Only the tracts showing significant differences are listed.
Adjusted P < 0.05
P < 0.01.
FA = fractional anisotropy; MD = mean diffusivity; FD = fiber density; FC = fiber cross section; FDC = fiber density and cross section; IFOF = inferior fronto-occipital fasciculus; ILF = inferior longitudinal fasciculus; ATR = anterior thalamic radiation; CST = corticospinal tract; GCC = genu of corpus callosum; SCC = plenium of corpus callosum.
Along-tract statistics revealed significantly altered microstructure in several segments along the right IFOF, right ILF, and SCC in the moderate HIE group compared to the controls. Figure 4 demonstrates that FA, FD, FC, and FDC in the mid-to-posterior part of the right IFOF, close to the occipital cortex, were significantly affected. FA, FD, and FC in the mid-to-posterior part and FDC in the middle part of the right ILF also showed significant differences (Fig. 5). A small segment in the central-to-right part of SCC showed significantly reduced FD and FDC, as depicted in Supplementary Fig. S5. In the mild HIE neonates, few segments in the ATR showed statistical difference in FD (middle segments in left ATR) and FDC (middle segments in left ATR) after FDR correction, and the other tracts all did not shown significant difference (adjusted P ≥ 0.0582). The significant reduced FD and FDC in ATR agreed with the tract-averaged result in left ATR. These segments with statistically significance also showed high-power value (>0.9) in power analysis (Supplementary Fig. S6).
FIGURE 4:
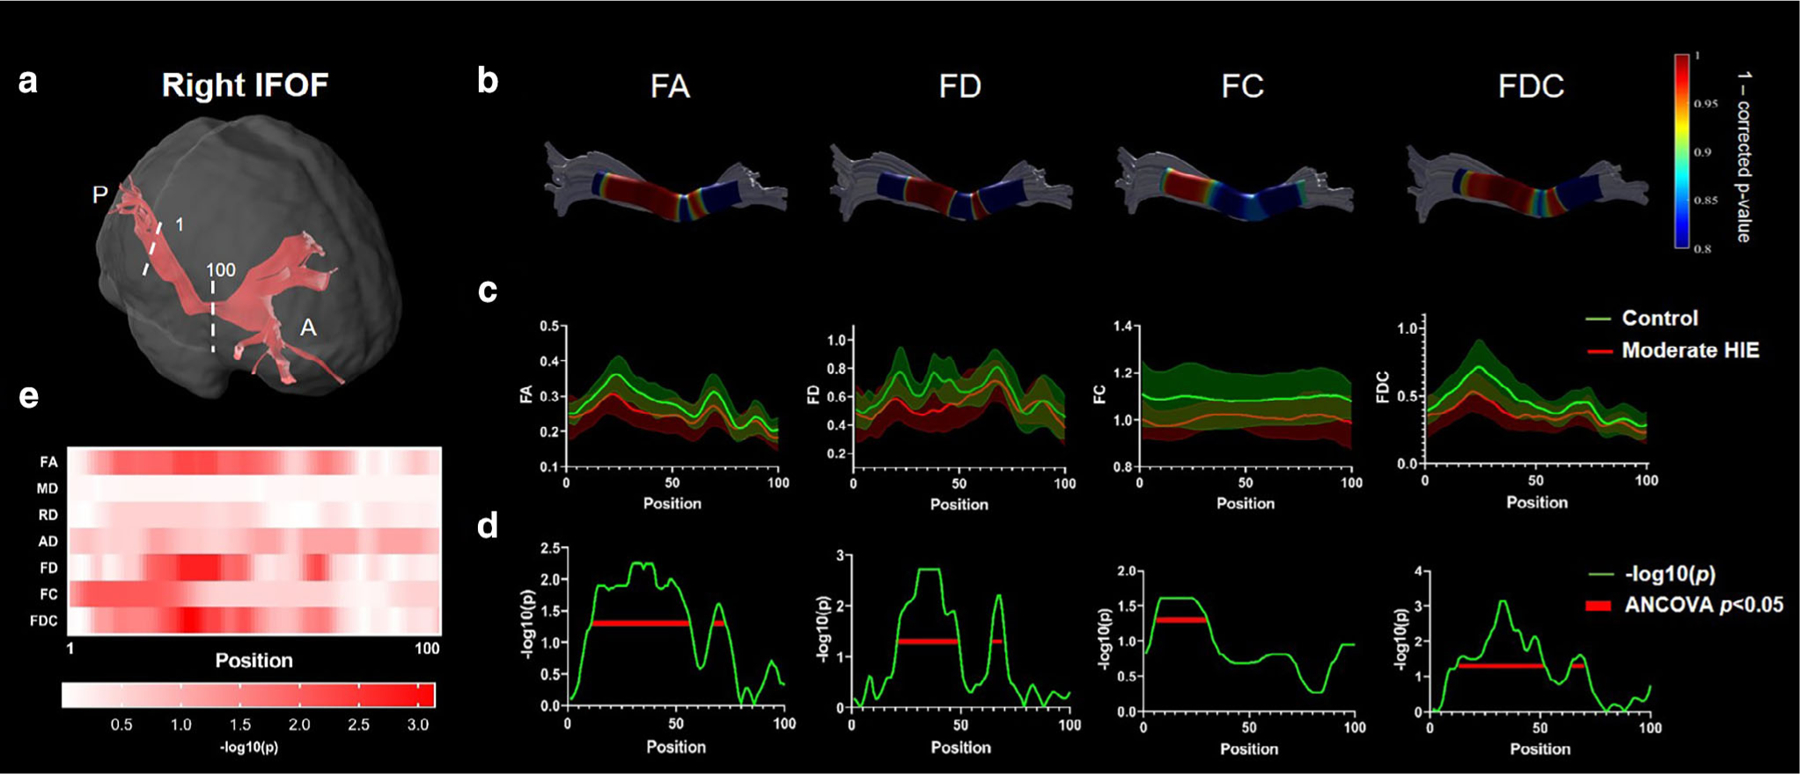
Along-tract statistics for the right IFOF in moderate HIE group. (a) The trunk region of IFOF was evenly segmented into 100 segments from posterior to anterior brain. (b) The statistics of each segment illustrated as 1-P (corrected) were mapped onto the tract for FA, FD, FC, and FDC metrics. (c) The along-tract FA, FD, FC, and FDC values were plotted as group mean ± standard deviation in the moderate HIE and control groups. (d,e) The −log(P) values from the group comparison at each segment along the tract for the different dMRI metrics. The segments showing statistically significant group differences were underlined by red lines in (d).
FIGURE 5:
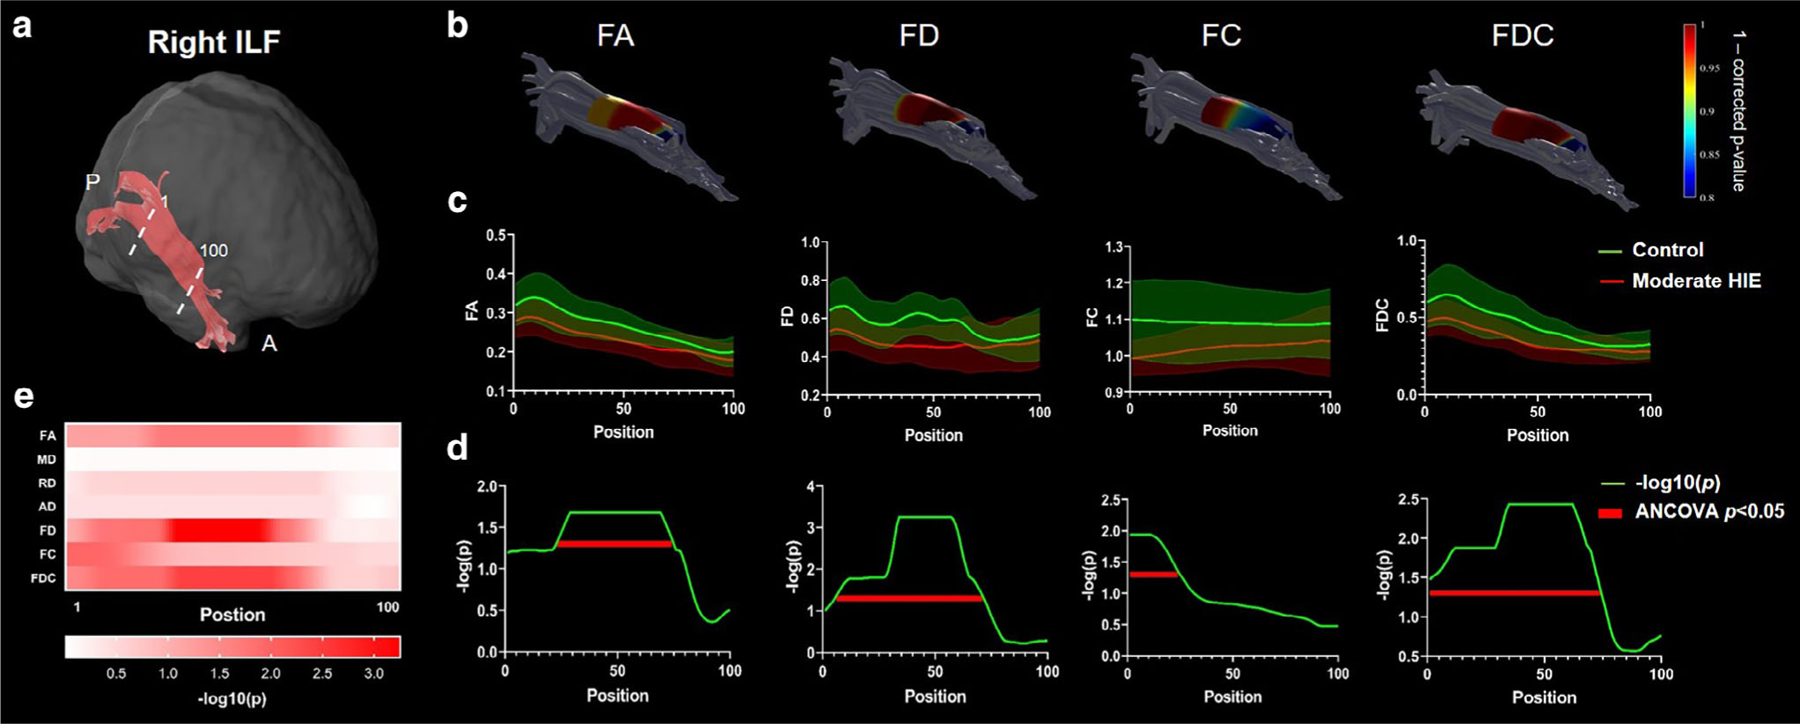
Along-tract statistics for the right ILF in moderate HIE group. (a) The trunk region of ILF was evenly segmented into 100 segments from posterior to anterior brain. (b) The statistics of each segment illustrated as 1-P (corrected) were mapped onto the tract for FA, FD, FC, and FDC metrics. (c) The along-tract FA, FD, FC, and FDC values were plotted as group mean ± standard deviation in the moderate HIE and control groups. (d,e) The −log(p) values from the group comparison at each segment along the tract for the different dMRI metrics. The segments showing statistically significant group differences were underlined by red lines in (d).
In addition, we found a high positive correlation (r = 0.59) between FA of the right posterior IFOF and the Alberta Infant Motor Scale (AIMS)27 assessments around 3–4 months in eight subjects whose AIMS were available (Supplementary Fig. S7).
Fixel-Based Analysis
For moderate HIE, Fig. 6 shows that in the right middle-posterior segments of the IFOF and ILF, a number of fixels showed statistically different FA, FC, FD, and FDC. A segment of the SCC towards the central-to-right part demonstrated significantly altered fixels with reduced FD and FDC (Fig. 6). For mild HIE, only a limited number of altered fixels with reduced FA, FD and FDC was found in the middle of right IFOF. Note that we did perform FBA for severe and mild HIE groups because 1) for the severe HIE group, the small sample size (n = 5) made it difficult to obtain statistical significance in FBA and 2) for the mild injury, very limited tracts showed abnormality based on TBA, and thus we could not apply a mask for FBA as done for moderate HIE.
FIGURE 6:
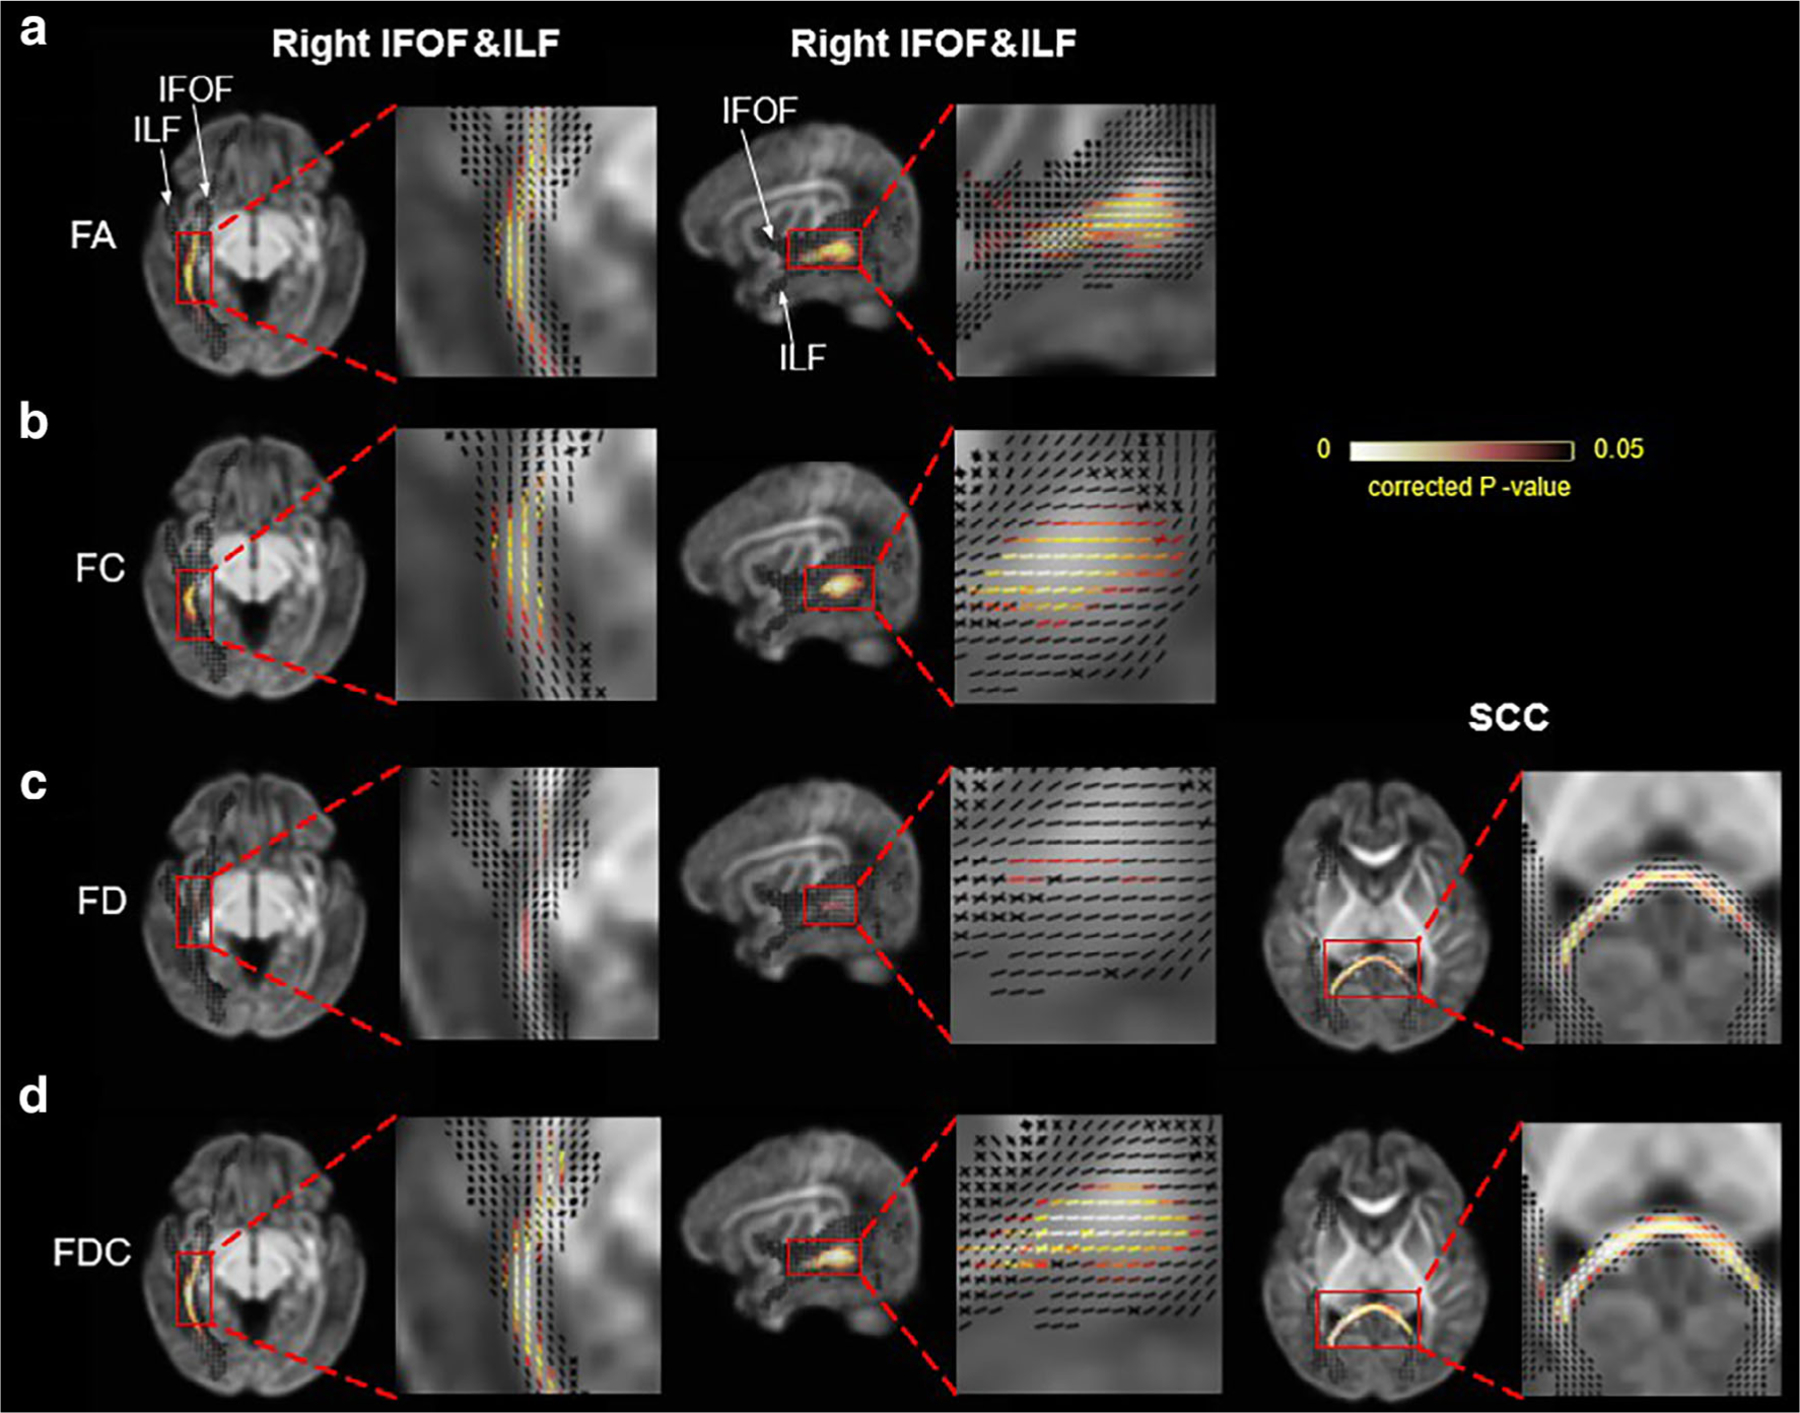
Fixels showing statistical differences between moderate HIE and controls in FA (a), FC (b), FD (c), and FDC (d) measurements. The fixels located in the right IFOF and right ILF (the two tracts were anatomically connected in the posterior sections) were shown in axial and sagittal views (first and second columns), and those in the SCC were shown in the third column. Corrected P values were mapped onto the fixels. fIFOF = inferior fronto-occipital fasciculus; ILF = inferior longitudinal fasciculus; SCC = splenium of corpus callosum.
Relation Between Tensor- and Fixel-Based Metrics
We further examined the correlation between tensor- and fixel-based metrics in several WM and deep GM regions (Supplementary Fig. S8) and found that FD had a high correlation with FA in control, mild, and moderate groups but lower correlations in the severe group. FC showed high correlations with FA in the control group but lower correlations in all patient groups.
Discussion
In this study, we performed systematic analysis of brain microstructural alterations in severe, moderate, and mild HIE with ROI-based, tract-based, and fixel-based analyses using advanced dMRI. Our major findings include 1) while newborns with severe HIE showed extensive injury, the moderate and mild HIE newborns exhibited selected regions of WM injury that can be detected by high-order dMRI metrics; 2) the right IFOF, right ILF, and SCC were found to be selectively altered in moderate HIE by both TBA and FBA; and 3) the tensor- and fixel-based metrics demonstrated differential sensitivities to different injury sites and degrees.
Severe, Moderate, and Mild HIE
The HIE injury patterns may vary depending on the severity because of the regional vulnerability.28 Metabolically active structures are vulnerable to profound or acute HIE injury while subcortical WM and watershed region are vulnerable to partial or chronic HIE injury.28 Consequently, severe HIE patients typically show characteristic injury in the BGT while milder HIE patients may exhibit injury in the watershed area or periventricular WM.5
Given the distinct mechanisms and radiological features, we performed a group-specific analysis. In severe injury, we found reduced FA in the majority of the WM and deep GM regions, while MD was unchanged. This finding is in agreement with the study reporting normal ADC in severe and moderate HIE newborns within the first 10–14 days of life.12 The normal-appearing MD may be related to the pseudonormalization effect, indicating that the ADC drops in the first 1–4 days after birth and then increases to normal levels around the seventh day,29 while the PMA at the scan session of our patients was around day 7. When decomposing the MD to RD and AD, we found slightly reduced AD and increased RD, which may explain the reduced FA and unchanged MD. A previous study indicated that the RD was pseudo-normalized earlier than AD, which may lead to increased RD and reduced AD around the seventh day.30
The neuropathological pattern specific to moderate HIE, especially in WM structures, has not been well established. This study particularly focused on moderate HIE as affected newborns exhibit long-term sequelae with 30% having cerebral palsy and 20%–50% having cognitive disabilities.31 The mild HIE neonates showed very limited injury only in the right IFOF and left ATR based on TBA.32 The reduced FA and FDC in the right IFOF were consistent with moderate HIE. However, WM injury in the mild–moderate HIE newborns during the acute stage has been rarely reported, possibly because the structural alternations in WM may take longer to develop and are not easily detectable shortly after birth. Using the higher-order microstructural markers of FD, FC, and FDC, we were able to identify additional abnormalities compared with the tensor-based markers.
Microstructural Injury Associated With IFOF, ILF, and SCC in Moderate HIE
Our results demonstrated significantly reduced fiber integrity in the middle-to-posterior IFOF, ILF, and SCC, especially in the right hemisphere. WM injury in these structures has been reported in previous studies, for example, Youngseob et al showed abnormalities in DTI metrics in the right ILF, bilateral IFOF, SCC, and GCC in moderate–severe HIE newborns.33 Furthermore, Li et al found significantly reduced tract numbers in IFOF in severe HIE patients.12
The IFOF is a long-range association fiber that connects occipital, temporal, and superior parietal areas and the frontal lobe,34 involving many cognitive functions such as reading, attention, and visual processing.35 According to our results, FA, FD, FC, and FDC were significantly reduced in the right IFOF in mild and moderate HIE. Particularly, we found the middle-to-posterior parts of the right IFOF located in the lower temporal and occipital lobe showed widespread microstructural alternations. This finding may be associated with the impaired temporal-occipital lobe functions such as the processing of visual recognition34 in HIE. Impairment of these functions are known to be more prominent in the right hemisphere,34 possibly explaining the laterality observed in our findings. In addition, the relatively high correlation between FA of the right posterior IFOF and AIMS, although not significant given the small sample size, indicated injury in the IFOF may alter motor function in HIE neonates.
The ILF is another long-range associative pathway that connects the occipital and temporal-occipital areas of the brain to the anterior temporal areas.36 It is mainly involved in visual function, including face recognition, reading, and visual memory.36 The impairment of ILF possibly corresponds to the compromised visual functions in HIE newborns.37 In addition, the function of ILF in face recognition-related visual function34 is known to be lateralized to the right hemisphere,36 which might be supported by the reduced fiber integrity found in the right ILF.
The SCC projects to the occipital-parietal and temporal cortex and is associated with cerebral functions including language and speaking.38 Reduced integrity in the SCC has been reported in a number of HIE studies.33 Since the myelination of the CC begins postnatally with a faster rate in the SCC compared to the other parts,39 HIE that insulted the SCC at birth may alter its myelination process and interfere with the associated functions. Significant microstructural changes along SCC were found toward the right side, consistent with the laterality in IFOF and ILF. Therefore, the findings in IFOF, ILF, and SCC all point to connections with the temporal and occipital lobes near the watershed zones and may closely relate to visual functions in moderate HIE.
Tensor- and Fixel-Based dMRI Markers
Although FA and MD have been widely used in previous HIE studies, which are thought to be surrogate markers of WM integrity, they do not correspond to specific microstructural properties. With high-order dMRI, not only the crossing fibers are resolved but also the microstructural details of individual fiber components could also be depicted. Here, we employed FOD-based reconstruction to obtain FD and FC that characterize the density and cross section of a fiber bundle.19 We found that while in severe HIE, WM injury can be captured by FA, in moderate injury only FC detected WM injury in a ROI-based analysis. In the TBA results, FA, FD, FC, and FDC were all abnormal but they exhibited different along-tract profiles. The FA profile was closer to FD, while FC highlighted different sections of the tract, which was also supported by the correlation analysis, indicating the reduction in FA may be attributed to the loss of fiber density. Overall, the results suggested the different microstructural metrics provide important complementary information to capture the WM injury and high-order dMRI may provide sensitive markers for detecting mild–moderate HIE. Note since the FBA-based metrics were calculated in the fixel space (four-dimensional data), to use them in the ROI- and tract-based analysis, we need to convert them to voxel-wise metrics by taking the average or sum or maximum value within a voxel, leading to loss of microstructural information during this procedure.
Limitations
First, the number of neonatal patients is limited in the current study, particularly after separation into four groups. Therefore, the current findings need to be validated in a larger population. Second, the control neonates were about 6 days older than the HIE neonates at the scan session, although PMA was included as a covariate. We assumed that a few days in postnatal development are unlikely to lead to changes in brain dMRI measurements. Third, only two b-values and a limited number of diffusion directions were acquired in this study, given the limited scan time and special safety concerns for the HIE neonates. Therefore, some of the high-order dMRI models17,40 could not be fitted, which would require more q-space samples and longer acquisition times. Finally, the present study only included cross-sectional data, and thereby, we could not observe longitudinal changes from the current cohort of subjects.
Conclusion
ROI-based analysis revealed extensively reduced FA across the brain in severe HIE and reduced FC in selected WM structures close to the posterior watershed zones in moderate HIE. Tract- and fixel-based analysis pointed to an injury pattern associated with the right IFOF in mild HIE, and the right IFOF and SCC in moderate HIE, indicating injury associated with the temporal and occipital lobes in affected neonates.
Supplementary Material
Acknowledgments
This work is supported by the Ministry of Science and Technology of the People’s Republic of China (2018YFE0114600), the National Natural Science Foundation of China (61801424, 81971606, and 82122032), the Leading Innovation and Entrepreneurship Team of Zhejiang Province (2020R01003 and 2022C03057), and the Young Scientist Program of United Imaging (UIH-QNJJ-2021001).
Footnotes
Additional supporting information may be found in the online version of this article
References
- 1.Finer N, Robertson C, Richards R, Pinnell L, Peters KJ. Hypoxic-ischemic encephalopathy in term neonates: Perinatal factors and outcome. J Pediatr 1981;98(1):112–117. [DOI] [PubMed] [Google Scholar]
- 2.Bano S, Chaudhary V, Garga UC. Neonatal hypoxic-ischemic encephalopathy: A radiological review. J Pediatr Neurosci 2017;12(1):1–6. [DOI] [PMC free article] [PubMed] [Google Scholar]
- 3.Badr LK, Purdy I. Brain injury in the infant: The old, the new, and the uncertain. J Perinat Neonatal Nurs 2006;20(2):163–175. [DOI] [PubMed] [Google Scholar]
- 4.Sarnat HB, Sarnat MS. Neonatal encephalopathy following fetal distress: A clinical and electroencephalographic study. Arch Neurol 1976;33(10):696–705. [DOI] [PubMed] [Google Scholar]
- 5.Walsh BH, Inder TE. MRI as a biomarker for mild neonatal encephalopathy. Early Hum Dev 2018;120:75–79. [DOI] [PubMed] [Google Scholar]
- 6.Barkovich AJ, Baranski K, Vigneron D, et al. Proton MR spectroscopy for the evaluation of brain injury in asphyxiated, term neonates. Am J Neuroradiol 1999;20(8):1399–1405. [PMC free article] [PubMed] [Google Scholar]
- 7.Chalela JA, Wolf RL, Maldjian JA, Kasner SEJN. MRI identification of early white matter injury in anoxic–ischemic encephalopathy. Neurology 2001;56(4):481–485. [DOI] [PubMed] [Google Scholar]
- 8.Liauw L, Palm-Meinders I, van der Grond J, et al. Differentiating normal myelination from hypoxic-ischemic encephalopathy on T1-weighted MR images: A new approach. Am J Neuroradiol 2007;28(4):660–665. [PMC free article] [PubMed] [Google Scholar]
- 9.Budde MD, Frank JA. Neurite beading is sufficient to decrease the apparent diffusion coefficient after ischemic stroke. Proc Natl Acad Sci U S A 2010;107(32):14472–14477. [DOI] [PMC free article] [PubMed] [Google Scholar]
- 10.Cowan F, Pennock J, Hanrahan J, Manji K, Edwards AJN. Early detection of cerebral infarction and hypoxic ischemic encephalopathy in neonates using diffusion-weighted magnetic resonance imaging. Neuropediatrics 1994;25:172–175. [DOI] [PubMed] [Google Scholar]
- 11.Cauley KA, Filippi CG. Apparent diffusion coefficient histogram analysis of neonatal hypoxic-ischemic encephalopathy. Pediatr Radiol 2014;44(6):738–746. [DOI] [PubMed] [Google Scholar]
- 12.Li HX, Feng X, Wang Q, Dong X, Yu M, Tu WJ. Diffusion tensor imaging assesses white matter injury in neonates with hypoxic-ischemic encephalopathy. Neural Regen Res 2017;12(4):603–609. [DOI] [PMC free article] [PubMed] [Google Scholar]
- 13.Ly MT, Nanavati TU, Frum CA, Pergami P. Comparing tract-based spatial statistics and manual region-of-interest labeling as diffusion analysis methods to detect white matter abnormalities in infants with hypoxic-ischemic encephalopathy. J Magn Reson Imaging 2015;42(6):1689–1697. [DOI] [PMC free article] [PubMed] [Google Scholar]
- 14.Lemmon ME, Wagner MW, Bosemani T, et al. Diffusion tensor imaging detects occult cerebellar injury in severe neonatal hypoxic-ischemic encephalopathy. Dev Neurosci 2017;39(1–4):207–214. [DOI] [PMC free article] [PubMed] [Google Scholar]
- 15.Zhang F, Liu C, Qian L, Hou H, Guo Z. Diffusion tensor imaging of white matter injury caused by prematurity-induced hypoxic-ischemic brain damage. Med Sci Monit 2016;22:2167–2174. [DOI] [PMC free article] [PubMed] [Google Scholar]
- 16.Anderson AW. Measurement of fiber orientation distributions using high angular resolution diffusion imaging. Magn Reson Med 2005;54(5):1194–1206. [DOI] [PubMed] [Google Scholar]
- 17.Zhang H, Schneider T, Wheeler-Kingshott CA, Alexander DC. NODDI: Practical in vivo neurite orientation dispersion and density imaging of the human brain. Neuroimage 2012;61(4):1000–1016. [DOI] [PubMed] [Google Scholar]
- 18.Raffelt DA, Smith RE, Ridgway GR, et al. Connectivity-based fixel enhancement: Whole-brain statistical analysis of diffusion MRI measures in the presence of crossing fibres. Neuroimage 2015;117:40–55. [DOI] [PMC free article] [PubMed] [Google Scholar]
- 19.Raffelt DA, Tournier JD, Smith RE, et al. Investigating white matter fibre density and morphology using fixel-based analysis. Neuroimage 2017;144:58–73. [DOI] [PMC free article] [PubMed] [Google Scholar]
- 20.Mito R, Raffelt D, Dhollander T, et al. Fibre-specific white matter reductions in Alzheimer’s disease and mild cognitive impairment. Brain 2018;141(3):888–902. [DOI] [PubMed] [Google Scholar]
- 21.Mulkey SB, Yap VL, Swearingen CJ, Riggins MS, Kaiser JR, Schaefer GB. Quantitative cranial magnetic resonance imaging in neonatal hypoxic-ischemic encephalopathy. Pediatr Neurol 2012;47(2): 101–108. [DOI] [PMC free article] [PubMed] [Google Scholar]
- 22.Smith SM, Jenkinson M, Johansen-Berg H, et al. Tract-based spatial statistics: Voxelwise analysis of multi-subject diffusion data. Neuroimage 2006;31(4):1487–1505. [DOI] [PubMed] [Google Scholar]
- 23.Yeatman JD, Dougherty RF, Myall NJ, Wandell BA, Feldman HM. Tract profiles of white matter properties: Automating fiber-tract quantification. PLoS One 2012;7(11):e49790. [DOI] [PMC free article] [PubMed] [Google Scholar]
- 24.Tournier JD, Smith R, Raffelt D, et al. MRtrix3: A fast, flexible and open software framework for medical image processing and visualisation. Neuroimage 2019;202:116137. [DOI] [PubMed] [Google Scholar]
- 25.Oishi K, Mori S, Donohue PK, et al. Multi-contrast human neonatal brain atlas: Application to normal neonate development analysis. Neuroimage 2011;56(1):8–20. [DOI] [PMC free article] [PubMed] [Google Scholar]
- 26.Wakana S, Caprihan A, Panzenboeck MM, et al. Reproducibility of quantitative tractography methods applied to cerebral white matter. Neuroimage 2007;36(3):630–644. [DOI] [PMC free article] [PubMed] [Google Scholar]
- 27.Piper MC, Pinnell LE, Darrah J, Maguire T, Byrne PJ. Construction and validation of the Alberta Infant Motor Scale (AIMS). Can J Public Health 1992;83:S46–S50. [PubMed] [Google Scholar]
- 28.Miller SP, Ramaswamy V, Michelson D, et al. Patterns of brain injury in term neonatal encephalopathy. J Pediatr 2005;146(4):453–460. [DOI] [PubMed] [Google Scholar]
- 29.McKinstry R, Miller J, Snyder A, et al. A prospective, longitudinal diffusion tensor imaging study of brain injury in newborns. Neurology 2002;59(6):824–833. [DOI] [PubMed] [Google Scholar]
- 30.Taoka T, Fujioka M, Sakamoto M, et al. Time course of axial and radial diffusion kurtosis of white matter infarctions: Period of pseudonormalization. AJNR Am J Neuroradiol 2014;35(8):1509–1514. [DOI] [PMC free article] [PubMed] [Google Scholar]
- 31.Carli G, Reiger I, Evans N. One-year neurodevelopmental outcome after moderate newborn hypoxic ischaemic encephalopathy. J Paediatr Child Health 2004;40(4):217–220. [DOI] [PubMed] [Google Scholar]
- 32.Zheng Q, Viaene AN, Freeman CW, Hwang M. Radiologic-pathologic evidence of brain injury: Hypoperfusion in the Papez circuit results in poor neurodevelopmental outcomes in neonatal hypoxic ischemic encephalopathy. Childs Nerv Syst 2021;37(1):63–68. [DOI] [PMC free article] [PubMed] [Google Scholar]
- 33.Seo Y, Kim G-T, Choi JW. Early detection of neonatal hypoxic–ischemic white matter injury: An MR diffusion tensor imaging study. Neuroreport 2017;28(13):845–855. [DOI] [PMC free article] [PubMed] [Google Scholar]
- 34.Chen HF, Huang LL, Li HY, et al. Microstructural disruption of the right inferior fronto-occipital and inferior longitudinal fasciculus contributes to WMH-related cognitive impairment. CNS Neurosci Ther 2020;26(5): 576–588. [DOI] [PMC free article] [PubMed] [Google Scholar]
- 35.Catani M, Thiebaut de Schotten M. A diffusion tensor imaging tractography atlas for virtual in vivo dissections. Cortex 2008;44(8): 1105–1132. [DOI] [PubMed] [Google Scholar]
- 36.Herbet G, Zemmoura I, Duffau H. Functional anatomy of the inferior longitudinal fasciculus: From historical reports to current hypotheses. Front Neuroanat 2018;12:77. [DOI] [PMC free article] [PubMed] [Google Scholar]
- 37.Mercuri E, Haataja L, Guzzetta A, et al. Visual function in term infants with hypoxic-ischaemic insults: Correlation with neurodevelopment at 2 years of age. Arch Dis Child Fetal Neonatal Ed 1999;80(2):F99–F104. [DOI] [PMC free article] [PubMed] [Google Scholar]
- 38.Swanson MR, Wolff JJ, Elison JT, et al. Splenium development and early spoken language in human infants. Dev Sci 2017;20(2):e12360. [DOI] [PMC free article] [PubMed] [Google Scholar]
- 39.Deoni SC, Mercure E, Blasi A, et al. Mapping infant brain myelination with magnetic resonance imaging. J Neurosci 2011;31(2):784–791. [DOI] [PMC free article] [PubMed] [Google Scholar]
- 40.Palombo M, Ianus A, Guerreri M, et al. SANDI: A compartment-based model for non-invasive apparent soma and neurite imaging by diffusion MRI. Neuroimage 2020;215:116835. [DOI] [PMC free article] [PubMed] [Google Scholar]
Associated Data
This section collects any data citations, data availability statements, or supplementary materials included in this article.