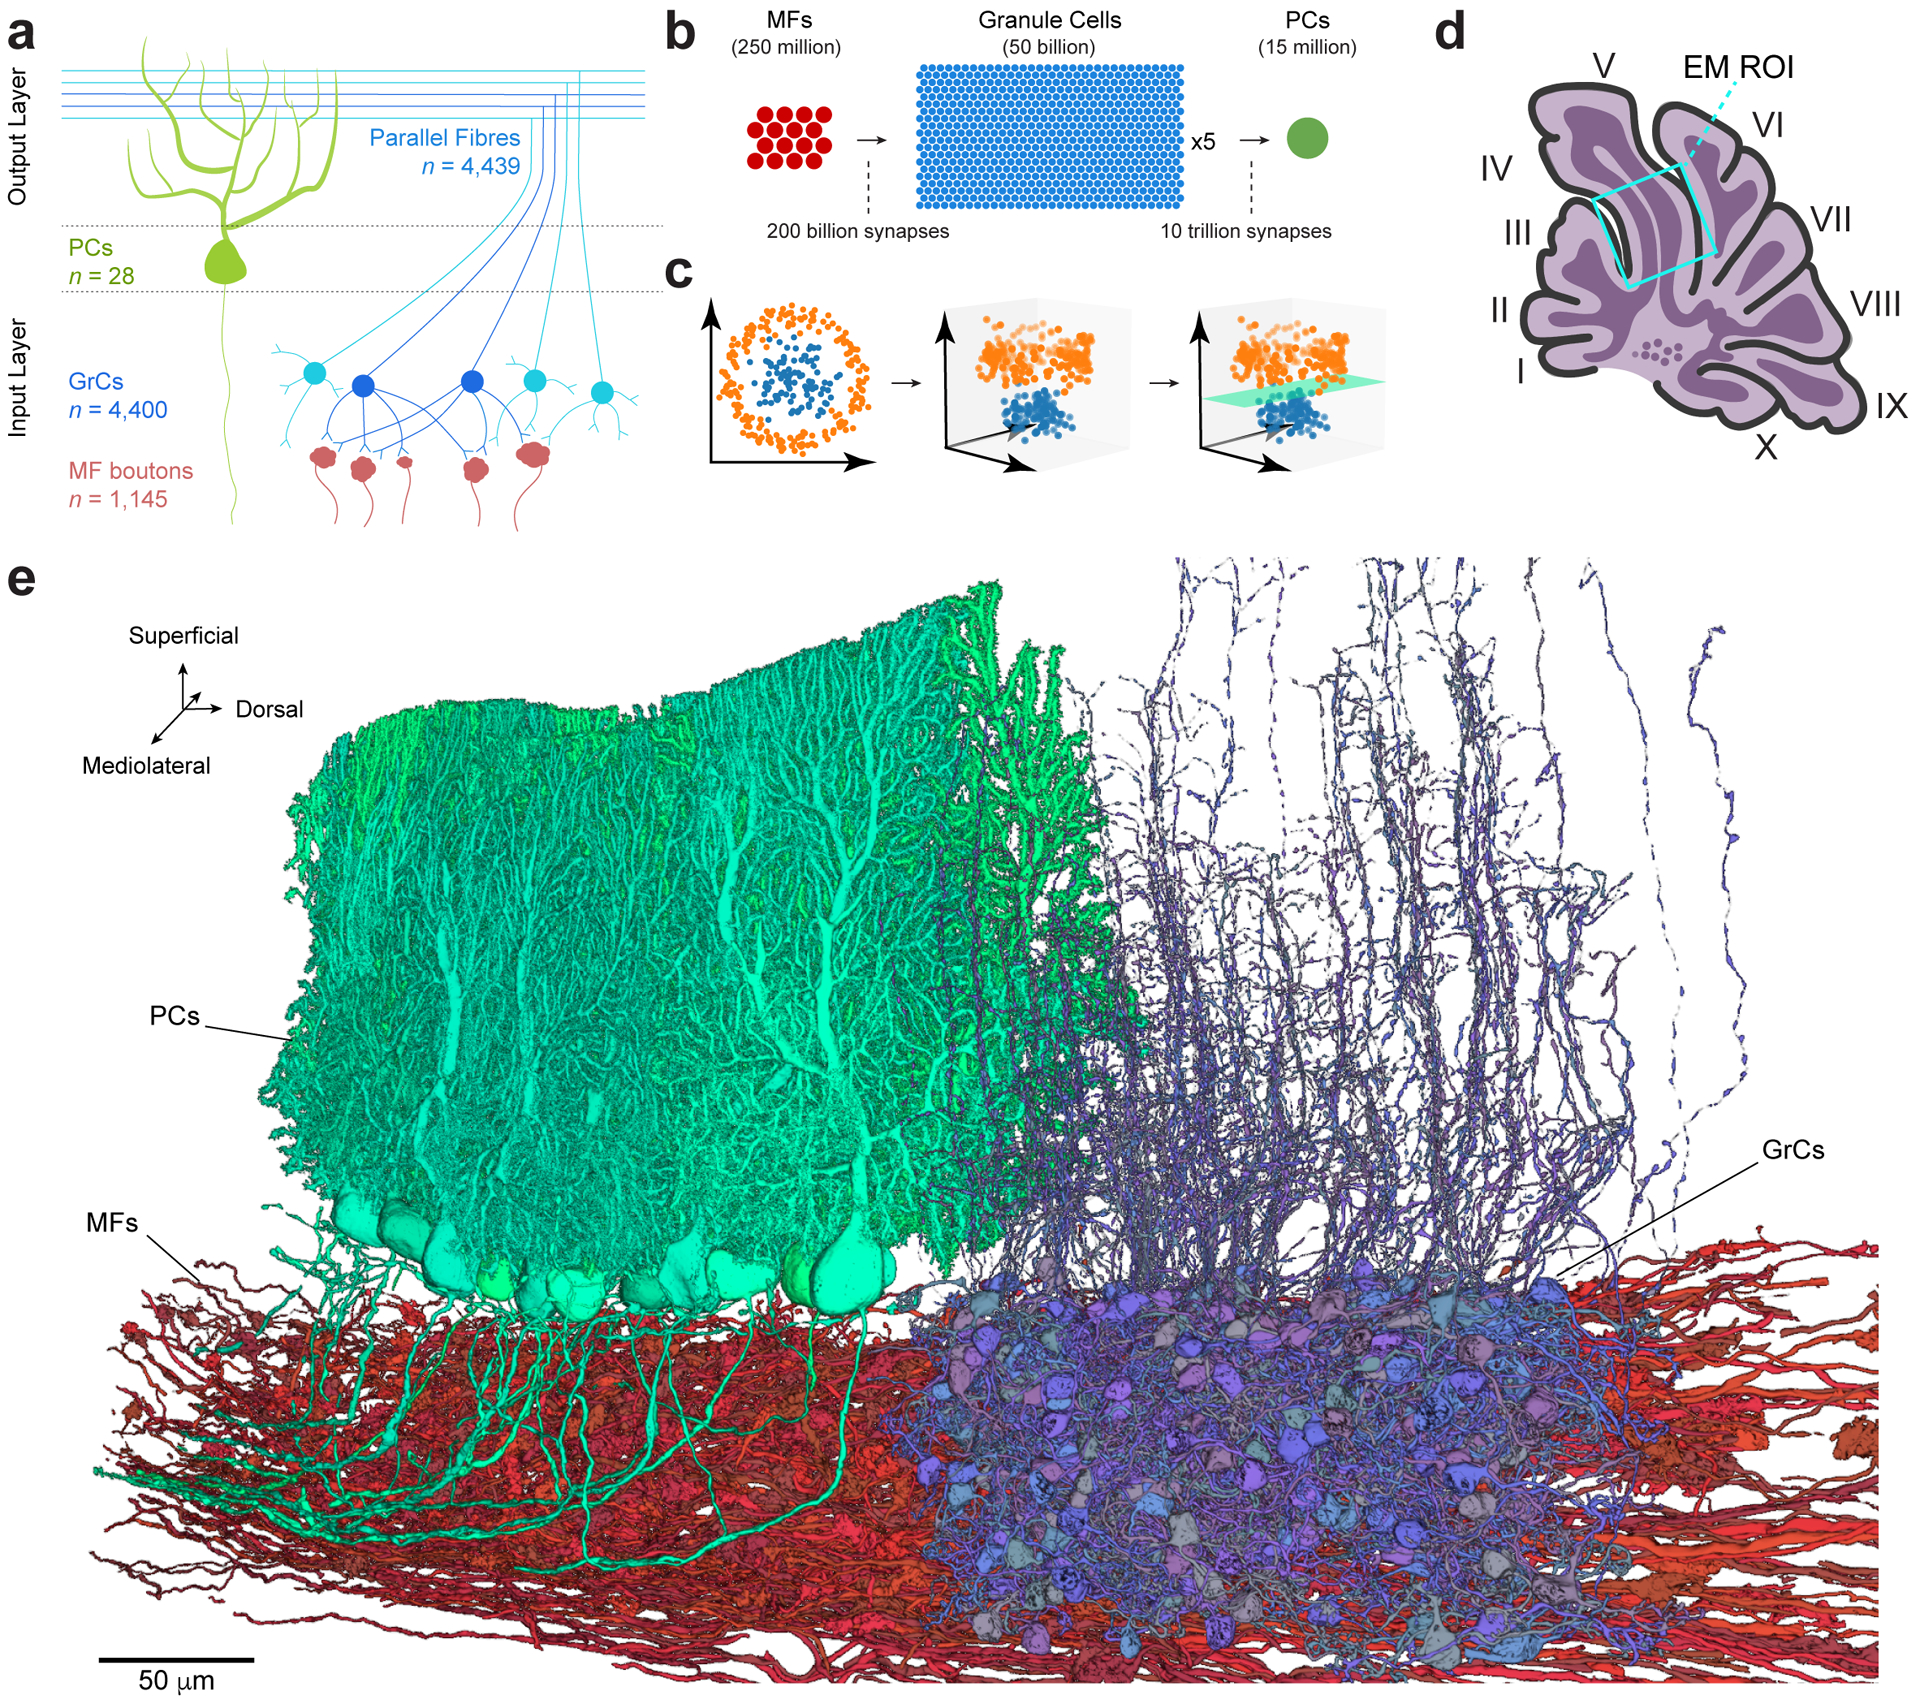
Figure 1. Reconstruction of feedforward circuitry in the cerebellar cortex using large-scale electron microscopy.

a, Schematic depicting wiring of feedforward neurons in the cerebellar cortex. Granule cells (GrCs, blue circles) sample mossy fiber (MF) boutons (red) and project their axons into the molecular layer where they bifurcate to form parallel fibers. GrC axons make synaptic contacts onto Purkinje cells (PCs, green), which are the sole output of the cerebellar cortex. The number (n) of reconstructed objects (MF boutons and parallel fibers) or cells with cell bodies (GrCs and PCs) in our dataset is shown. b, Expansion and convergence of the cerebellar cortex feedforward network. The number of circles is proportional to the number of neurons in the estimated global population20. At the local circuit scale, however, divergence of single MF boutons to GrCs is less (ratio ~1:3), and convergence of GrCs to PCs is higher (ratio 50,000–200,000:1). c, Illustrative data showing how two input representations in 2D (left) once projected into 3D (middle) can be linearly separated (right, green plane). Marr & Albus8,9 hypothesize that the MF→GrC dimensionality expansion supports pattern separation and the GrC→PC convergence performs pattern association. d, Schematic of a parasagittal section through the vermis of mouse cerebellum with the location of the EM dataset (Extended Data Fig. 2a) outlined (cyan box). e, 3D rendering of representative EM reconstructions of PCs (green), GrCs (blue) and MFs (red). Non-overlapping GrCs and PCs were rendered for clarity.
