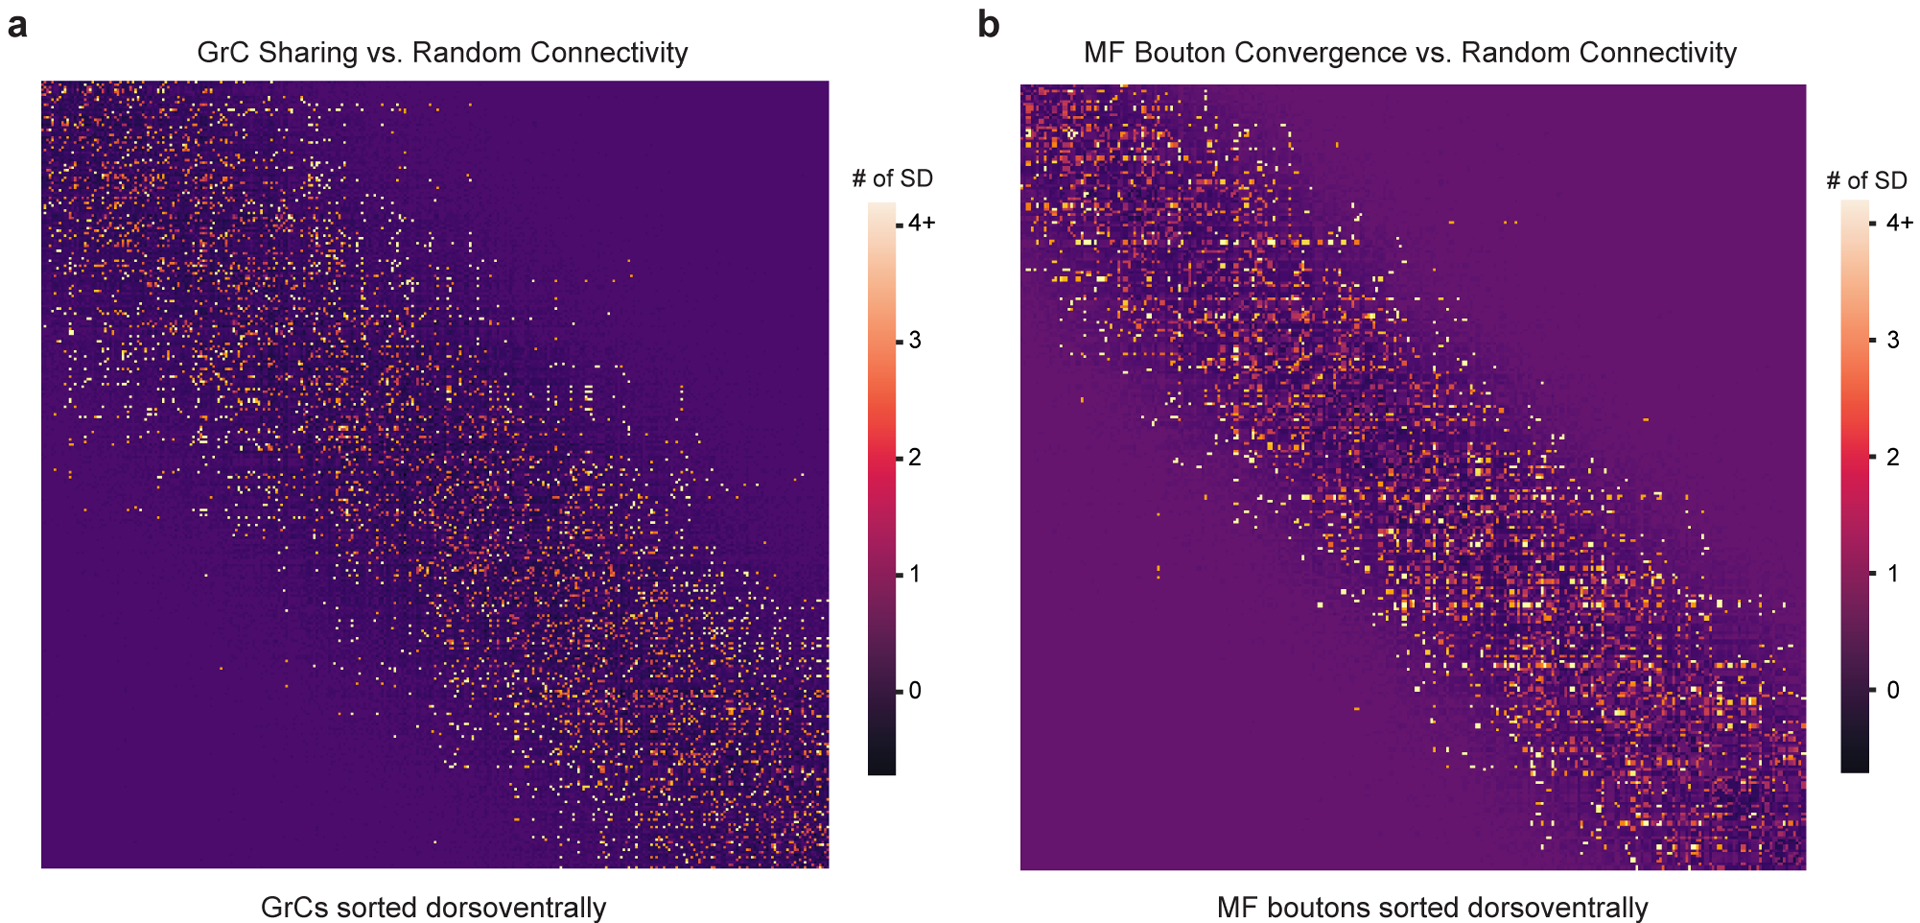
Extended Data Figure 6. MF→GrC oversharing and convergence vs null models.

a, GrC input sharing relative to random connectivity. The matrix shows the degree of input sharing between GrCs (centermost n = 550, sorted by soma position dorsoventrally). The color scale for each cell in the matrix uses the z-score (reconstructed # of sharing minus random mean divided by the SD). b, MF bouton output convergence relative to random connectivity. The matrix shows the degree of output convergence between MF boutons (centermost n = 234, sorted by soma position dorsoventrally). The color scale uses the z-score as in a.
