Abstract
The characteristics of single PR-positive (ER-PR+, sPR+) breast cancer (BC) and its prognosis are not well elucidated due to its rarity and conflicting evidence. There is a lack of an accurate and efficient model for predicting survival, thereby rendering treatment challenging for clinicians. Whether endocrine therapy should be intensified in sPR+ BC patients was another controversial clinical topic. We constructed and cross-validated XGBoost models that showed high precision and accuracy in predicting the survival of patients with sPR+ BC cases (1-year: AUC=0.904; 3-year: AUC=0.847; 5-year: AUC=0.824). The F1 score for the 1-, 3-, and 5-year models were 0.91, 0.88, and 0.85, respectively. The models exhibited superior performance in an external, independent dataset (1-year: AUC=0.889; 3-year: AUC=0.846; 5-year: AUC=0.821). Further, intensified endocrine therapy did not provide a significant overall survival benefit compared to initial or no endocrine therapy (P=0.600, HR: 1.46; 95% CI: 0.35-6.17). Propensity-score matching (PSM)-adjusted data showed that there was no statistically significant difference in the prognosis between ER-PR+HER2+ and ER-PR-HER2+ BC. Patients having the ER-PR+HER2- subtype had a slightly worse prognosis than those with the ER-PR-HER2- subtype. In conclusion, XGBoost models can be highly reproducible and effective in predicting survival in patients with sPR+ BC. Our findings revealed that patients with sPR-positive BC may not benefit from endocrine therapy. Patients with sPR+ BC may benefit from intensive adjuvant chemotherapy compared to endocrine therapy.
Keywords: Breast cancer, single PR-positive, XGBoost algorithm, SEER, neoadjuvant therapy
Introduction
Breast cancer (BC) is the second most common cancer diagnosed in women and is the primary reason for cancer-related deaths among females [1]. BC is classified into subtypes based on different molecular expression biomarkers, such as progesterone receptor (PR), estrogen receptor (ER), and human epidermal growth factor 2 (HER2). The biomarkers are proven to be important predictors of prognosis and indicators for the application of targeted and endocrine therapies.
PR is an upregulated target gene of the ER and its expression is highly dependent on ER expression [2]. Therefore, BC with a single PR (ER-PR+ or sPR-positive [sPR+]) subtype is rare and accounts for about 1.5%-3.4% of all BC cases [3-6]. The sPR+ subtype was initially considered a false-positive result of immunohistochemistry [4,7]. With increased understanding over the years in addition to PAM50 expression [8] and ESR1 mRNA level studies [9], sPR+ BC was identified as a different subtype. Until recently, the unique clinicopathological features and prognosis of patients with sPR+ BC were being studied, which yielded conflicting evidence [6,10-12]. There is a need for accurate and efficient tools to predict the survival in BC for aiding clinicians in designing treatment protocols. Machine learning has recently emerged as a hotspot for developing tools and methods to evaluate extensive, high-dimensional, and multi-modal biological data generated from clinical or preclinical research [13,14]. It can also help create an artificial intelligence (AI) prognostic model with high testing accuracy [14]. We used six types of machine learning algorithms to create prognostic models and found that XGBoost was the most accurate. Further, considering the significant debate around the treatment options for sPR+ BC, we assessed the prognostic benefits of surgery, chemotherapy, radiotherapy, and neoadjuvant therapy in patients with this subtype.
The Surveillance Epidemiology and End Results (SEER) database was exploited in this study to examine variables affecting the prognosis in sPR+ BC. High-precision AI models were developed to predict the 1, 3, and 5-year survival in patients with sPR+ BC. This study highlights the use of developing clinical AI models to optimize long-term follow-up and enhance insights into the treatment options for sPR+ BC.
Materials and methods
Data source and study design
The workflow of the study design and its analyses are presented in Figure 1. The data of females with BC analyzed in this study were obtained from the openly accessible SEER database (SEER 17 Regs study data, [changes 2010-2019] version 8.4.0). The key inclusion criteria for selecting data were patients with (1) only BC; (2) histopathological and morphological evidence per the International Classification of Cancer Diseases, Edition III (ICD-O-3); and (3) a molecular subtype of BC as ER-PR+. The key exclusion criteria were patients with (1) two or more primary cancers; (2) an unknown HER2 status; (3) T0 stage; and (4) M1 or unknown M stage (for complete eligibility criteria, please see Supplementary Material). The primary outcomes included overall survival (OS) determined by all causes of death and breast cancer-specific survival (BCSS) determined by deaths attributable to BC. The SEER database with cancer registry data and death certificates was used to determine the OS and BCCS. Follow-up was sustained until patients died, were lost to follow-up, or until December 31, 2019, whichever came first.
Figure 1.
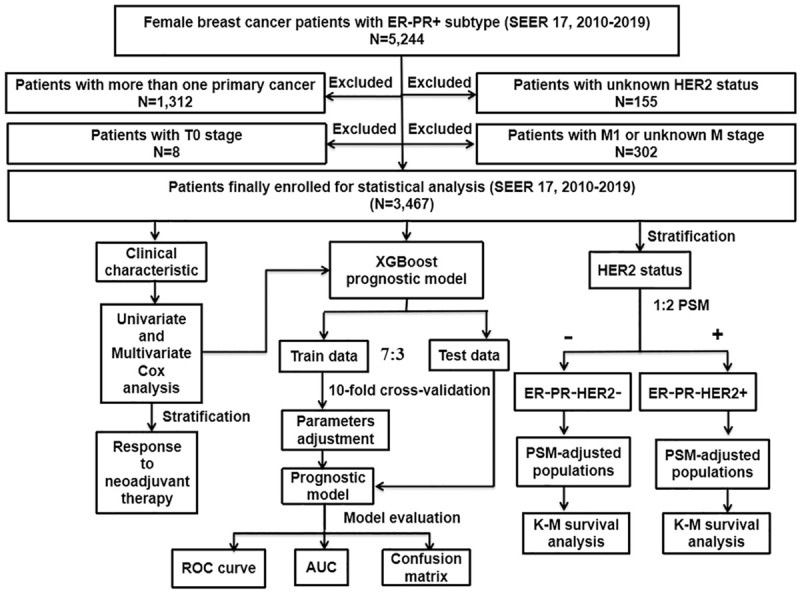
Flowchart describing the procedure and statistical analysis. SEER: the Surveillance, Epidemiology, and End Results; ER+/-: estrogen receptor positive/negative; PR+/-: progesterone receptor positive/negative; HER2+/-: human epidermal growth factor receptor 2 positive/negative; PSM: propensity score matching; Cox: concordance index; ROC curve: receiver operating characteristic curve; AUC: area under the curve; K-M: Kaplan-Meier; XGBoost: extreme gradient boosting.
XGBoost model
The XGBoost algorithm modifies the gradient-boosting approach and uses Newton’s method to solve for the extreme values of the loss function, conducts Taylor expansion of the loss function to the second order, and adds a regularization term to the loss function. The gradient-boosting algorithm loss and the regularization term make up the first and second parts of the objective function at training time, respectively. In addition, the XGBoost algorithm adopts the “feature subsampling” technique, which signifies selecting a subset of all features to train each tree (similar to a random forest) for amplifying the generalizing capability of the model, diversifying, and preventing overfitting. The XGBoost algorithm operates on the following principle: feature vector with the corresponding (output) category yi:
yiˆ=∑k=1Kfk(xi), fk∈F
Feature selection
Characteristics extracted from the SEER database, including the age at diagnosis, HER2 status, histological type, race, marital status, grade, T stage, N stage, median household income, surgery, radiotherapy, chemotherapy, and neoadjuvant therapy, were integrated into machine learning models to estimate 1-, 3-, and 5-year OS in patients with the sPR+ subtypes. The analyses were conducted before excluding patients who survived but lived for less than 1, 3, or 5 years of the follow-up cut-off date. A response variable was collected for the survival data before running the training program, with “0” denoting “death” and “1” denoting “survival”. Patients were randomized in a 7:3 ratio into train data and test data. We also compared the area under the curve (AUC) value of the artificial neural network (ANN), logistic regression (LR), random forest (RF), K-Nearest Neighbor (KNN), decision tree (ID3), and XGBoost on test data. To assess the accuracy and efficiency of our model, a confusion matrix, the area under the receiver operating characteristic (ROC) curve, and ROC analysis were employed. Correctness, recall, accuracy, and F1 score are the primary assessment parameters in the confusion matrix. The calculations were as follows: correctness = (TP+TN)/(TP+TN+FN+FP); recall = TP/(TP+FN); accuracy = TP/(TP+FP); F1 score = 2* accuracy* recall/(accuracy + recall).
TP: true positive; TN: true negative; FP: false positive; FN: false negative.
External validation
To further validate the XGBoost prognostic model, we collected data from 22 patients diagnosed with sPR+ BC between November 2017 and March 2022 in the Second Affiliated Hospital of Xi’an Jiaotong University. The key exclusion criteria for patient selection were as follows: (1) below 20 years of age; (2) having second primary cancer of any type; (3) males; and (4) lost to follow-up. The follow-up proceeded until the patient’s death or March 10, 2023, whichever came first. The Institutional Review Board of the Second Affiliated Hospital of the Xi’an Jiaotong University approved the retrospective cohort study. Patient informed consent was waived because the data used in this study did not have personally identifiable information.
Statistical analysis
Cox regression models were used to explore the correlation between clinicopathological features and survival. To assess the risk of patient mortality and identify independent prognostic markers, a multifactorial Cox analysis was conducted. Patients included in the analysis were categorized based on their response to neoadjuvant therapy, and the prognostic differences were compared. Multiple comparisons were corrected using the Benjamini & Hochberg method.
Propensity score matching
To better understand the prognosis in sPR+, included patients were categorized into the ER-PR+HER2- and ER-PR+HER2+ groups according to the HER2 status, and were matched to ER-PR-HER2- and ER-PR-HER2+ patients on a 1:2 propensity score, respectively. Matched variables were statistically significant in the univariate Cox. Matched parameters were: method = “nearest”, distance = “logit”, replace = FALSE, caliper = 0.01. Kaplan-Meier (K-M) survival analysis was performed on the propensity score matching (PSM)-adjusted population. The R programming language was utilized (version 4.0.2) for calculations. Statistical significance was defined as a bilateral tail value of less than 0.05.
Results
Clinical characteristics of sPR+ patients
Data from 3,467 eligible women with sPR+ BC were retrieved (2010 to 2019). The clinicopathological characteristics are shown in Table 1 and summarized below. The age of disease onset was between 40 and 69 years; 390 (11.25%) patients were younger than 40 years and 243 (7.01%) were older than 80 years. The proportion of white patients was 73.09% and 55.75% were married. Invasive ductal carcinoma (IDC) was the predominant histopathological type (87.63%). The number of cases with staging T1, T2, T3, and T4 were 40.50%, 42.86%, 8.02%, and 5.28% respectively. A majority of patients did not have regional lymph node metastases, with 63.57% in N0 stage. Patients with grade III or IV tumor were up to 74.50%, while only 2.22% of patients were grade I; 35.56% of patients had an annual household income of USD 70,000 and above. Further, 92.10% of patients underwent surgery, 73.58% received chemotherapy, 50.65% received radiotherapy, and 21.08% received neoadjuvant therapy; 1050 patients were HER2- (30.29%) and 2417 patients were HER2+ (69.71%). Compared to HER2-, patients with HER2+ included a higher proportion of other races, IDC and married status, and more advanced T and N stages. A higher number of patients with HER2+ received chemotherapy and neoadjuvant therapy and fewer patients received radiotherapy.
Table 1.
Baseline characteristics of sPR+ patients included from the SEER database
| Characteristic | All Patients | HER2+ | HER2- | P value | ||||
|---|---|---|---|---|---|---|---|---|
|
|
|
|
|
|||||
| N=3467 | % | N=1050 | 30.29% | N=2417 | 69.71% | (HER2+ vs HER2-) | ||
| Age at diagnosis | <40 | 390 | 11.25% | 115 | 10.95% | 275 | 11.38% | 0.076 |
| 40-49 | 727 | 20.97% | 212 | 20.19% | 515 | 21.31% | ||
| 50-59 | 926 | 26.71% | 313 | 29.81% | 613 | 25.36% | ||
| 60-69 | 776 | 22.38% | 227 | 21.62% | 549 | 22.71% | ||
| 70-79 | 405 | 11.68% | 123 | 11.71% | 282 | 11.67% | ||
| 80+ | 243 | 7.01% | 60 | 5.71% | 183 | 7.57% | ||
| Race | White | 2534 | 73.09% | 751 | 71.52% | 1783 | 73.77% | <0.001 |
| Black | 516 | 14.88% | 118 | 11.24% | 398 | 16.47% | ||
| Other | 318 | 9.17% | 169 | 16.10% | 212 | 8.77% | ||
| Unknown | 36 | 1.04% | 12 | 1.14% | 24 | 0.99% | ||
| Histological type | IDC | 3038 | 87.63% | 942 | 89.71% | 2096 | 86.72% | 0.016 |
| Non-IDC | 429 | 12.37% | 108 | 10.29% | 321 | 13.28% | ||
| Marital | Married | 1933 | 55.75% | 601 | 57.24% | 1332 | 55.11% | 0.511 |
| Unmarried | 1339 | 38.62% | 392 | 37.33% | 947 | 39.18% | ||
| Unknown | 195 | 5.62% | 57 | 5.43% | 138 | 5.71% | ||
| T Stage | T1 | 1404 | 40.50% | 402 | 38.29% | 1002 | 41.46% | <0.001 |
| T2 | 1486 | 42.86% | 422 | 40.19% | 1064 | 44.02% | ||
| T3 | 278 | 8.02% | 108 | 10.29% | 170 | 7.03% | ||
| T4 | 183 | 5.28% | 68 | 6.48% | 115 | 4.76% | ||
| Tx | 116 | 3.35% | 50 | 4.76% | 66 | 2.73% | ||
| N Stage | N0 | 2204 | 63.57% | 573 | 54.57% | 1631 | 67.48% | <0.001 |
| N1 | 943 | 27.20% | 359 | 34.19% | 584 | 24.16% | ||
| N2 | 156 | 4.50% | 57 | 5.43% | 99 | 4.10% | ||
| N3 | 121 | 3.49% | 45 | 4.29% | 76 | 3.14% | ||
| Nx | 43 | 1.24% | 16 | 1.52% | 27 | 1.12% | ||
| Grade | I | 77 | 2.22% | 12 | 1.14% | 65 | 2.69% | <0.001 |
| II | 639 | 18.43% | 252 | 24.00% | 387 | 16.01% | ||
| III/IV | 2583 | 74.50% | 716 | 68.19% | 1867 | 77.24% | ||
| Unknown | 168 | 4.85% | 70 | 6.67% | 98 | 4.05% | ||
| Median household income (inflation ajusted) | <50,000 $ | 513 | 14.80% | 164 | 15.62% | 349 | 14.44% | 0.161 |
| 50,000-59,999 $ | 569 | 16.41% | 171 | 16.29% | 398 | 16.47% | ||
| 60,000-69,999 $ | 1152 | 33.23% | 322 | 30.67% | 830 | 34.34% | ||
| 70,000 $+ | 1233 | 35.56% | 393 | 37.43% | 840 | 34.75% | ||
| Surgery | No | 255 | 7.36% | 94 | 8.95% | 161 | 6.66% | 0.048 |
| Yes | 3193 | 92.10% | 949 | 90.38% | 2244 | 92.84% | ||
| Unknown | 19 | 0.55% | 7 | 0.67% | 12 | 0.50% | ||
| Radiotherapy | No/unknown | 1711 | 49.35% | 561 | 53.43% | 1150 | 47.58% | 0.002 |
| Yes | 1756 | 50.65% | 489 | 46.57% | 1267 | 52.42% | ||
| Chemotherapy | No/unknown | 916 | 26.42% | 225 | 21.43% | 691 | 28.59% | <0.001 |
| Yes | 2551 | 73.58% | 825 | 78.57% | 1726 | 71.41% | ||
| Neoadjuvant therapy | Not given | 2059 | 59.39% | 544 | 51.81% | 1515 | 62.68% | <0.001 |
| Yes | 731 | 21.08% | 278 | 26.48% | 453 | 18.74% | ||
| Unknown | 677 | 19.53% | 228 | 21.71% | 449 | 18.58% | ||
SEER: the Surveillance, Epidemiology, and End Results; sPR+: single progesterone receptor-positive.
Univariable and multivariable Cox regression analysis
We performed univariable Cox regression analysis to identify variables that significantly influenced OS and BCSS in patients, including age at diagnosis, histological type, HER2 status, marital status, race, histological type, T and N stage, grade, median household income (inflation-adjusted), surgery, radiotherapy, and chemotherapy. Interestingly, Cox regression analysis showed that neoadjuvant therapy did not benefit patients with sPR+ (Table 2). Thus, we further stratified patients by their response to neoadjuvant therapy for prognostic comparisons. The results showed that OS and BCSS were significantly better in only those patients who had a complete response (CR) to neoadjuvant therapy compared to those who did not receive neoadjuvant therapy or did not have a CR (Figure 2A, 2B).
Table 2.
Univariate and multivariate Cox analysis of characteristics extracted from the SEER database
| Univariate Cox analysis | Multivariate Cox analysis | |||||||||||
|---|---|---|---|---|---|---|---|---|---|---|---|---|
|
|
|
|||||||||||
| OS | BCSS | OS | BCSS | |||||||||
|
|
|
|
|
|||||||||
| HR | 95% CI | P value | HR | 95% CI | P value | HR | 95% CI | P value | HR | 95% CI | P value | |
| Age at diagnosis | ||||||||||||
| <40 | Reference | Reference | Reference | Reference | ||||||||
| 40-49 | 0.809 | 0.581-1.127 | 0.210 | 0.792 | 0.557-1.126 | 0.194 | 0.969 | 0.675-1.391 | 0.865 | 0.911 | 0.622-1.336 | 0.633 |
| 50-59 | 0.912 | 0.666-1.249 | 0.567 | 0.901 | 0.646-1.258 | 0.540 | 1.069 | 0.757-1.509 | 0.707 | 1.080 | 0.751-1.553 | 0.677 |
| 60-69 | 0.994 | 0.721-1.370 | 0.970 | 0.795 | 0.558-1.131 | 0.202 | 1.114 | 0.777-1.596 | 0.558 | 0.925 | 0.623-1.372 | 0.698 |
| 70-79 | 1.842 | 1.327-2.556 | *** | 1.333 | 0.921-1.930 | 0.128 | 2.082 | 1.431-3.027 | *** | 1.620 | 1.063-2.469 | * |
| 80+ | 4.945 | 3.611-6.774 | *** | 2.380 | 1.624-3.486 | *** | 3.693 | 2.498-5.461 | *** | 2.123 | 1.320-3.413 | *** |
| HER2 | ||||||||||||
| Negative | Reference | Reference | Reference | Reference | ||||||||
| Positive | 0.695 | 0.578-0.836 | *** | 0.609 | 0.486-0.763 | *** | 0.594 | 0.479-0.736 | *** | 0.474 | 0.364-0.617 | *** |
| Race | ||||||||||||
| White | Reference | Reference | Reference | Reference | ||||||||
| Black | 1.039 | 0.836-1.292 | 0.729 | 0.981 | 0.755-1.274 | 0.884 | 1.081 | 0.844-1.383 | 0.539 | 0.951 | 0.703-1.288 | 0.746 |
| Other | 0.601 | 0.441-0.819 | ** | 0.641 | 0.451-0.912 | * | 0.563 | 0.391-0.811 | ** | 0.622 | 0.412-0.941 | * |
| Histological type | ||||||||||||
| IDC | Reference | Reference | Reference | Reference | ||||||||
| Non-IDC | 1.269 | 1.019-1.581 | * | 1.185 | 0.909-1.545 | 0.209 | 0.992 | 0.766-1.285 | 0.952 | 1.015 | 0.746-1.383 | 0.923 |
| Marital status | ||||||||||||
| Married | Reference | Reference | Reference | Reference | ||||||||
| Unmarried | 1.642 | 1.394-1.935 | *** | 1.348 | 1.113-1.634 | ** | 1.069 | 0.886-1.291 | 0.487 | 1.006 | 0.805-1.257 | 0.960 |
| T Stage | ||||||||||||
| T1 | Reference | Reference | Reference | Reference | ||||||||
| T2 | 1.749 | 1.435-2.133 | *** | 2.164 | 1.684-2.780 | *** | 1.643 | 1.310-2.060 | *** | 1.751 | 1.324-2.315 | *** |
| T3 | 2.891 | 2.189-3.819 | *** | 4.202 | 3.040-5.808 | *** | 2.860 | 2.047-3.996 | *** | 3.193 | 2.178-4.681 | *** |
| T4 | 6.357 | 4.910-8.230 | *** | 9.424 | 6.964-12.754 | *** | 4.740 | 3.380-6.645 | *** | 5.189 | 3.512-7.666 | *** |
| N Stage | ||||||||||||
| N0 | Reference | Reference | Reference | Reference | ||||||||
| N1 | 1.688 | 1.405-2.027 | *** | 2.275 | 1.828-2.831 | *** | 1.562 | 1.259-1.938 | *** | 1.883 | 1.459-2.430 | *** |
| N2 | 2.728 | 2.025-3.676 | *** | 3.895 | 2.787-5.444 | *** | 2.464 | 1.743-3.484 | *** | 3.040 | 2.067-4.470 | *** |
| N3 | 5.483 | 4.170-7.210 | *** | 8.692 | 6.469-11.680 | *** | 4.239 | 3.059-5.875 | *** | 5.739 | 4.020-8.193 | *** |
| Grade | ||||||||||||
| I | Reference | Reference | Reference | Reference | ||||||||
| II | 3.634 | 1.152-11.460 | * | 6.095 | 0.844-44.030 | 0.073 | 2.193 | 0.688-6.990 | 0.184 | 3.565 | 0.489-26.007 | 0.210 |
| III/IV | 4.274 | 1.373-13.300 | * | 9.676 | 1.359-68.880 | * | 2.665 | 0.846-8.401 | 0.094 | 5.023 | 0.698-36.154 | 0.109 |
| Median household income (inflation ajusted) | ||||||||||||
| <50,000 $ | Reference | Reference | Reference | Reference | ||||||||
| 50,000-59,999 $ | 0.880 | 0.677-1.144 | 0.339 | 0.829 | 0.609-1.130 | 0.236 | 0.890 | 0.665-1.191 | 0.433 | 0.775 | 0.547-1.097 | 0.150 |
| 60,000-69,999 $ | 0.759 | 0.604-0.954 | * | 0.758 | 0.581-0.989 | * | 0.738 | 0.570-0.955 | * | 0.711 | 0.526-0.963 | * |
| 70,000 $+ | 0.667 | 0.529-0.842 | *** | 0.635 | 0.483-0.834 | ** | 0.784 | 0.603-1.1020 | 0.069 | 0.761 | 0.559-1.034 | 0.081 |
| Surgery | ||||||||||||
| No | Reference | Reference | Reference | Reference | ||||||||
| Yes | 0.243 | 0.198-0.298 | *** | 0.240 | 0.189-0.305 | *** | 0.557 | 0.419-0.740 | *** | 0.576 | 0.412-0.805 | ** |
| Radiotherapy | ||||||||||||
| None/unknown | Reference | Reference | Reference | Reference | ||||||||
| Yes | 0.542 | 0.461-0.639 | *** | 0.682 | 0.565-0.823 | *** | 0.705 | 0.580-0.856 | *** | 0.821 | 0.655-1.030 | 0.089 |
| Chemotherapy | ||||||||||||
| No | Reference | Reference | Reference | Reference | ||||||||
| Yes | 0.464 | 0.396-0.545 | *** | 0.735 | 0.601-0.899 | ** | 0.546 | 0.433-0.689 | *** | 0.635 | 0.478-0.844 | ** |
| Neoadjuvant therapy | ||||||||||||
| No | Reference | Reference | Reference | Reference | ||||||||
| Yes | 0.953 | 0.764-1.189 | 0.668 | 1.261 | 0.987-1.612 | 0.064 | / | / | / | / | / | / |
SEER: the Surveillance, Epidemiology, and End Results. *P<0.05, **P<0.01, ***P<0.001.
Figure 2.
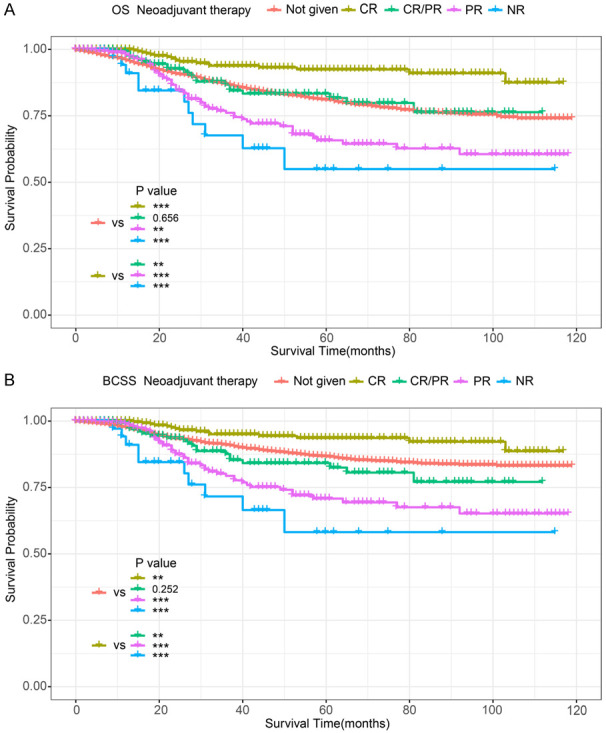
K-M survival analysis in sPR+ patients (stratified by response to neoadjuvant therapy). A. OS of sPR+ patients; B. BCSS of sPR+ patients. CR: complete response; PR: partial response; CR/PR: complete and/or partial response to neoadjuvant therapy; NR: no response; sPR: single progesterone receptor; OS: overall survival; BCSS: breast cancer-specific survival; K-M: Kaplan-Meier.
We then performed multivariable Cox regression analysis to eliminate confounding factors and uncover the independent factors that influence OS and BCSS (Table 2). It showed that worse OS and BCSS were closely related to age >70 years, HER2-, and advanced T and N stage. Further, surgery and chemotherapy were able to prolong OS and BCSS based on multivariable Cox regression analysis. Although radiotherapy prolonged OS, it did not improve the BCSS. The prognosis was also influenced by a few social factors, including race and financial stability. In other words, patients with high-income levels and other races had a better prognosis.
Prognostic differences between ER-PR+ and ER-PR- patients stratified by the HER2 status
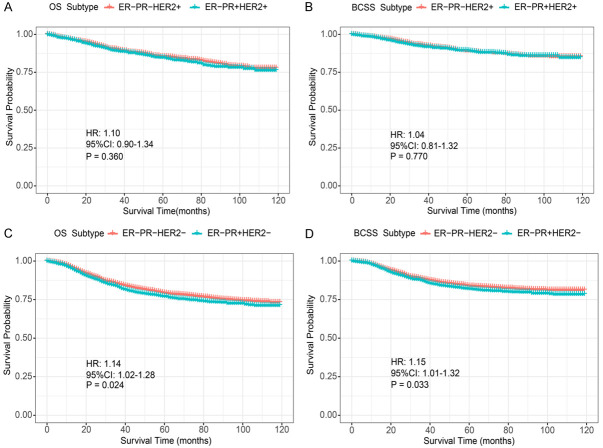
We compared baseline characteristics between patients with ER-PR+HER2+ and ER-PR-HER2+ subtypes (Table 3). T stage and median household income showed differences between the two groups. The identified imbalance was corrected using PSM. Similarly, we also compared and adjusted differences in characteristics between ER-PR+HER2- and ER-PR-HER2- subtypes (Table 4). PSM-adjusted data showed that there was no statistical difference in the prognosis between ER-PR+HER2+ and ER-PR-HER2+ subtypes (OS: P=0.360, hazard ration [HR]: 1.10; 95% confidence interval [CI]: 0.90-1.34; BCSS: P=0.770, HR: 1.04; 95% CI: 0.81-1.32; Figure 3A, 3B). The findings also demonstrated that patients with the ER-PR+HER2- subtype showed a slightly worse prognosis than those with the ER-PR-HER2- subtype (OS: P=0.024, HR: 1.14; 95% CI: 1.02-1.28; BCSS: P=0.033, HR: 1.15; 95% CI: 1.01-1.32; Figure 3C, 3D).
Table 3.
Baseline characteristics between ER-PR+HER2+ and ER-PR-HER2+ subtypes before and after PSM
| Characteristics | Unmatched Cohort | 1:2 propensity score matched (PSM) Cohort | ||||||||
|---|---|---|---|---|---|---|---|---|---|---|
|
|
|
|||||||||
| ER-PR+HER2+ | ER-PR-HER2+ | Unadjusted | ER-PR+HER2+ | ER-PR-HER2+ | PSM-adjusted | |||||
|
|
|
|
|
|
|
|||||
| N=1050 | % | N=15728 | % | P value | N=1045 | % | N=2082 | % | P value | |
| Age at diagnosis | 0.287 | 0.646 | ||||||||
| <40 | 115 | 10.95% | 1415 | 9.00% | 112 | 10.72% | 191 | 9.17% | ||
| 40-49 | 212 | 20.19% | 3051 | 19.40% | 212 | 20.29% | 433 | 20.80% | ||
| 50-59 | 313 | 29.81% | 4915 | 31.25% | 311 | 29.76% | 666 | 31.99% | ||
| 60-69 | 227 | 21.62% | 3648 | 23.19% | 227 | 21.72% | 446 | 21.42% | ||
| 70-79 | 123 | 11.71% | 1811 | 11.51% | 123 | 11.77% | 237 | 11.38% | ||
| 80+ | 60 | 5.71% | 888 | 5.65% | 60 | 5.74% | 109 | 5.24% | ||
| Race | 0.989 | 0.661 | ||||||||
| White | 751 | 71.52% | 11203 | 71.23% | 748 | 71.58% | 1516 | 72.81% | ||
| Black | 118 | 11.24% | 1819 | 11.57% | 117 | 11.20% | 243 | 11.67% | ||
| Other | 169 | 16.10% | 2520 | 16.02% | 168 | 16.08% | 303 | 14.55% | ||
| Unknown | 12 | 1.14% | 186 | 1.18% | 12 | 1.15% | 20 | 0.96% | ||
| Histological type | 0.786 | 0.092 | ||||||||
| IDC | 945 | 90.00% | 14159 | 90.02% | 940 | 89.95% | 1912 | 91.83% | ||
| Non-IDC | 108 | 10.29% | 1569 | 9.98% | 105 | 10.05% | 170 | 8.17% | ||
| Marital | 0.943 | 0.828 | ||||||||
| Married | 601 | 57.24% | 8944 | 56.87% | 599 | 57.32% | 1201 | 57.68% | ||
| Unmarried | 392 | 37.33% | 5950 | 37.83% | 390 | 37.32% | 780 | 37.46% | ||
| Unknown | 57 | 5.43% | 834 | 5.30% | 56 | 5.36% | 101 | 4.85% | ||
| T stage | 0.009 | |||||||||
| T1 | 402 | 38.29% | 6769 | 43.04% | 402 | 38.47% | 815 | 39.15% | 0.893 | |
| T2 | 422 | 40.19% | 5843 | 37.15% | 422 | 40.38% | 843 | 40.49% | ||
| T3 | 108 | 10.29% | 1527 | 9.71% | 107 | 10.24% | 216 | 10.37% | ||
| T4 | 68 | 6.48% | 1057 | 6.72% | 67 | 6.41% | 130 | 6.24% | ||
| Tx | 50 | 4.76% | 532 | 3.38% | 47 | 4.50% | 78 | 3.75% | ||
| N stage | 0.096 | 0.094 | ||||||||
| N0 | 573 | 54.57% | 9042 | 57.49% | 570 | 54.55% | 1186 | 56.96% | ||
| N1 | 359 | 34.19% | 4780 | 30.39% | 357 | 34.16% | 687 | 33.00% | ||
| N2 | 57 | 5.43% | 952 | 6.05% | 57 | 5.45% | 123 | 5.91% | ||
| N3 | 45 | 4.29% | 757 | 4.81% | 45 | 4.31% | 72 | 3.46% | ||
| Nx | 16 | 1.52% | 197 | 1.25% | 16 | 1.53% | 14 | 0.67% | ||
| Grade | 0.631 | 0.250 | ||||||||
| Well | 12 | 1.14% | 226 | 1.44% | 11 | 1.05% | 20 | 0.96% | ||
| Moderately | 252 | 24.00% | 3554 | 22.60% | 249 | 23.83% | 444 | 21.33% | ||
| Poorly | 716 | 68.19% | 10841 | 68.93% | 715 | 68.42% | 1497 | 71.90% | ||
| Unknown | 70 | 6.67% | 1107 | 7.04% | 70 | 6.70% | 121 | 5.81% | ||
| median household income (inflation adjusted) | <0.001 | 0.696 | ||||||||
| <50,000 $ | 164 | 15.62% | 1580 | 10.05% | 159 | 15.22% | 311 | 14.94% | ||
| 50,000-59,999 $ | 171 | 16.29% | 2424 | 15.41% | 171 | 16.36% | 346 | 16.62% | ||
| 60,000-69,999 $ | 322 | 30.67% | 5443 | 34.61% | 322 | 30.81% | 680 | 32.66% | ||
| 70,000 $+ | 393 | 37.43% | 6281 | 39.94% | 393 | 37.61% | 745 | 35.78% | ||
| Radiotherapy | 0.877 | 0.626 | ||||||||
| No/unknown | 561 | 53.43% | 8450 | 53.73% | 560 | 53.59% | 1095 | 52.59% | ||
| Yes | 489 | 46.57% | 7278 | 46.27% | 485 | 46.41% | 987 | 47.41% | ||
| Chemotherapy | 0.525 | 0.081 | ||||||||
| No/unknown | 225 | 21.43% | 3511 | 22.32% | 225 | 21.53% | 392 | 18.83% | ||
| Yes | 825 | 78.57% | 12217 | 77.68% | 820 | 78.47% | 1690 | 81.17% | ||
| Surgery | 0.106 | 0.119 | ||||||||
| No | 94 | 8.95% | 1247 | 7.93% | 94 | 9.00% | 154 | 7.40% | ||
| Yes | 949 | 90.38% | 14428 | 91.73% | 944 | 90.33% | 1921 | 92.27% | ||
| Unknown | 7 | 0.67% | 53 | 0.34% | 7 | 0.67% | 7 | 0.34% | ||
ER+/-: estrogen receptor positive/negative; PR+/-: progesterone receptor positive/negative; HER2+/-: human epidermal growth factor receptor 2 positive/negative; PSM: propensity score matching.
Table 4.
Baseline characteristics between ER-PR+HER2- and ER-PR-HER2- patients before and after PSM
| Characteristics | Unmatched Cohort | 1:2 propensity score matched (PSM) Cohort | ||||||||
|---|---|---|---|---|---|---|---|---|---|---|
|
|
|
|||||||||
| ER-PR+HER2- | ER-PR-HER2- | Unadjusted | ER-PR+HER2- | ER-PR-HER2- | PSM-adjusted | |||||
|
|
|
|
|
|
|
|||||
| N=2417 | % | N=38262 | % | P value | N=2416 | % | N=4826 | % | P value | |
| Age at diagnosis | 0.005 | 0.951 | ||||||||
| <40 | 275 | 11.38% | 3922 | 10.25% | 275 | 11.38% | 556 | 11.52% | ||
| 40-49 | 515 | 21.31% | 7345 | 19.20% | 514 | 21.27% | 1017 | 21.07% | ||
| 50-59 | 613 | 25.36% | 9882 | 25.83% | 613 | 25.37% | 1264 | 26.19% | ||
| 60-69 | 549 | 22.71% | 8928 | 23.33% | 549 | 22.72% | 1102 | 22.83% | ||
| 70-79 | 282 | 11.67% | 5324 | 13.91% | 282 | 11.67% | 538 | 11.15% | ||
| 80+ | 183 | 7.57% | 2861 | 7.48% | 183 | 7.57% | 349 | 7.23% | ||
| Race | 0.157 | 0.303 | ||||||||
| White | 1783 | 73.77% | 27569 | 72.05% | 1782 | 73.76% | 3585 | 74.29% | ||
| Black | 398 | 16.47% | 6763 | 17.68% | 398 | 16.47% | 803 | 16.64% | ||
| Other | 212 | 8.77% | 3628 | 9.48% | 212 | 8.77% | 409 | 8.47% | ||
| Unknown | 24 | 0.99% | 302 | 0.79% | 24 | 0.99% | 29 | 0.60% | ||
| Histological type | 0.953 | 0.598 | ||||||||
| IDC | 2096 | 86.72% | 33205 | 86.78% | 2096 | 86.75% | 4206 | 87.15% | ||
| Non-IDC | 321 | 13.28% | 5057 | 13.22% | 320 | 13.25% | 620 | 12.85% | ||
| Marital | 0.123 | 0.965 | ||||||||
| Married | 1332 | 55.11% | 20530 | 53.66% | 1331 | 55.09% | 2725 | 56.46% | ||
| Unmarried | 947 | 39.18% | 15744 | 41.15% | 947 | 39.20% | 1866 | 38.67% | ||
| Unknown | 138 | 5.71% | 1988 | 5.20% | 138 | 5.71% | 235 | 4.87% | ||
| T stage | 0.090 | |||||||||
| T1 | 1002 | 41.46% | 15862 | 41.46% | 1002 | 41.47% | 1995 | 41.34% | 0.380 | |
| T2 | 1064 | 44.02% | 16397 | 42.85% | 1063 | 44.00% | 2175 | 45.07% | ||
| T3 | 170 | 7.03% | 3247 | 8.49% | 170 | 7.04% | 345 | 7.15% | ||
| T4 | 115 | 4.76% | 1864 | 4.87% | 115 | 4.76% | 212 | 4.39% | ||
| Tx | 66 | 2.73% | 892 | 2.33% | 66 | 2.73% | 99 | 2.05% | ||
| N stage | 0.023 | 0.758 | ||||||||
| N0 | 1631 | 67.48% | 25118 | 65.65% | 1630 | 67.47% | 3294 | 68.26% | ||
| N1 | 584 | 24.16% | 9156 | 23.93% | 584 | 24.17% | 1157 | 23.97% | ||
| N2 | 99 | 4.10% | 2049 | 5.36% | 99 | 4.10% | 198 | 4.10% | ||
| N3 | 76 | 3.14% | 1487 | 3.89% | 76 | 3.15% | 135 | 2.80% | ||
| Nx | 27 | 1.12% | 452 | 1.18% | 27 | 1.12% | 42 | 0.87% | ||
| Grade | 0.022 | 0.422 | ||||||||
| Well | 65 | 2.69% | 734 | 1.92% | 64 | 2.65% | 100 | 2.07% | ||
| Moderately | 387 | 16.01% | 6273 | 16.39% | 387 | 16.02% | 767 | 15.89% | ||
| Poorly | 1867 | 77.24% | 29425 | 76.90% | 1867 | 77.28% | 3775 | 78.22% | ||
| Unknown | 98 | 4.05% | 1830 | 4.78% | 98 | 4.06% | 184 | 3.81% | ||
| median household income (inflation adjusted) | 0.001 | 0.614 | ||||||||
| <50,000 $ | 349 | 14.44% | 4520 | 11.81% | 348 | 14.40% | 659 | 13.66% | ||
| 50,000-59,999 $ | 398 | 16.47% | 6443 | 16.84% | 398 | 16.47% | 806 | 16.70% | ||
| 60,000-69,999 $ | 830 | 34.34% | 13241 | 34.61% | 830 | 34.35% | 1619 | 33.55% | ||
| 70,000 $+ | 840 | 34.75% | 14058 | 36.74% | 840 | 34.77% | 1742 | 36.10% | ||
| Radiotherapy | 0.271 | 0.895 | ||||||||
| No/unknown | 1150 | 47.58% | 18655 | 48.76% | 1150 | 47.60% | 2251 | 46.64% | ||
| Yes | 1267 | 52.42% | 19607 | 51.24% | 1266 | 52.40% | 2575 | 53.36% | ||
| Chemotherapy | <0.001 | 0.936 | ||||||||
| No/unknown | 691 | 28.59% | 9167 | 23.96% | 690 | 28.56% | 1326 | 27.48% | ||
| Yes | 1726 | 71.41% | 29095 | 76.04% | 1726 | 71.44% | 3500 | 72.52% | ||
| Surgery | 0.159 | 0.687 | ||||||||
| No | 161 | 6.66% | 2572 | 6.72% | 161 | 6.66% | 301 | 6.24% | ||
| Yes | 2244 | 92.84% | 35583 | 93.00% | 2243 | 92.84% | 4505 | 93.35% | ||
| Unknown | 12 | 0.50% | 107 | 0.28% | 12 | 0.50% | 20 | 0.41% | ||
ER+/-: estrogen receptor positive/negative; PR+/-: progesterone receptor positive/negative; HER2+/-: human epidermal growth factor receptor 2 positive/negative; PSM: propensity score matching.
Figure 3.
PSM-adjusted OS and BCSS of ER-PR+ and ER-PR- patients (stratified by the HER2 status). A. PSM-adjusted OS of ER-PR+ and ER-PR- (HER2+); B. PSM-adjusted BCSS of ER-PR+ and ER-PR- (HER2+); C. PSM-adjusted OS of ER-PR+ and ER-PR- (HER2-); D. PSM-adjusted BCSS of ER-PR+ and ER-PR- (HER2-). PSM: propensity score matching; OS: overall survival; BCSS: breast cancer specific survival; HR: hazard ratio; CI: confidence interval; ER+/-: estrogen receptor positive/negative; PR+/-: progesterone receptor positive/negative; HER2+/-: human epidermal growth factor receptor 2 positive/negative.
Construction and evaluation of predictive models for estimating prognosis in patients with sPR+
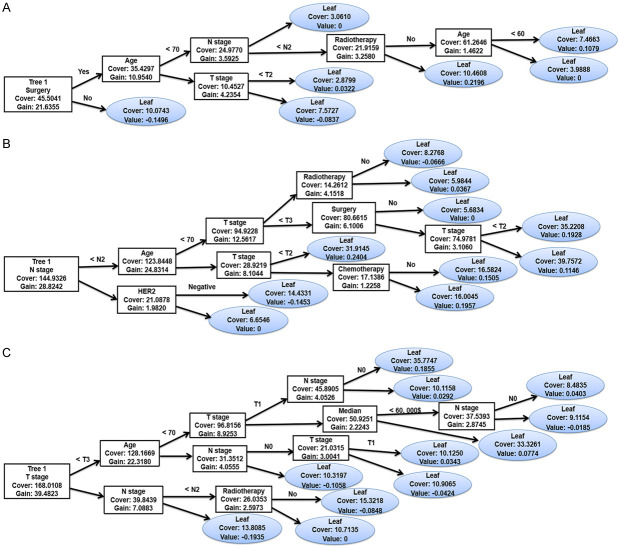
Considering the results, we established an XGBoost model to predict the OS of sPR+ patients at 1 year, 3 years, and 5 years. We randomized patients into train and test data groups at a ratio of 7:3. To ensure the stability of the model and confirm the key hyperparameters, we used ten-fold cross-validation in the training set for iterative testing and tuning. The logarithmic loss function was minimized at 17 subtrees as shown in Figure 4. To achieve optimization, the “nround” parameter was determined and the model is repetitively validated and adjusted for other major hyperparameters (Table 5). We adjusted the gamma, min_child_weight subsample and max_delta_step parameters to speed up the convergence of the model and prevent over-fitting. The scale_pos_weight parameter was set to resolve the sample imbalance. The first subtree of the XGBoost model is illustrated in Figure 5 for understanding. For the train and validation sets, we established the predicted ROC curves and computed the corresponding AUCs. Our XGBoost model was successful in predicting the survival of sPR+ patients at 1 year (test set: AUC=0.884; train set: AUC=0.904), 3 years (test set: AUC=0.847; train set: AUC=0.850), and 5 years (test set: AUC=0.824; train set: AUC=0.828; Figure 6). Compared to ANN (1-year: AUC=0.827; 3-year: AUC=0.795; 5-year: AUC=0.781) and traditional machine learning algorithms, LR (1-year: AUC=0.806; 3-year: AUC=0.794; 5-year: AUC=0.784), RF (1-year: AUC=0.811; 3-year: AUC=0.755; 5-year: AUC=0.764), ID3 (1-year: AUC=0.608; 3-year: AUC=0.623; 5-year: AUC=0.668), and KNN (1-year: AUC=0.544; 3-year: AUC=0.600; 5-year: AUC=0.595), the XGBoost model provided most accurate validations (Table 6).
Figure 4.
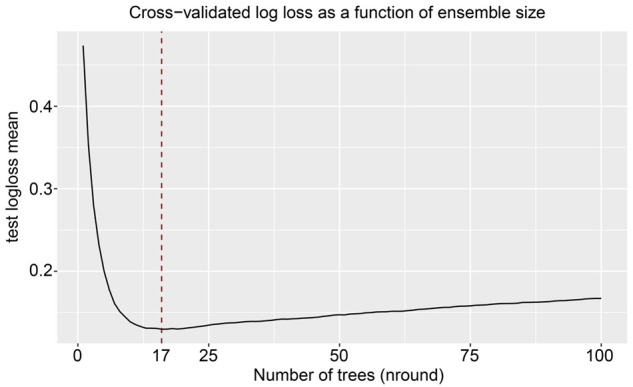
Ideal number of subtrees using 10-fold cross-validation.
Table 5.
Main parameters of the XGBoost model
| Parameter | Value |
|---|---|
| gamma | 2 |
| min_child_weight | 5 |
| scale_pos_weight | 0.3 |
| subsample | 0.8 |
| max_delta_step | 6 |
| alpha | 2 |
| max_depth | 7 |
| eta | 0.2 |
| nround | 17 |
Figure 5.
First tree of the XGBoost models. A. First tree of the 1-year prognostic model; B. First tree of the 3-year prognostic model; C. First tree of the 5-year prognostic model. HER2: human epidermal growth factor receptor 2; XGBoost: extreme gradient boosting.
Figure 6.
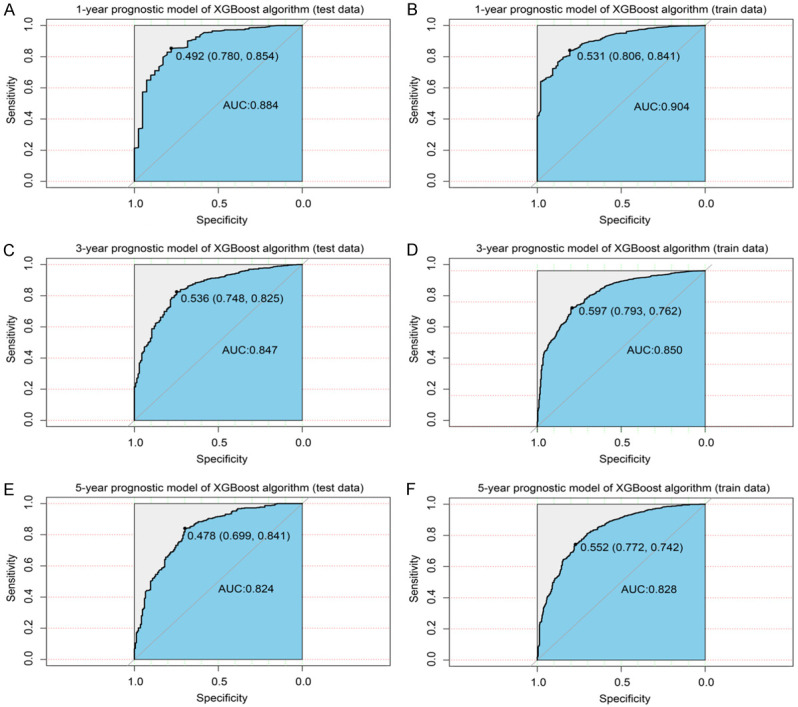
XGBoost model evaluation. A. ROC curve for the test data (1-year prognostic model); B. ROC curve for the train data (1-year prognostic model); C. ROC curve for the test data (3-year prognostic model); D. ROC curve for the train data (3-year prognostic model); E. ROC curve for the test data (5-year prognostic model); F. ROC curve for the train data (5-year prognostic model). ROC: receiver operating characteristic curve; XGBoost: extreme gradient boosting.
Table 6.
Performance of prognostic models built using machine learning algorithms on test data (area under the ROC curve)
| 1-year survival | 3-year survival | 5-year survival | |
|---|---|---|---|
| XGBoost | 0.884 | 0.847 | 0.824 |
| ANN | 0.827 | 0.795 | 0.781 |
| LR | 0.806 | 0.794 | 0.784 |
| RF | 0.811 | 0.755 | 0.764 |
| ID3 | 0.608 | 0.623 | 0.668 |
| KNN | 0.544 | 0.600 | 0.595 |
XGBoost: extreme gradient boosting; ANN: artificial neural network; LR: logistic regression; RF: random forest; ID3: decision tree; KNN: K-Nearest Neighbor.
The effectiveness and precision of the XGBoost model were assessed using a confusion matrix. The 1-year survival model showed a correctness of 0.85, recall of 0.85, accuracy of 0.99, and F1 score of 0.91 (Figure 7A); the 3-year survival model showed a correctness of 0.82, recall of 0.85, accuracy of 0.92, and F1 score of 0.88 (Figure 7B). The 5-year survival model showed a correctness of 0.79, recall of 0.84, accuracy of 0.86, and F1 score of 0.85 (Figure 7C). Thus, the models were efficient and successful in predicting survival.
Figure 7.
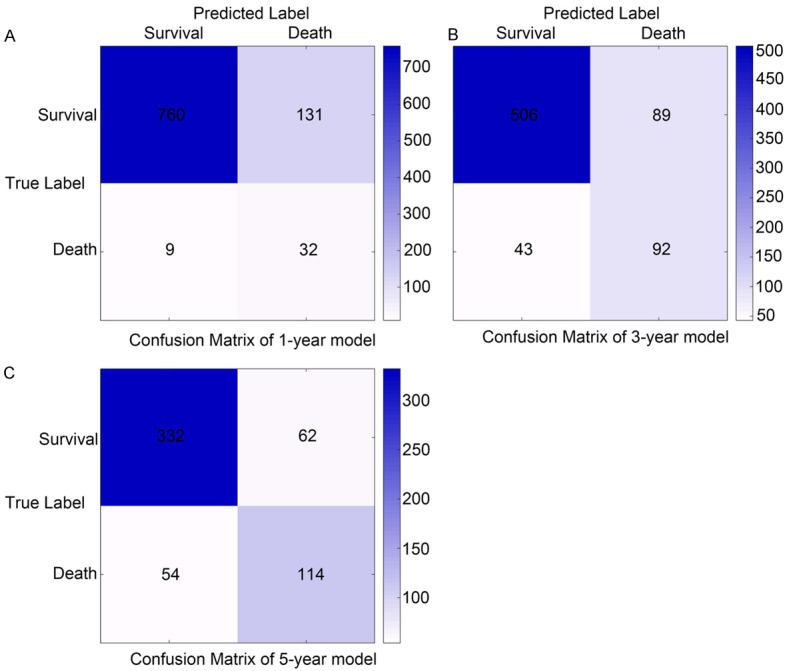
Confusion matrix of the predicted results of the XGBoost model in test data. Confusion matrix in the (A) 1-year prognostic model; (B) 3-year prognostic model; (C) 5-year prognostic model. XGBoost: extreme gradient boosting.
Additionally, the clinical characteristics in the models were ranked based on their prognosis-affecting ability. Surgery, age, T stage, N stage, and radiotherapy were the top five factors affecting prognosis. Among them, surgery and radiotherapy were factors important for short-term prognostic models (1-year survival; Figure 8A), and their ability to predict prognosis decreased as survival duration increased (Figure 8B). The ability of neoadjuvant therapy to predict prognosis increased in the long-term model (5-year survival; Figure 8C).
Figure 8.
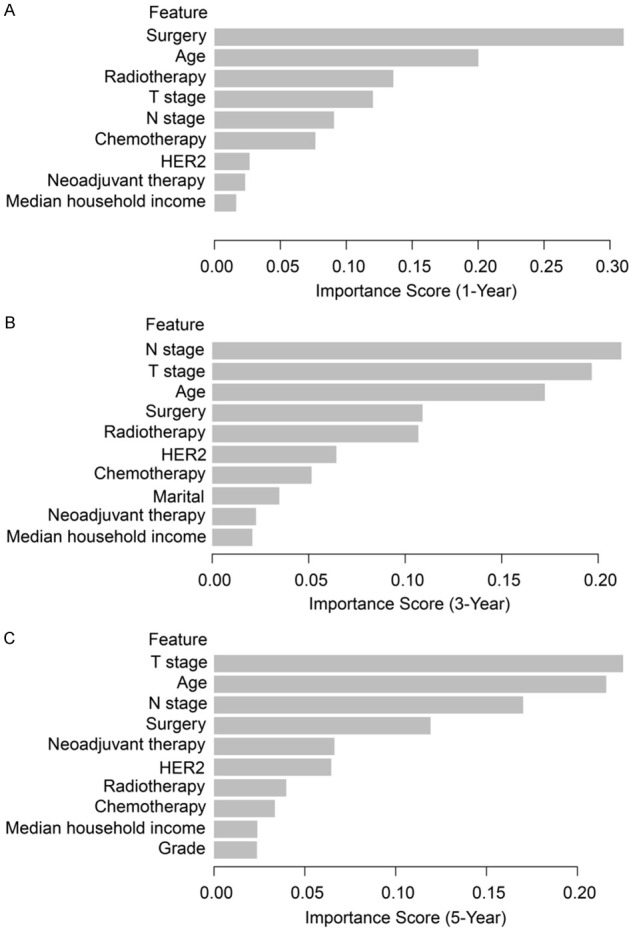
Weight of each clinical feature in the XGBoost prognostic model (ranked by their importance). Weight of clinical features in (A) 1-year, (B) 3-year, and (C) 5-year prognostic models. XGBoost: extreme gradient boosting; HER2: human epidermal growth factor receptor 2.
Validation using an external cohort
To further validate our models, we collected clinical and prognostic information from 22 patients with sPR+ BC from our hospital (Supplementary Table 1). The results showed that our XGBoost models exhibited good robustness in an external independent data set (1-year: AUC=0.889 (Figure 9A); 2-year: AUC=0.846 (Figure 9B); 3-year: AUC=0.821 (Figure 9C)). In addition, we compared the survival benefit of endocrine therapy in patients at our hospital. We found that intense endocrine therapy did not provide a significant OS benefit compared to the initial endocrine therapy or no endocrine therapy (P=0.600, HR: 1.46; 95% CI: 0.35-6.17; Figure 10).
Figure 9.
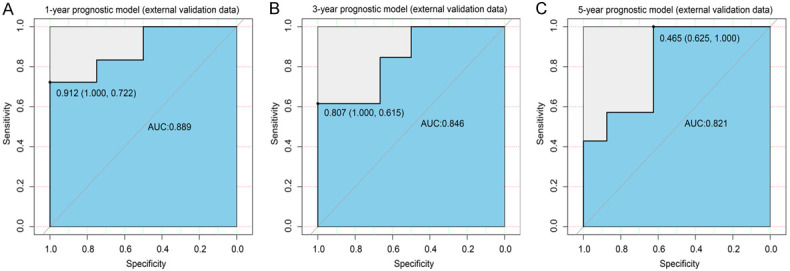
External validation data of XGBoost models. ROC curve for the (A) 1-year, (B) 3-year, (C) 5-year prognostic models. ROC: receiver operating characteristic curve; AUC: area under the curve; XGBoost: extreme gradient boosting.
Figure 10.
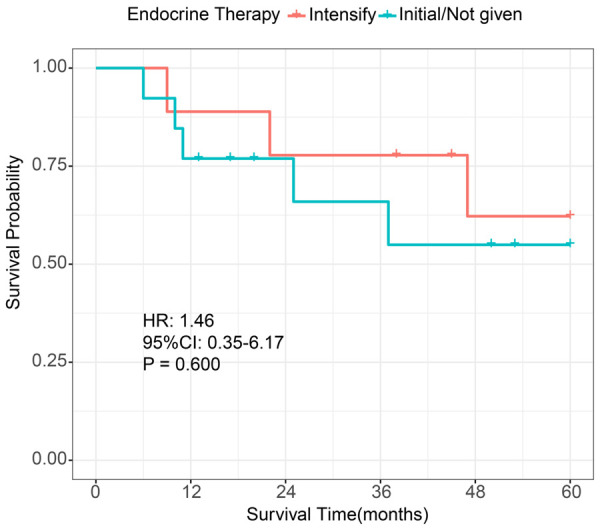
K-M survival analysis in single PR+ patients (stratified by endocrine therapy). K-M: Kaplan-Meier; HR: hazard ratio; CI: confidence interval; initial endocrine therapy: 5 years of treatment with tamoxifen or aromatase inhibitors; intensified endocrine therapy: 5 years of tamoxifen or aromatase inhibitor therapy followed by either its continuation or concomitant ovarian function inhibitor therapy.
Discussion
Currently, ER, PR, and HER2 biomarkers are used in addition to conventional prognostic factors, to identify suitable treatment and predict prognosis in BC [15,16]. Single PR+ BC is a unique and biologically distinct subgroup, and its presence was once debatable. The features and prognosis of sPR+ BC remain poorly understood due to its rarity and conflicting evidence. The management and treatment of sPR+ BC thus become challenging. A lack of an accurate and effective model for predicting survival further adds to the treatment challenges of clinicians. To date, our comprehensive study is the first to utilize the largest cohort and assess the clinical characteristics and prognosis of patients with sPR+ BC. We established a robust XGBoost (AI prediction) model that showed exceptional accuracy and effectiveness in predicting the survival of patients with sPR+ BC at 1, 3, and 5 years. The model helped to grade the five most important clinical characteristics affecting prognosis. The effectiveness and precision of the model were assessed and proved using the confusion matrix. These results demonstrated a high and successful utility of the models in the clinical space. Improved treatment for BC using precision medicine can be achieved through the implementation of machine learning for enhancing prognostic abilities in cancer.
In recent years, neoadjuvant therapy has evolved significantly as a standard for treating locally advanced resectable or unresectable BC [17,18]. It is more widely applied for the treatment of nearly all forms of BC [19]. A pathologic CR (pCR) seen with neoadjuvant treatment during surgery has been shown to improve OS [20]. In contrast, patients with a non-pCR have a poor prognosis [21]. Due to the strong association between pCR and survival, the US Food and Drug Administration (FDA) now considers a pCR with neoadjuvant therapy as a surrogate endpoint in clinical trials for drug approval [22]. Single PR+ BC is a distinct subtype identified recently, and data on the efficacy of neoadjuvant therapy in this type are limited. Surprisingly, univariate Cox regression analysis revealed that neoadjuvant therapy did not benefit patients with sPR+ BC. Further stratified analysis indicated that only patients who had a CR to neoadjuvant therapy appeared to benefit from it. Clinical trials have demonstrated a connection between pCR and improved long-term outcomes [17,18,23]. However, the results were less reliable due to the small sample sizes and uncertainty with subtype-specific pCR estimates in individual studies. The XGBoost model in our study helped grade the importance of clinical characteristics. We found that neoadjuvant therapy was beneficial to achieve long-term survival.
It is not clear whether the prognosis in sPR+ BC was different from that of other subtypes of BC [5,24]. Two studies revealed that the survival of the patients with the sPR+ subtype was comparable to those with the ER-PR- subtype [25,26]. In contrast, a study by Ethier et al. revealed that the survival in the sPR+ subtype was equivalent to that in the ER+/PR+ subtype [27]. Rakha et al. reported that no statistically significant difference in survival was seen between the two single positive hormone receptor subtypes and between single positive hormone subtypes and double negative subtypes [6]. It is noteworthy that initially the effect of HER2 on single hormone receptor positive phenotype was ignored and the comparison was rather crude. Additionally, no study compared ER-PR+ and ER-PR- subtypes stratified by the HER2 status. In this study, PSM was introduced to adjust for differences in clinicopathological characteristics between subtypes. The PSM-adjusted data showed that there is no statistically significant difference in prognosis between the ER-PR+HER2+ and ER-PR-HER2+ subtypes. Patients with the ER-PR+HER2- subtype had a slightly worse prognosis than those with the ER-PR-HER2- subtype. A possible explanation is that compared to ER-PR-HER2-, the attention of treatment in patients with ER-PR+HER2- is focused on endocrine therapy, resulting in inadequate adjuvant chemotherapy. Therefore, the sPR+ subtype may be more aggressive compared to the other subtypes. The results also revealed that HER2 positivity was more common in patients with sPR+ BC, which was consistent with results from other studies [5,24]. ER and PR markers were proven to be strong prognostic indicators of responsiveness to endocrine treatment in BC [7,12]. HER2-blocking therapies, such as trastuzumab and/or pertuzumab, in conjunction with chemotherapy [28] and HER2-targeting therapeutics, such as drug-antibody conjugate ado-trastuzumab emtansine [29], are considered the standard first-line highly efficacious treatment for HER2+ BC. No statistical difference was seen between the prognosis of ER-PR+HER2+ and ER-PR-HER2+, suggesting that the endocrine therapy will not benefit patients with ER-PR+HER2+ BC. This is may be because the HER2 signaling pathway was dominant in HER2+ BC with minimal influence of PR markers. A previous study has shown that patients with the sPR+ subtype had a poor prognosis with systemic endocrine treatment compared to ER+PR+ and ER+PR- subtypes [12]. A study by Davies et al. showed that endocrine therapy with tamoxifen for 5 years did not benefit patients with sPR+ BC [30]. Our results showed that intensified endocrine therapy did not provide a significant OS benefit compared to the initial endocrine therapy. Therefore, de-escalation over intensification is recommended for endocrine therapy in patients with sPR+ BC. Further prospective studies on the response of sPR+ BC to endocrine therapy are warranted.
Our study may have some potential limitations despite its promising results. First, metastases tend to have an extremely poor prognosis and hence sPR+ BC cases with distant metastases were excluded to avoid bias in prognostic comparisons, thereby limiting the study population to some extent. Second, according to the SEER database, a CR is defined based on clinical findings, i.e., the clearance of known tumors/lesions from lymph nodes, which somewhat differs from the pCR defined in some studies. Third, the treatment data of patients with sPR+ BC, such as the type of endocrine therapy, were not available in the SEER database, thereby further limiting our research. Despite this, our article still yields surprising results.
Conclusions
We analyzed the clinical characteristics and prognosis of patients with sPR+ BC and constructed machine-learning prognostic models to predict survival. These models were exceptionally reproducible and effective in predicting survival. Possible predictive variables for sPR+ patients were identified. Our findings implied that endocrine therapy may not be beneficial for patients with sPR+ BC and that intensive adjuvant chemotherapy is recommended instead.
Acknowledgements
We appreciate the efforts of the entire SEER database personnel in terms of data gathering, maintenance, distribution, and other tasks. We also want to express our gratitude to the entire development team of the R programming package for generously sharing the code. This work was funded in part by the National Science Foundation of China (82174164, to S.Q.Z., 81901886, to C.D.), Shaanxi Administration of Traditional Chinese Medicine (2021-ZZ-JC019, to C.D.), the Key Research and Development Program of Shaanxi (2022SF-411, to C.D.), and the Fundamental Research Funds for the Central Universities (xzy012020040, to C.D.).
Disclosure of conflict of interest
None.
Supporting Information
References
- 1.Sung H, Ferlay J, Siegel RL, Laversanne M, Soerjomataram I, Jemal A, Bray F. Global cancer statistics 2020: GLOBOCAN estimates of incidence and mortality worldwide for 36 cancers in 185 countries. CA Cancer J Clin. 2021;71:209–249. doi: 10.3322/caac.21660. [DOI] [PubMed] [Google Scholar]
- 2.Horwitz KB, Koseki Y, McGuire WL. Estrogen control of progesterone receptor in human breast cancer: role of estradiol and antiestrogen. Endocrinology. 1978;103:1742–1751. doi: 10.1210/endo-103-5-1742. [DOI] [PubMed] [Google Scholar]
- 3.Keshgegian AA, Cnaan A. Estrogen receptor-negative, progesterone receptor-positive breast carcinoma: poor clinical outcome. Arch Pathol Lab Med. 1996;120:970–973. [PubMed] [Google Scholar]
- 4.De Maeyer L, Van Limbergen E, De Nys K, Moerman P, Pochet N, Hendrickx W, Wildiers H, Paridaens R, Smeets A, Christiaens MR, Vergote I, Leunen K, Amant F, Neven P. Does estrogen receptor negative/progesterone receptor positive breast carcinoma exist? J. Clin. Oncol. 2008;26:335–336. doi: 10.1200/JCO.2007.14.8411. author reply 336-338. [DOI] [PubMed] [Google Scholar]
- 5.Rhodes A, Jasani B. The oestrogen receptor-negative/progesterone receptor-positive breast tumour: a biological entity or a technical artefact? J Clin Pathol. 2009;62:95–96. doi: 10.1136/jcp.2008.060723. [DOI] [PubMed] [Google Scholar]
- 6.Rakha EA, El-Sayed ME, Green AR, Paish EC, Powe DG, Gee J, Nicholson RI, Lee AH, Robertson JF, Ellis IO. Biologic and clinical characteristics of breast cancer with single hormone receptor positive phenotype. J. Clin. Oncol. 2007;25:4772–4778. doi: 10.1200/JCO.2007.12.2747. [DOI] [PubMed] [Google Scholar]
- 7.Nadji M, Gomez-Fernandez C, Ganjei-Azar P, Morales AR. Immunohistochemistry of estrogen and progesterone receptors reconsidered: experience with 5,993 breast cancers. Am J Clin Pathol. 2005;123:21–27. doi: 10.1309/4wv79n2ghj3x1841. [DOI] [PubMed] [Google Scholar]
- 8.Schroth W, Winter S, Büttner F, Goletz S, Faißt S, Brinkmann F, Saladores P, Heidemann E, Ott G, Gerteis A, Alscher MD, Dippon J, Schwab M, Brauch H, Fritz P. Clinical outcome and global gene expression data support the existence of the estrogen receptor-negative/progesterone receptor-positive invasive breast cancer phenotype. Breast Cancer Res Treat. 2016;155:85–97. doi: 10.1007/s10549-015-3651-5. [DOI] [PubMed] [Google Scholar]
- 9.Itoh M, Iwamoto T, Matsuoka J, Nogami T, Motoki T, Shien T, Taira N, Niikura N, Hayashi N, Ohtani S, Higaki K, Fujiwara T, Doihara H, Symmans WF, Pusztai L. Estrogen receptor (ER) mRNA expression and molecular subtype distribution in ER-negative/progesterone receptor-positive breast cancers. Breast Cancer Res Treat. 2014;143:403–409. doi: 10.1007/s10549-013-2763-z. [DOI] [PubMed] [Google Scholar]
- 10.Li Y, Yang D, Yin X, Zhang X, Huang J, Wu Y, Wang M, Yi Z, Li H, Li H, Ren G. Clinicopathological characteristics and breast cancer-specific survival of patients with single hormone receptor-positive breast cancer. JAMA Netw Open. 2020;3:e1918160. doi: 10.1001/jamanetworkopen.2019.18160. [DOI] [PMC free article] [PubMed] [Google Scholar]
- 11.Dauphine C, Moazzez A, Neal JC, Chlebowski RT, Ozao-Choy J. Single hormone receptor-positive breast cancers have distinct characteristics and survival. Ann Surg Oncol. 2020;27:4687–4694. doi: 10.1245/s10434-020-08898-5. [DOI] [PubMed] [Google Scholar]
- 12.Bardou VJ, Arpino G, Elledge RM, Osborne CK, Clark GM. Progesterone receptor status significantly improves outcome prediction over estrogen receptor status alone for adjuvant endocrine therapy in two large breast cancer databases. J. Clin. Oncol. 2003;21:1973–1979. doi: 10.1200/JCO.2003.09.099. [DOI] [PubMed] [Google Scholar]
- 13.Sajda P. Machine learning for detection and diagnosis of disease. Annu Rev Biomed Eng. 2006;8:537–565. doi: 10.1146/annurev.bioeng.8.061505.095802. [DOI] [PubMed] [Google Scholar]
- 14.Tran KA, Kondrashova O, Bradley A, Williams ED, Pearson JV, Waddell N. Deep learning in cancer diagnosis, prognosis and treatment selection. Genome Med. 2021;13:152. doi: 10.1186/s13073-021-00968-x. [DOI] [PMC free article] [PubMed] [Google Scholar]
- 15.Nicolini A, Ferrari P, Duffy MJ. Prognostic and predictive biomarkers in breast cancer: past, present and future. Semin Cancer Biol. 2018;52:56–73. doi: 10.1016/j.semcancer.2017.08.010. [DOI] [PubMed] [Google Scholar]
- 16.Lindström LS, Karlsson E, Wilking UM, Johansson U, Hartman J, Lidbrink EK, Hatschek T, Skoog L, Bergh J. Clinically used breast cancer markers such as estrogen receptor, progesterone receptor, and human epidermal growth factor receptor 2 are unstable throughout tumor progression. J. Clin. Oncol. 2012;30:2601–2608. doi: 10.1200/JCO.2011.37.2482. [DOI] [PubMed] [Google Scholar]
- 17.Fisher B, Bryant J, Wolmark N, Mamounas E, Brown A, Fisher ER, Wickerham DL, Begovic M, DeCillis A, Robidoux A, Margolese RG, Cruz AB Jr, Hoehn JL, Lees AW, Dimitrov NV, Bear HD. Effect of preoperative chemotherapy on the outcome of women with operable breast cancer. J. Clin. Oncol. 1998;16:2672–2685. doi: 10.1200/JCO.1998.16.8.2672. [DOI] [PubMed] [Google Scholar]
- 18.von Minckwitz G, Untch M, Blohmer JU, Costa SD, Eidtmann H, Fasching PA, Gerber B, Eiermann W, Hilfrich J, Huober J, Jackisch C, Kaufmann M, Konecny GE, Denkert C, Nekljudova V, Mehta K, Loibl S. Definition and impact of pathologic complete response on prognosis after neoadjuvant chemotherapy in various intrinsic breast cancer subtypes. J. Clin. Oncol. 2012;30:1796–1804. doi: 10.1200/JCO.2011.38.8595. [DOI] [PubMed] [Google Scholar]
- 19.Kaufmann M, von Minckwitz G, Bear HD, Buzdar A, McGale P, Bonnefoi H, Colleoni M, Denkert C, Eiermann W, Jackesz R, Makris A, Miller W, Pierga JY, Semiglazov V, Schneeweiss A, Souchon R, Stearns V, Untch M, Loibl S. Recommendations from an international expert panel on the use of neoadjuvant (primary) systemic treatment of operable breast cancer: new perspectives 2006. Ann Oncol. 2007;18:1927–1934. doi: 10.1093/annonc/mdm201. [DOI] [PubMed] [Google Scholar]
- 20.Kuerer HM, Newman LA, Smith TL, Ames FC, Hunt KK, Dhingra K, Theriault RL, Singh G, Binkley SM, Sneige N, Buchholz TA, Ross MI, McNeese MD, Buzdar AU, Hortobagyi GN, Singletary SE. Clinical course of breast cancer patients with complete pathologic primary tumor and axillary lymph node response to doxorubicin-based neoadjuvant chemotherapy. J. Clin. Oncol. 1999;17:460–469. doi: 10.1200/JCO.1999.17.2.460. [DOI] [PubMed] [Google Scholar]
- 21.Cortazar P, Zhang L, Untch M, Mehta K, Costantino JP, Wolmark N, Bonnefoi H, Cameron D, Gianni L, Valagussa P, Swain SM, Prowell T, Loibl S, Wickerham DL, Bogaerts J, Baselga J, Perou C, Blumenthal G, Blohmer J, Mamounas EP, Bergh J, Semiglazov V, Justice R, Eidtmann H, Paik S, Piccart M, Sridhara R, Fasching PA, Slaets L, Tang S, Gerber B, Geyer CE Jr, Pazdur R, Ditsch N, Rastogi P, Eiermann W, von Minckwitz G. Pathological complete response and long-term clinical benefit in breast cancer: the CTNeoBC pooled analysis. Lancet. 2014;384:164–172. doi: 10.1016/S0140-6736(13)62422-8. [DOI] [PubMed] [Google Scholar]
- 22.Prowell TM, Pazdur R. Pathological complete response and accelerated drug approval in early breast cancer. N Engl J Med. 2012;366:2438–2441. doi: 10.1056/NEJMp1205737. [DOI] [PubMed] [Google Scholar]
- 23.Mieog JS, van der Hage JA, van de Velde CJ. Preoperative chemotherapy for women with operable breast cancer. Cochrane Database Syst Rev. 2007;2007:CD005002. doi: 10.1002/14651858.CD005002.pub2. [DOI] [PMC free article] [PubMed] [Google Scholar]
- 24.Chan M, Chang MC, González R, Lategan B, del Barco E, Vera-Badillo F, Quesada P, Goldstein R, Cruz I, Ocana A, Cruz JJ, Amir E. Outcomes of estrogen receptor negative and progesterone receptor positive breast cancer. PLoS One. 2015;10:e0132449. doi: 10.1371/journal.pone.0132449. [DOI] [PMC free article] [PubMed] [Google Scholar]
- 25.Yu KD, Jiang YZ, Hao S, Shao ZM. Molecular essence and endocrine responsiveness of estrogen receptor-negative, progesterone receptor-positive, and HER2-negative breast cancer. BMC Med. 2015;13:254. doi: 10.1186/s12916-015-0496-z. [DOI] [PMC free article] [PubMed] [Google Scholar]
- 26.Zheng H, Ge C, Lin H, Wu L, Wang Q, Zhou S, Tang W, Zhang X, Jin X, Xu X, Hong Z, Fu J, Du J. Estrogen receptor-negative/progesterone receptor-positive and her-2-negative breast cancer might no longer be classified as hormone receptor-positive breast cancer. Int J Clin Oncol. 2022;27:1145–1153. doi: 10.1007/s10147-022-02158-0. [DOI] [PubMed] [Google Scholar]
- 27.Ethier JL, Ocaña A, Rodríguez Lescure A, Ruíz A, Alba E, Calvo L, Ruíz-Borrego M, Santaballa A, Rodríguez CA, Crespo C, Ramos M, Gracia Marco J, Lluch A, Álvarez I, Casas M, Sánchez-Aragó M, Carrasco E, Caballero R, Amir E, Martin M. Outcomes of single versus double hormone receptor-positive breast cancer. A GEICAM/9906 sub-study. Eur J Cancer. 2018;94:199–205. doi: 10.1016/j.ejca.2018.02.018. [DOI] [PubMed] [Google Scholar]
- 28.Swain SM, Kim SB, Cortés J, Ro J, Semiglazov V, Campone M, Ciruelos E, Ferrero JM, Schneeweiss A, Knott A, Clark E, Ross G, Benyunes MC, Baselga J. Pertuzumab, trastuzumab, and docetaxel for HER2-positive metastatic breast cancer (CLEOPATRA study): overall survival results from a randomised, double-blind, placebo-controlled, phase 3 study. Lancet Oncol. 2013;14:461–471. doi: 10.1016/S1470-2045(13)70130-X. [DOI] [PMC free article] [PubMed] [Google Scholar]
- 29.Diéras V, Miles D, Verma S, Pegram M, Welslau M, Baselga J, Krop IE, Blackwell K, Hoersch S, Xu J, Green M, Gianni L. Trastuzumab emtansine versus capecitabine plus lapatinib in patients with previously treated HER2-positive advanced breast cancer (EMILIA): a descriptive analysis of final overall survival results from a randomised, open-label, phase 3 trial. Lancet Oncol. 2017;18:732–742. doi: 10.1016/S1470-2045(17)30312-1. [DOI] [PMC free article] [PubMed] [Google Scholar]
- 30.Early Breast Cancer Trialists’ Collaborative Group (EBCTCG) Davies C, Godwin J, Gray R, Clarke M, Cutter D, Darby S, McGale P, Pan HC, Taylor C, Wang YC, Dowsett M, Ingle J, Peto R. Relevance of breast cancer hormone receptors and other factors to the efficacy of adjuvant tamoxifen: patient-level meta-analysis of randomised trials. Lancet. 2011;378:771–784. doi: 10.1016/S0140-6736(11)60993-8. [DOI] [PMC free article] [PubMed] [Google Scholar]
Associated Data
This section collects any data citations, data availability statements, or supplementary materials included in this article.


