

Abstract
The bacterial toxin CcdB (Controller of Cell death or division B) targets DNA Gyrase, an essential bacterial topoisomerase, which is also the molecular target for fluoroquinolones. Here, we present a short cell‐penetrating 24‐mer peptide, CP1‐WT, derived from the Gyrase‐binding region of CcdB and examine its effect on growth of Escherichia coli, Salmonella Typhimurium, Staphylococcus aureus and a carbapenem‐ and tigecycline‐resistant strain of Acinetobacter baumannii in both axenic cultures and mouse models of infection. The CP1‐WT peptide shows significant improvement over ciprofloxacin in terms of its in vivo therapeutic efficacy in treating established infections of S. Typhimurium, S. aureus and A. baumannii. The molecular mechanism likely involves inhibition of Gyrase or Topoisomerase IV, depending on the strain used. The study validates the CcdB binding site on bacterial DNA Gyrase as a viable and alternative target to the fluoroquinolone binding site.
Keywords: antibacterial peptide, CcdB toxin, Gyrase and Topoisomerase IV as drug targets, mice models of infection, pathogenic bacteria
Subject Categories: DNA Replication, Recombination & Repair; Microbiology, Virology & Host Pathogen Interaction; Pharmacology & Drug Discovery
A CcdB toxin‐derived peptide targeting Type II topoisomerases acts as a broad‐spectrum antibacterial compound in mice, validating the CcdB binding site on the bacterial Gyrase as an alternative drug target in addition to the fluoroquinolone binding site.

Introduction
An unprecedented public health and economic catastrophe posed globally by the antimicrobial resistance (AMR) phenomenon could eliminate 10 million human lives annually by 2050 (Neill, 2014; de Kraker et al, 2016). ESKAPE “superbugs,” a class of multidrug‐resistant (MDR) bacterial pathogens consisting of Enterococcus faecium, Staphylococcus aureus, Klebsiella pneumoniae, Acinetobacter baumannii, Pseudomonas aeruginosa and Enterobacter species, are the major causative organisms for a substantial number of nosocomial infections, including ones that are acquired in intensive care units (Llaca‐Díaz et al, 2012; Nagarajan et al, 2019; Saharman et al, 2021). In the past two decades, Salmonella Typhimurium, a food‐borne gram‐negative bacterium responsible for nosocomial infections (Lee & Greig, 2013), has shown reduced susceptibilities towards diverse classes of antibiotics (Threlfall, 2002; Davis et al, 2007; Wang et al, 2019; Yang et al, 2020). As stated in a report from the Centre for Disease Dynamics, Economics and Policy (CDDEP), global dissemination of an alarming resistance phenomenon has been witnessed within a disturbing time frame of a little over 20 years from the start of clinical usage of fluoroquinolones, a popular broad‐spectrum antibacterial compound (Higgins et al, 2000; King et al, 2000; Robicsek et al, 2006; Nalule, 2011). There are numerous toxic molecules intrinsically present in the bacterial cellular milieu. Knowledge of their binding sites and mechanism of action can be used to design smaller cell‐permeable analogs that possess antibacterial activities. Such analogs can serve as lead compounds for further optimisation to yield new antimicrobials.
Topoisomerases are enzymes which have long been established as druggable intracellular targets, even six decades after the discovery of the two major Gyrase (a Type II topoisomerase) inhibitors, namely aminocoumarins (Hoeksema et al, 1955; Fairbrother & Williams, 1956; Shane, 1956; Drlica & Coughlin, 1989) and fluoroquinolones (Andriole, 1993; Zhanel et al, 1999; Emmerson & Jones, 2003). This is evident from the discoveries of varied classes of Type I topoisomerase inhibitor drugs, ranging from camptothecins acting as anticancer compounds (Wall & Wani, 1996; Pommier, 2006) to novel small molecules acting as antituberculosis and antipneumonia drugs (Sandhaus et al, 2016; García et al, 2018; Valenzuela et al, 2020). Topoisomerases regulate the cellular DNA supercoiling level (Champoux, 2001) and catalyse the interconversion of varied DNA topoisomers (Bates & Maxwell, 1997) by creation of transient DNA break(s) (Brown & Cozzarelli, 1979; Liu et al, 1980; Mizuuchi et al, 1980; Gellert, 1981) involving ATP‐mediated DNA‐nicking reactions (Morrison & Cozzarelli, 1979; Tse et al, 1980; Champoux, 1981; Liu et al, 1983; Sander & Hsieh, 1983). DNA Gyrase and Topoisomerase IV (both being Type II topoisomerases) generate scissions in both strands of the DNA followed by the introduction of negative supercoils (mediated by Gyrase), and unknotting of the knotted DNA, unlinking of the replicating chromosomal catenanes (Drlica & Zhao, 1997; Levine et al, 1998) and relaxation of negative supercoils (Kato et al, 1990; Levine et al, 1998) (mediated by Topoisomerase IV).
Topoisomerase inhibitors operate via two distinct yet interconnected mechanisms, namely by catalytically inhibiting the enzymatic action on a specified DNA topology and poisoning the enzyme by stabilisation of the DNA‐enzyme cleavage complex (preventing nick‐religation). CcdB (Controller of Cell Death or Division B), a proteinaceous bacterial toxin which is a part of the CcdB‐CcdA toxin‐antitoxin module present in the prokaryotic kingdom, binds to the Gyrase A subunit and poisons the topoisomerase by stabilising the Gyrase‐DNA covalent adduct (Bernard & Couturier, 1992; Bernard et al, 1993). The ternary complex of CcdB‐Gyrase‐DNA creates a physical barrier for the action of incoming polymerases involved in the replication and transcription machineries (Critchlow et al, 1997; Dao‐Thi et al, 2005), and the release of double‐stranded DNA breaks from the complex triggers a cascade of events leading to the formation of reactive oxygen species, ultimately causing cell death (Dwyer et al, 2007). Quinolones and CcdB share a similar Gyrase‐poisoning mechanism. Both the inhibitors directly bind to the adduct of nicked DNA and enzyme, thereby forming a ternary complex which is responsible for the generation of fatal intermediates, ultimately leading to cell death. Fluoroquinolones (quinolone derivatives) disrupt bacterial DNA synthesis and break the chromosomes, by inhibiting both the Type II enzymes (Gyrase and Topoisomerase IV) (Pham et al, 2019) with organism‐driven target‐specificities, wherein the primary intracellular targets differ in being Gyrase and Topoisomerase IV for gram‐negative and gram‐positive bacteria, respectively (Aldred et al, 2014).
Despite possessing identical modes of Gyrase inhibition, CcdB and fluoroquinolones have distinct binding pockets on the Gyrase A subunit (Scheirer & Higgins, 1997). Most of the critical residues in the Gyrase A14 fragment (residues 363–494 in the Gyrase A subunit) involved in CcdB‐binding (Dao‐Thi et al, 2005; Aghera et al, 2020), identified from the crystal structure of Escherichia coli CcdB‐Gyrase A complex (Dao‐Thi et al, 2005), are well conserved in Gyrase A14 sequences isolated from E. coli, Salmonella Typhimurium, Pseudomonas aeruginosa, Acinetobacter baumannii and Staphylococcus aureus. In a previously published report, short CcdB‐derived peptides comprising of the C‐terminal helical stretch (residues 84–101) connected by stretch(es) from residues 1–9 (and 40–50) using two residues of ε‐amino hexanoic acid have been shown to inhibit both Gyrase‐mediated supercoiling and Topoisomerase IV‐mediated relaxation in vitro, though no in vivo growth inhibition or therapeutic efficacy studies were performed (Trovatti et al, 2008). In the present work which builds on this published study, the crucial Gyrase‐binding C‐terminal helix of CcdB (residues 86–101) (Dao‐Thi et al, 2005; Aghera et al, 2020) was utilised to engineer a novel 24‐mer peptide which showed improved in vivo efficacies compared to ciprofloxacin (a widely used second‐generation fluoroquinolone), against a carbapenem‐resistant MDR strain of A. baumannii, S. Typhimurium and S. aureus, when tested in murine models. In addition, there was a significant absence of toxicity (even at a substantially high dose of 100 mg/kg) observed in the animals. Biochemical studies confirmed that inhibition of the catalytic activities of the Type II topoisomerases was likely responsible for the peptide‐mediated antibacterial action. In summary, this study reports the discovery of a short broad‐spectrum antibacterial peptide designed from a naturally available proteinaceous scaffold and validates the CcdB binding site for targeting DNA Gyrase, thereby providing alternative platforms and strategies for the design of novel antibacterial agents to address the issue of fluoroquinolone‐induced AMR.
Results
Design of CcdB‐derived Gyrase A binding peptides
The crystal structure of a 59 kDa fragment of the Gyrase A subunit isolated from E. coli (PDB ID: 1AB4) (Morais Cabral et al, 1997) shows that the binding pockets for quinolones (Quinolone Resistance Determining Region – QRDR from residues 67–106; Komp Lindgren et al, 2003; Tchesnokova et al, 2019) and CcdB protein (from residues 368–474) (Dao‐Thi et al, 2005) on the enzyme are far apart (Fig 1A). The CcdB‐Gyrase A14 complex isolated from E. coli (PDB ID: 1X75; Dao‐Thi et al, 2005) shows that the C‐terminal helix (residues 86–101) of CcdB is crucial for binding, with W99 and G100 forming critical interactions with R462 in Gyrase A14 (Smith & Maxwell, 2006; Aghera et al, 2020) (Fig 1B). We utilised this helical region to design a parent peptide with the wild‐type sequence (WT peptide). MALDI‐MS and RP‐HPLC confirmed the successful synthesis of the WT peptide (Appendix Fig S1A, Appendix Table S1). The WT peptide showed no growth inhibition of E. coli (Fig EV1A) despite its promising in vitro Gyrase A14‐binding affinity (Fig 1C and D).
Figure 1. Crystal structures of Gyrase A59 and CcdB‐Gyrase A14 complex isolated from E. coli and biophysical characterisation of CcdB‐derived peptides.

- Gyrase A59 dimeric structure (PDB ID: 1AB4) with the two chains highlighted in light and dark grey, the quinolone resistance determining region (QRDR) shown in green and the CcdB interacting region shown in magenta.
- CcdB‐Gyrase A14 structure (PDB ID: 1X75) with CcdB in brown and Gyrase A14 in grey. The C‐terminal Gyrase‐binding helix (residues 86–101) of CcdB is shown in yellow, and the inset shows an enlarged view of this region. R462 (in green) in Gyrase A14, a critical CcdB‐binding residue, is involved in interactions with W99 (in red) and G100 (in cyan) in CcdB (Aghera et al, 2020).
- SPR traces indicate competition between the WT peptide and the full‐length CcdB protein (immobilised target) for binding to Gyrase A14.
- Microscale thermophoresis (MST) curves for binding of peptides to labelled Gyrase A14. The circles indicate the experimental values, and the solid lines indicate the fitted fluorescence values obtained upon analysis using the MO.Affinity Analysis software (version 2.2.5, NanoTemper Technologies).
Data information: In both panels (C and D), data are obtained from n = 3 biological replicates; wherein for each biological replicate, the experiment is performed in duplicates (technical duplicates for each biological replicate). In panel (C), each of the traces (obtained at varying WT peptide concentrations) are averaged across all the replicates and plotted. Individual data points are not shown for SPR data as is customary. In panel (D), the data are presented as mean ± SD values obtained from all the replicates.
Figure EV1. Growth curves of E. coli Top10 treated with the peptides indicated in the panels.
- Growth inhibition was not observed for the WT peptide lacking a cell‐permeable stretch.
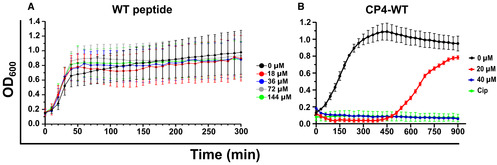
- Growth profile of E. coli Top10 cells in the presence of CP4‐WT peptide containing the cell‐permeable CP4 stretch.
Data information: Cip – 10 μg/ml ciprofloxacin (positive control). n = 3 biological replicates; wherein for each biological replicate, the experiment is performed in duplicates (technical duplicates for each biological replicate). Across all the replicates, data are averaged and presented as mean ± SD values.
We used surface plasmon resonance (SPR) to compare affinities of the full‐length CcdB protein and the short WT peptide to bind to Gyrase. Upon addition of pre‐formed peptide‐Gyrase A14 complexes to the immobilised CcdB protein, we observed sequential drops in the binding signal (observed at the end of the association timescale of 100 s) as the peptide concentrations were increased, which indicated that the WT peptide competed effectively with the full‐length protein for binding to Gyrase A14 (Fig 1C). Microscale thermophoresis (MST) experiments showed that the WT peptide bound to Gyrase A14 with a K D of ~51 nM (Fig 1D), five folds higher than the K D reported for the CcdB protein‐Gyrase A14 complex (De Jonge et al, 2009).
Screening of peptides attached with cell‐permeable sequences identifies a lead peptide with enhanced cellular uptake and bactericidal action
As the WT peptide failed to show any antibacterial action on E. coli growth (Fig EV1A), we attempted to develop peptides with enhanced cell permeation abilities. We synthesised eight stretches, each being eight amino acids long and containing alternating hydrophobic (cyclohexylalanine/phenylalanine/2‐naphthylalanine/tryptophan) and cationic (D‐arginine) residues (Appendix Table S2), (Lei et al, 2013), and measured the extent of cellular uptake in each case. To measure the extent of cellular uptake of these peptides, a FAM fluorophore was attached at the N‐termini of each peptide and fluorescence levels of E. coli cells incubated with these FAM‐labelled peptides were monitored using flow cytometry. The guanidinium group of arginine forms bidentate hydrogen‐bonds with the anionic groups of phosphates, carboxylates and/or sulphates on the cellular membrane, whereas the hydrophobic residues interact with the lipophilic groups on the membrane (Lei et al, 2013; Stanzl et al, 2013). A balance between the two parameters, namely charge and hydrophobicity, allows for the efficient cellular uptake and penetration into the cellular membranes, respectively by the peptide. As the cell‐penetrating ability is retained despite the change in the natural stereochemistry of the arginine residues (Stanzl et al, 2013), their D‐amino acid analogues were incorporated to prevent proteolytic degradation (Khatri et al, 2019). Two of the eight stretches, namely CP1 and CP4, conferred the highest cellular uptake (Fig 2A) and were attached to the N‐terminus of the WT peptide. MALDI‐MS and RP‐HPLC confirmed the successful synthesis of these peptides (Appendix Fig S1A and B, Appendix Table S1). Both the engineered peptides, namely CP1‐WT and CP4‐WT (Appendix Table S1), showed effective cell growth inhibition in E. coli, with the CP1 stretch performing better than CP4 (Figs 2B and EV1B). In the context of full‐length CcdB protein, a double mutant with two mutations at Gyrase‐binding residues, namely W99A and G100T, was inactive (Adkar et al, 2012; Tripathi et al, 2016). Therefore, as a negative control, we synthesised a mutant peptide, CP1‐Mut, containing the CP1 stretch attached to a double mutant peptide containing the above two mutations at the Gyrase‐binding residues. MALDI‐MS and RP‐HPLC analyses confirmed the successful synthesis of the CP1‐Mut peptide (Appendix Fig S1A and C, Appendix Table S1). As expected, the CP1‐Mut peptide did not inhibit cell growth in E. coli (Fig 2B, Appendix Fig S2A and B). Ciprofloxacin (a second‐generation fluoroquinolone with Gyrase‐inhibition properties) was used as the positive control and showed complete growth inhibition (Fig 2B, Appendix Fig S2B). For utilising the CP1‐WT and CP1‐Mut peptides in confocal microscopy experiments, FAM fluorophores were tagged at their respective N‐termini to form FAM‐CP1‐WT and FAM‐CP1‐Mut peptides respectively (Appendix Fig S1A, D and E). The HPLC profiles and the mass spectra provided are qualitative representative images (Appendix Fig S1). Separate quantitative profiles were used to estimate the exact peptide concentrations, which were finally used in the assays throughout the paper.
Figure 2. Cellular uptake of FAM‐conjugated amino acid stretches and in vitro bactericidal action of the lead peptide CP1‐WT in E. coli cells.

-
AFlow cytometry was used to measure the uptake (dictated by cellular fluorescence) of varying concentrations of different FAM‐conjugated peptide stretches in E. coli cells. CP1 stretch shows highest cellular uptake and is attached to the WT peptide scaffold to create the CP1‐WT peptide which is the lead peptide used in subsequent studies.
-
B, CIn vitro bactericidal action of the CP1‐WT peptide on E. coli Top10 cells.
-
BGrowth profile of E. coli Top10 in the presence of increasing concentrations of the CP1‐WT peptide.
-
CEstimation of Minimum Inhibitory Concentration (MIC), indicated in terms of OD600, and Minimum Bactericidal Dose (MBD), indicated in terms of CFU/ml, show that the CP1‐WT peptide has similar MIC and MBD values of 40 μM (~130 μg/ml).
-
DPeptide‐induced membrane damage in E. coli Top10 estimated by propidium iodide uptake using flow cytometry.
-
ESPR traces showing binding of the CP1‐WT peptide (tagged with biotin for immobilisation to streptavidin‐based chip) to ParC subunit of Topoisomerase IV enzyme.
Data information: In each of the panels (A–E), data are obtained from n = 3 biological replicates; wherein for each biological replicate, the experiment is performed in duplicates (technical duplicates for each biological replicate). In panels (A and D), for each biological replicate, across their technical duplicates, data are averaged and presented as mean ± SD fluorescence values (measure of peptide uptake) and mean ± SD percentage of propidium iodide uptake (% PI uptake), respectively. In panels (B and C), data are presented as mean ± SD values obtained from all the replicates. In panel (E), the K D value presented is the mean ± SD value across all the replicates, and each of the traces (obtained at varying ParC concentrations) is averaged across all the replicates and plotted. In panel (B), N.T. – No treatment; 4.5% DMSO (solvent control); CP1‐WT (test peptide); CP1‐Mut (negative control peptide) and Cip – 10 μg/ml ciprofloxacin (positive control). *P < 0.05; **P < 0.01; ****P < 0.0001; Student's unpaired t‐test.
In addition to the CcdB‐sensitive E. coli Top10 strain, in vitro studies on the CcdB‐resistant E. coli Top10Gyrase A strain, harbouring a CcdB‐resistant Gyrase A mutation (R462C) (Bernard & Couturier, 1992), were also carried out for the designed peptides. Growth inhibition was observed in Top10Gyrase A for the CP1‐WT and CP4‐WT peptides (Appendix Fig S2C). The minimum inhibitory concentrations (MIC) and minimum bactericidal doses (MBD) determined using liquid broth and agar, respectively, were 40 μM for CP1‐WT (Fig 2C). Propidium iodide, a membrane‐impermeant DNA‐binding dye, is selectively excluded by the viable cells and stains membrane‐compromised and/or dead cells. We studied the uptake of this vital stain by E. coli cells treated with the CP1‐WT peptide utilising flow cytometry. A positive correlation was noted between the peptide dosage and the extent of dye uptake, with ~80% of propidium iodide uptake being observed at a low peptide concentration of 20 μM (Fig 2D, Appendix Fig S3A and B), indicative of substantial cell‐membrane damage induced by the peptide in E. coli. Relative to the action of the CP1‐WT peptide (20 μM) on E. coli Top10 strain, a moderate level of membrane damage was also observed in the CcdB‐resistant strain, Top10Gyrase A (Appendix Fig S3B). Since the R462C mutation in Gyrase A renders the enzyme inactive towards full‐length CcdB protein, it was expected that the same substitution should render the enzyme resistant to the CcdB‐derived CP1‐WT peptide also. However, despite the presence of the R462C resistance mutation in E. coli Top10Gyrase A, the strain still showed moderate membrane damage (Appendix Fig S3B) and growth inhibition (Appendix Fig S3C) in the presence of CP1‐WT, which indicates that in addition to Gyrase, Topoisomerase IV is likely an additional target of the peptide in E. coli. Microscale thermophoresis experiments revealed that the CP1‐WT peptide bound tightly to E. coli Gyrase A14 (K D ~5.2 nM) (Fig 1D), ~ two folds higher than that reported for full‐length CcdB protein (K D ~10 nM) (De Jonge et al, 2009). To further support the assertion that Topoisomerase IV is an additional target, surface plasmon resonance was used to estimate the binding affinity of the peptide to the purified E. coli ParC subunit of the Topoisomerase IV enzyme. The peptide bound to ParC with a K D of ~1 nM (Fig 2E), which was similar to the peptide‐Gyrase A14 binding affinity (K D ~5 nM) and this observation further supported the dual targeting of Gyrase A and Topoisomerase IV by the CP1‐WT peptide. In subsequent studies, the CP1‐WT peptide was used as the test peptide, and CP1‐Mut peptide and ciprofloxacin were used as negative and positive controls, respectively, to study peptide‐induced growth inhibition of pathogenic strains.
The CP1‐WT peptide induces membrane damage and causes growth inhibition of Salmonella Typhimurium, Staphylococcus aureus and a carbapenem‐resistant MDR clinical isolate of Acinetobacter baumannii
With the exception of S. aureus (PDB ID: 2XCO), there are no structures of Gyrase A subunit enzymes from pathogenic bacterial strains. Hence, we performed multiple sequence alignment (MSA) of the Gyrase A14 fragment isolated from E. coli with the corresponding enzyme fragments from S. Typhimurium, P. aeruginosa, A. baumannii and S. aureus. Most of the Gyrase residues involved in E. coli CcdB:Gyrase A14 interactions (Aghera et al, 2020) remained similar or identical throughout the alignment, with the critical R462 in the enzyme remaining conserved across all the organisms (Fig EV2A), and with > 50% sequence identity observed with the E. coli Gyrase A14 fragment (Table 1). Topoisomerase IV (Topo IV), another Type II topoisomerase acting on DNA topoisomers distinct from the substrates required for the Gyrase enzyme, is the secondary target in Gram‐negative bacteria and primary target in Gram‐positive bacteria for fluoroquinolone drugs (Aldred et al, 2014). Using E. coli ParC subunit of Topoisomerase IV (involved in quinolone‐binding) as the query sequence, > 58% sequence similarity was observed across all the tested gram‐negative strains and only ~33% sequence similarity was observed with S. aureus (gram‐positive strain) (Table 2). A sequence alignment of the E. coli Gyrase A14 fragment and the ParC subunit identified 10 ParC residues (Fig EV2B), which remained similar or identical to the critical Gyrase residues involved in CcdB‐binding (Fig EV2C) and were presumed to participate in binding to the CP1‐WT peptide. All 10 putative CcdB‐interacting Topoisomerase IV residues remained conserved throughout the sequence alignment of the three gram‐negative strains, and six residues were conserved between E. coli and S. aureus sequences (Fig EV2B). Based on these observations, the CP1‐WT peptide was further investigated for its antibacterial efficacy against these pathogens.
Figure EV2. Multiple sequence alignment (MSA) of sequences of subunits of Gyrase and Topoisomerase IV isolated from E. coli and the pathogenic strains used in the study.

-
A, BMSA of (A) Gyrase A14 sequences and (B) ParC sequences from E. coli (ECOLI), S. Typhimurium (SALTY), P. aeruginosa (PSEAE/PSEAI), A. baumannii (ACIBA) and S. aureus (STAAU).
-
CAlignment of Gyrase A14 and ParC sequences from E. coli. Ten residues in the E. coli Gyrase A14 sequence were previously identified as CcdB‐binding residues (Aghera et al, 2020), of which seven residues remained conserved (black arrows) and three residues remained similar (blue arrows) upon alignment with E. coli ParC sequence.
Table 1.
Identity matrix for select bacterial Gyrase A sequences from E. coli and pathogenic strains.
| Strain | Gyrase A sequence identity (%) | ||||
|---|---|---|---|---|---|
| EC | SA | STM | PA | AB | |
| E. coli (EC) | 100.0 | 53.1 | 92.4 | 66.4 | 56.7 |
| Staphylococcus aureus (SA) | 53.1 | 100.0 | 54.1 | 53.1 | 54.8 |
| Salmonella Typhimurium (STM) | 92.4 | 54.1 | 100.0 | 64.9 | 55.1 |
| Pseudomonas aeruginosa (PA) | 66.4 | 53.1 | 64.9 | 100.0 | 60.6 |
| Acinetobacter baumannii (AB) | 56.7 | 54.8 | 55.1 | 60.6 | 100.0 |
Table 2.
Identity matrix for select Topoisomerase IV sequences from E. coli and pathogenic strains.
| Strain | Topo IV sequence identity (%) | ||||
|---|---|---|---|---|---|
| EC | SA | STM | PA | AB | |
| E. coli (EC) | 100.0 | 32.7 | 95.1 | 67.5 | 58.4 |
| Staphylococcus aureus (SA) | 32.7 | 100.0 | 32.7 | 31.6 | 32.9 |
| Salmonella Typhimurium (STM) | 95.1 | 32.7 | 100.0 | 67.1 | 58.9 |
| Pseudomonas aeruginosa (PA) | 67.5 | 31.6 | 67.1 | 100.0 | 58.4 |
| Acinetobacter baumannii (AB) | 58.4 | 32.9 | 58.9 | 58.4 | 100.0 |
We used propidium iodide to study peptide‐induced membrane damage in the pathogenic strains by confocal microscopy. In the presence of the CP1‐WT peptide, S. Typhimurium showed moderate membrane damage with ~23% dye uptake (Fig 3A). The most significant membrane disruption in the presence of the CP1‐WT (~98% dye uptake) was observed in the case of the MDR strain of A. baumannii, relative to CP1‐Mut (control peptide) which showed only mild damage (~12% dye uptake) (Fig 3B). Relative to CP1‐Mut, the gram‐positive S. aureus strain showed complete membrane damage (~100%) and P. aeruginosa showed moderate damage (~30% dye uptake) in the presence of the CP1‐WT peptide (Fig 3C and D). In all three gram‐negative strains, negligible membrane damage (≤ 4%) was observed when the cells were treated with the organic solvent, DMSO, which was used for peptide‐solubilisation (Fig 3A, B and D). However, significant solvent‐induced membrane damage was observed (~58% dye uptake) in S. aureus (Fig 3C), in accordance with previous reports on DMSO‐induced membrane porosity in this organism (Ghajar & Harmon, 1968). Upon treatment of S. aureus with the CP1‐WT peptide, a 40% enhancement in the extent of dye uptake relative to that for DMSO was observed (Fig 3C).
Figure 3. The CP1‐WT peptide causes membrane damage and shows bactericidal action on stationary phase cells of Salmonella Typhimurium, Staphylococcus aureus and a carbapenem‐resistant MDR strain of Acinetobacter baumannii .

-
A–DPeptide‐induced membrane damage was studied by confocal microscopy and measured by propidium iodide (PI) influx (% PI uptake) in (A) S. Typhimurium, (B) A. baumannii, (C) S. aureus and (D) P. aeruginosa.
-
E–HMinimum Inhibitory Concentration (MIC) and Minimum Bactericidal Dose (MBD) estimation of CP1‐WT on stationary phase cells of (E) S. Typhimurium, (F) A. baumannii, (G) S. aureus and (H) P. aeruginosa. No bactericidal action is observed for P. aeruginosa. In each of the panels and its corresponding bar graph, the black lines and black bars represent the MIC data indicated by their OD600 values, and the red lines and red bars represent the MBD data indicated by their CFU/ml values. The bar graphs in each panel depict control reactions used for each strain where the cells were treated with DMSO, peptides and ciprofloxacin (Cip – positive control; 10 μg/ml). The strain of A. baumannii used was reported to be ciprofloxacin‐resistant (Nagarajan et al, 2018) as is observed here (inset in panel F).
Data information: In panels (A–D), n = 5 biological replicates; scale bars: 5 μm. Representative images are shown. In the bar graphs, data are presented as mean ± SD values of percentage of propidium iodide uptake (% PI uptake), averaged across all the replicates. 3, 7, 8 and 3% DMSO, and 80, 50, 50 and 80 μM of the peptides in the respective DMSO concentrations were used to treat S. Typhimurium, A. baumannii, S. aureus and P. aeruginosa respectively. In panels (E–H), n = 5 biological replicates. Data are presented as mean ± SD values, averaged across all the replicates. For the bar graphs in these panels, 7, 13, 8 and 4% DMSO, and 80, 100, 100 and 50 μM of the peptides were used for S. Typhimurium, A. baumannii, S. aureus and P. aeruginosa respectively. N.T. – No treatment; WT – CP1‐WT peptide; Mut – CP1‐Mut peptide (negative control). P‐values are calculated by Student's unpaired t‐test; ns P > 0.05; ***P < 0.001; ****P < 0.0001.
We next determined the minimum inhibitory concentrations (MIC) and minimum bactericidal dose (MBD) values for the CP1‐WT peptide against these organisms. For S. Typhimurium, an MDR strain of A. baumannii and S. aureus, an MIC value of 40 μM and an MBD value of 80 μM were observed across all the three strains (Fig 3E–G). In contrast, the growth of P. aeruginosa remained uninhibited up to the highest peptide concentration of 120 μM used in the assay (Fig 3H), despite mild peptide‐induced membrane damage being observed (Fig 3D). As pilot experiments, we measured the extents of DMSO tolerance and the actions of CP1‐Mut peptide (negative control) on all the pathogenic strains by performing growth assays in liquid and agar media. Some inhibition was observed at DMSO concentrations ranging from 4 to 10% (Appendix Fig S4A–D). The control peptide, CP1‐Mut (in 7–13% DMSO depending on the strain used), did not show growth inhibition, and ciprofloxacin (positive control) showed complete growth inhibition in S. Typhimurium, P. aeruginosa and S. aureus (the bar graphs in Fig 3E, G and H). The growth of A. baumannii was not inhibited in the presence of ciprofloxacin (the bar graph in Fig 3F) as this is an MDR strain (strain ID: P1270), previously reported to be resistant to the action of ciprofloxacin (Nagarajan et al, 2018).
CP1‐WT causes morphological changes of the cellular membrane, is internalised and localises throughout the cytosol of the bacterial cell
Morphological changes in the cellular membrane of bacteria infected with E. coli, S. Typhimurium, A. baumannii (P1270 strain) and S. aureus were examined in the presence and absence of the peptides using transmission electron microscopy. As the peptide treatment time increased from one to 3 h, the appearance of cell death markers, namely membrane blebs, generalised membrane damage and exclusion of cytoplasmic contents out of the cells, became more prominent in the CP1‐WT treated cells across E. coli and all the pathogenic bacteria (Fig 4A–D). The morphologies of the CP1‐Mut treated cells (containing inactive CcdB peptide), used as negative controls, resembled that of the untreated cells, across E. coli and all the pathogenic bacteria (Fig 4A–D).
Figure 4. The CP1‐WT peptide causes membrane damage leading to the appearance of cell death markers and internalises in the cytosol of the bacteria.

-
A–DTransmission electron micrographs of the indicated bacterial strains (left) depicting the loss of membrane integrity upon treatment with the CP1‐WT peptide which is time‐dependent. Arrows indicate membrane blebs, generalised membrane damage and the exclusion of cytoplasmic contents out of the cell. One, two and three hours indicate different treatment times of 1, 2 and 3 h respectively with the CP1‐WT and CP1‐Mut peptides as indicated in the panels. Untreated cells, used as controls, are also shown. Scale bars: 2 μm.
-
E–HMean fluorescence intensities across the three fluorescent channels (FM 4‐64FX, FAM and DAPI fluorophores) were estimated from confocal microscopy experiments to understand if the peptide was bound to the membrane or internalised in the cytosol of the bacteria indicated in each of the panels (top). Triple staining procedure with FM 4‐64FX (membrane‐binding dye; red), FAM‐conjugated peptides (green) and DAPI (nuclear staining dye; blue) was used and the mean fluorescence intensities across these three fluorescent channels were calculated using ZEN 2.3 software. The bacterial cells were treated with 2% DMSO/ FAM‐labelled CP1‐WT/FAM‐labelled CP1‐Mut for 0 (0 h) or 2 h (2 h), followed by staining with FM 4‐64FX and DAPI consecutively. The 0th hour data represents the data obtained after immediate addition of DMSO or peptide. In each panel, green circles represent autofluorescence (cells emitting light of wavelength corresponding to that observed for FAM fluorophore) of DMSO‐treated cells at 0 and 2 h.
Data information: In panels (E–H), n = 5 biological replicates are used. In each of these panels, the mean ± SD intensity values (averaged across all the replicates) obtained across each fluorescent channel (FM 4‐64FX, FAM and DAPI) are presented for a particular bacterial strain (indicated on top of the panel). In each panel, across each fluorescent channel, the unstriped and striped bars indicate the data for cells treated with DMSO or peptides for 0 (immediate addition) and 2 h respectively. ns P >0.05, *P < 0.05, **P < 0.01; Student's unpaired t‐test. WT and Mut indicate CP1‐WT and CP1‐Mut treatments respectively.
Triple staining with FAM (labelled at the N‐terminal of the peptide), FM 4‐64FX (membrane‐staining dye) and DAPI (DNA‐staining dye) was used to examine peptide uptake and possible interactions with chromosomal DNA in E. coli, S. Typhimurium, A. baumannii (P1270 strain) and S. aureus using confocal microscopy. Immediately after staining (T = 0 h; Fig EV3A–D), the CP1‐WT peptide (used at its MIC values in the corresponding bacterial strains) completely internalised and was uniformly localised throughout the cytosol in all the cases (FAM channel in Figs 4E–H and EV3A–D), indicating rapid binding and entry into the cell membranes. Cell clumping was also visually observed in all the cases. Upon peptide treatment of the cells for 2 h, increases in fluorescence intensities across the FAM channel were observed for all the strains (relative to the values obtained for CP1‐WT at T = 0 h) indicative of enhanced internalisation within the cytosol (Figs 4E–H and EV4A–D). Upon introducing double mutations in the CP1‐Mut peptide (W99A and G100T substitutions), moderate reductions in cellular uptake (FAM channel) were observed relative to the CP1‐WT peptide, albeit with low statistical significance (Figs 4E–H, EV3 and EV4). In the presence of the solvent control, DMSO (2% for E. coli and 4% DMSO for pathogens), cells remained healthy as FM 4‐64FX and DAPI could effectively stain the membranes and nucleic acids respectively (Appendix Fig S5A–D). As a control experiment to check if the addition of FAM fluorophore caused any changes on the antibacterial properties of the peptides, the MIC values of the two FAM‐labelled CP1‐WT and CP1‐Mut peptides were determined in all the bacterial strains. As expected, across E. coli, S. Typhimurium, A. baumannii and S. aureus, the MIC values of FAM‐CP1‐WT (40 μM) were very similar to that obtained for the unlabelled CP1‐WT (Appendix Fig S6A–D). In all the strains, the FAM‐CP1‐Mut peptide continued to grow till 80 μM, similar to that observed for the unlabelled CP1‐Mut peptide (Appendix Fig S6A–D). The unchanged MIC values of the peptides upon FAM labelling confirmed that all the observations seen during the confocal microscopy experiments were due to the cytosolic localisation of the CP1‐WT peptide stretch itself.
Figure EV3. Confocal images taken shortly after peptide addition demonstrate that the CP1‐WT peptide rapidly and uniformly localises throughout the cytosol of the bacteria.

-
A–DConfocal microscopy was used to visualise if the peptide was bound to the membrane or internalised in the cytosol, immediately after its addition to bacterial cells, using triple staining procedure with FM 4‐64FX (membrane‐binding dye; red), FAM‐conjugated peptides (green) and DAPI (nuclear staining dye; blue) in (A) E. coli (EC), (B) S. Typhimurium (STM), (C) MDR strain of A. baumannii (AB) and (D) S. aureus (SA). Relative to the CP1‐WT peptide (WT), the control CP1‐Mut peptide (Mut) showed decreased membrane‐binding and cellular uptake.
Data information: n = 5 biological replicates were used. Representative images are shown for T = 0 h, when the peptide was just added to the cells and slides were prepared for microscopy. Scale bars: 5 μm.
Figure EV4. Confocal images of E. coli and various pathogenic strains taken 2 h after peptide addition.

-
A–DPost treatment of the bacterial cells with the peptide for two hours, confocal microscopy was used to visualise if the peptide was bound to the membrane or internalised in the cytosol using triple staining procedure with FM 4‐64FX (membrane‐binding dye; red), FAM‐conjugated peptides (green) and DAPI (nuclear staining dye; blue) in (A) E. coli (EC), (B) S. Typhimurium (STM), (C) MDR strain of A. baumannii (AB) and (D) S. aureus (SA). Relative to the CP1‐WT peptide (WT), the control CP1‐Mut peptide (Mut) showed decreased membrane‐binding and cellular uptake.
Data information: n = 5 biological replicates were used. Representative images are shown for T = 2 h, when the peptide was added to the cells and incubated for 2 h, followed by preparation of slides for microscopy. Scale bars: 5 μm.
The CP1‐WT peptide acts as a Type II topoisomerase inhibitor and induces reversible DNA aggregation beyond a threshold concentration
In order to investigate the exact molecular targets responsible for the antibacterial action of the CP1‐WT peptide, its action on Gyrase‐mediated supercoiling and Topoisomerase IV‐mediated relaxation and decatenation were assayed for both the enzymes isolated from E. coli and the pathogens. The precise assays used were dependent on the commercial availability of the corresponding kits. The peptide showed dose‐dependent inhibition of the topoisomerase II enzyme (either Gyrase or Topoisomerase IV) depending on the bacterial strain used, except for S. Typhimurium (Table 3). Similar to the observations in the previous study on a CcdB‐based inhibitor peptide (Trovatti et al, 2008), the CP1‐WT peptide primarily inhibited the relaxation activity of E. coli Topoisomerase IV with an IC50 of 13.5 μM (Figs 5A and EV5A and B). For A. baumannii and the gram‐positive S. aureus, the CP1‐WT peptide primarily inhibited the decatenation and relaxation activities of their corresponding Topoisomerase IV enzymes with IC50 values of 15.5 and 12 μM respectively (Figs 5A and EV5C–F). No inhibition of supercoiling was observed for the action of CP1‐WT on S. Typhimurium Gyrase (Fig EV5G). For P. aeruginosa Gyrase, the CP1‐WT peptide did not show any action on its supercoiling even at 100 μM dosage (Fig EV5H), which was in accordance with its inability to cause growth inhibition in this pathogen (Fig 3H). In all cases where enzymes isolated from E. coli or the pathogens were incubated in the presence of the CP1‐WT peptide, topoisomerase‐inhibition was observed till a threshold peptide concentration. Beyond a threshold peptide concentration of 20–25 μM, DNA aggregation was induced both in the absence (Table 4, Appendix Fig S7A–C) and presence of enzymes (no bands observed on the gel; Fig EV5A, C and G), which was reversed by lowering the peptide concentration (Appendix Fig S7D). As the reaction mixtures containing peptide doses > 20 μM contained DNA in the aggregated form, no PCR amplification was observed in these samples (40 and 80 μM undiluted samples in Appendix Fig S7D). Upon 4‐fold dilution, the aggregated DNA present in reaction mixtures containing peptide doses > 20 μM was recovered, as evident from its PCR amplification in the diluted reaction mixtures (Appendix Fig S7D). Ethidium bromide fluorescence of the reaction mixtures containing plasmid DNA and varying peptide concentrations also indicated a decrease in the amount of DNA in solution at peptide concentrations > 20 μM (Appendix Fig S7E). Thus, upon peptide treatment, DNA aggregation occurs, but not DNA degradation, as the degraded DNA would not be recoverable by dilution as indicated above. Furthermore, similar results were obtained even after subjecting the peptide to heat treatment, ruling out protease and nuclease contaminations in the samples.
Table 3.
Effect of peptides and ciprofloxacin on the enzymatic activity of select Type II topoisomerases (Gyrase or Topoisomerase IV).
| Enzymatic assay | Peptide or antibiotic | |||
|---|---|---|---|---|
| CP1‐WT peptide (< 20 μM) | IC50 (μM) of CP1‐WT | CP1‐Mut peptide | Ciprofloxacin | |
| E. coli Topo IV relaxation inhibition (Fig EV5A) | + | 13.5 | − | + |
| A. baumannii Topo IV decatenation inhibition (Fig EV5C) | + | 15.5 | − | + |
| S. aureus Topo IV relaxation inhibition (Fig EV5E) | + (till 25 μM) | 12.0 | − (Fig EV5F) | + (Fig EV5F) |
| S. Typhimurium Gyrase supercoiling (Fig EV5G) | − | N.D. | − | + |
| P. aeruginosa Gyrase supercoiling (Fig EV5H) | − | N.D. | ‐ | + |
“+” and “−” denote the presence and absence of enzymatic inhibition, respectively, of by the peptide or ciprofloxacin. N.D. – not determined.
Figure 5. The CP1‐WT peptide shows negligible in vivo toxicity.

-
A–CIn vivo toxicity determination of the CP1‐WT peptide using a murine model. BALB/c mice (five mice per cohort) were intraperitoneally injected with 1.6% DMSO or varying peptide doses as indicated and monitored for 14 days.
-
AChanges in body weights relative to day 0 were noted. The mean percentage changes in body weights for each cohort are plotted across all the days.
-
B, CAfter 14 days post‐peptide treatment, blood was collected from the animals by retro‐orbital puncture and analysed for (B) alanine transaminase (SGPT), alanine aminotransferase (SGOT), alkaline phosphatase (ALP) and (C) creatinine and blood urea nitrogen (BUN) levels. Relative to the values obtained for the DMSO cohort, insignificant changes in serum levels of these parameters indicate that the peptide shows no significant hepatotoxic (as seen in panel B) or nephrotoxic effects (as seen in panel C).
Data information: In panels (A–C), n = 2 biological replicates with five mice per cohort were used. In panel (A), across the entire experimental tenure of 14 days, data are presented as mean ± SD values for each cohort, averaged across both the replicates for all the five mice (studied in the respective cohort). In both the panels (B and C), representative data for only one biological replicate across all the cohorts (five mice per cohort) are presented as mean ± SD values. In panel (A), multiple t‐test with Bonferroni Dunn correction was used to compare percentage change in body weights across DMSO‐treated and the respective peptide treated cohorts (ns P > 0.05). For panels (B and C), P‐values were calculated in comparison to the DMSO‐treated cohorts using Mann–Whitney rank sum test (ns P > 0.05).
Figure EV5. Effect of the CP1‐WT peptide on in vitro activity of Gyrase and Topoisomerase IV from various bacteria (reference for Tables 3 and 4).
-
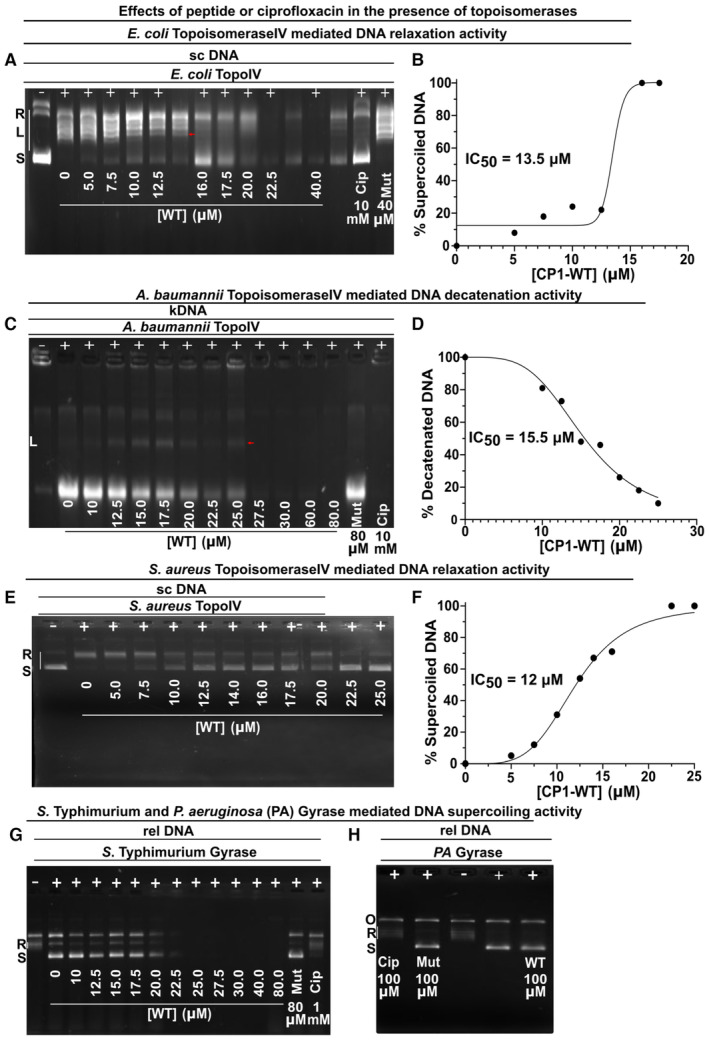
A–HEffect of peptides or ciprofloxacin on in vitro activity of Gyrase and Topoisomerase IV isolated from E. coli and various pathogens.
-
AEffect of peptides or ciprofloxacin on inhibition of E. coli Topoisomerase IV‐mediated relaxation of 200 ng supercoiled DNA.
-
BIC50 estimation of the CP1‐WT peptide on the relaxation activity of E. coli Topoisomerase IV.
-
CEffect of peptides or ciprofloxacin on A. baumannii Topoisomerase IV‐mediated decatenation of 300 ng kinetoplast catenated DNA.
-
DIC50 estimation of the CP1‐WT peptide on the decatenation activity of A. baumannii Topoisomerase IV.
-
EEffect of peptides or ciprofloxacin on S. aureus Topoisomerase IV‐mediated relaxation of 200 ng supercoiled DNA. Control data with mutant peptide and ciprofloxacin are shown in Appendix Fig S7J.
-
FIC50 estimation of the CP1‐WT peptide on the relaxation activity of S. aureus Topoisomerase IV.
-
GEffect of peptides or ciprofloxacin on S. Typhimurium Gyrase‐mediated supercoiling of 200 ng relaxed DNA. Peptides failed to inhibit Gyrase‐mediated DNA supercoiling.
-
HEffect of peptides or ciprofloxacin on P. aeruginosa (PA) Gyrase‐mediated supercoiling of 200 ng relaxed DNA. Peptides failed to inhibit Gyrase‐mediated DNA supercoiling.
Data information: In (A, C, E), 1 unit of Topoisomerase IV and (G, H) 2 units of Gyrase were used. N.T. – No treatment; WT – CP1‐WT; Mut – CP1‐Mut; Cip – ciprofloxacin; rel DNA – relaxed DNA; sc DNA – supercoiled DNA; kDNA – kinetoplast catenated DNA. In the gels, “+” and “−” denote the presence and absence of the enzyme (indicated above these symbols in each of the gels), respectively, and “R,” “L” and “S” denote relaxed (white bars beside “R” show the relaxed topoisomeric forms of the substrate DNA), linear and supercoiled forms of the DNA respectively present in the reaction mixture used in each of the lanes in a particular gel image. In panels A and C, the presence of linear DNA (indicated by red arrow) is observed due to the formation of ternary cleavage complex. n = 5 biological replicates for all the reactions, and representative images are shown in the figure.
Table 4.
Action of peptides and ciprofloxacin on various DNA substrates in the absence of Type II topoisomerases.
| Peptide or antibiotic | Absence of topoisomerases | ||
|---|---|---|---|
| Supercoiled DNA (Appendix Fig S7A) | Relaxed DNA (Appendix Fig S7B) | Catenated DNA (Appendix Fig S7C) | |
| CP1‐WT peptide (≤ 20 μM) | N.D. | + | + |
| CP1‐WT peptide (> 20 μM) | − | − | − |
| CP1‐Mut peptide | + | + | + |
| Ciprofloxacin | + | + | + |
“+” and “−” denote the presence and absence, respectively, of the intact DNA topoisomer substrate as detected on the agarose gel (Appendix Fig S7A–C). N.D. – not determined.
For E. coli Gyrase, the peptide acted similarly to the full‐length CcdB protein (Appendix Fig S7F and G), with appearance of relaxed topoisomers, but not complete inhibition of supercoiling. Consistent with the data for the peptide, in the case of full‐length CcdB also, significant supercoiling inhibition was observed only at a high concentration of ~2 μM CcdB (Appendix Fig S7G). For A. baumannii, CP1‐WT did not show any significant action on Gyrase‐mediated supercoiling up to a concentration of 20 μM (Appendix Fig S7H). In the case of S. aureus, the CP1‐WT peptide showed less effect on the decatenation activity, relative to the relaxation activity of Topoisomerase IV (Appendix Fig S7I and J). Accurate estimation of IC50 for S. aureus Topoisomerase IV inhibition of decatenation activity was not possible due to inconsistencies in the intensities of the decatenated DNA bands at some intermediate concentrations lesser than 20 μM (Appendix Fig S7I). No inhibition of supercoiling was observed for the action of CP1‐WT on S. aureus DNA Gyrase (Appendix Fig S7K). In all these enzymatic assays, it was not possible to estimate IC50 values > 20 μM due to peptide‐mediated DNA aggregation at such peptide concentrations (Appendix Fig S7F, H and I–K). In all the cases, the control peptide, CP1‐Mut with W99A and G100T mutations neither inhibited the topoisomerase action (Fig EV5A, C, E, G and H, Appendix Fig S7F and H–K) nor showed DNA‐aggregation inducing properties (Appendix Fig S7A–C). This suggests that one or both of the W99 and G100 residues are crucial in causing DNA aggregation. It is possible that the arginine residues are responsible for binding of peptide to DNA, while the W99 and G100 residues may result in peptide (and hence DNA) aggregation or adsorption to plastic surfaces at high peptide concentrations. Ciprofloxacin served as the positive control showing the desired topoisomerase‐inhibition (Fig EV5A, C, E, G and H, Appendix Fig S7F and H–K).
CP1‐WT‐resistant mutants contain a single mutation in the Gyrase A enzyme but are devoid of mutations in the Topoisomerase IV subunits
To evaluate the therapeutic potential of the peptide and gain insights into the target‐mediated cell death caused by the peptide, the propensity of development of de novo resistance towards the CP1‐WT peptide in E. coli was assessed, wherein the identities of the spontaneous mutants resistant to the peptide were determined. In the sensitive strain, Top10, by the fourth passage, the MIC exceeded 640 μM (Appendix Fig S8), and there was little growth inhibition even at this high peptide concentration. As this MIC value was much beyond clinically relevant levels (Nayar et al, 2015), further passages were not carried out. In the resistant strain, Top10Gyrase A, as expected, the cells continued to grow till the highest dosage of the peptide and thus the MIC of the peptide was > 640 μM. Hence, we were unable to generate additional resistant mutants in this background. In vitro isolation of peptide‐resistant Top10 mutants from the fourth passage, followed by sequencing of the genes encoding for Gyrase A, Gyrase B, ParC and ParE enzymes, led to the identification of a single mutation in the N‐terminal breakage‐reunion domain of Gyrase A (Reece & Maxwell, 1991; Sokolsky & Baker, 2003), namely L34Q (CTG to CAG codon change at the nucleotide level), which was consistently present across DNA isolated from all the colonies. No mutations were detected in either of the topoisomerase IV genes (parC or parE). This may be because the Gyrase mutations offer a quicker pathway to resistance in the case of E. coli. It is also possible that the steep increase in MIC in Top10 cells might arise from mutations in the various genes encoding for efflux and/or uptake of small‐molecule inhibitors (peptide in our study) (Dougherty et al, 2014; Nayar et al, 2015), in addition to the single target‐mutation (L34Q in Gyrase A) present at a residue not involved in CcdB‐binding. However, properly delineating the mechanisms responsible for resistance to the CP1‐peptide will require extensive genome sequencing and is beyond the scope of the present study.
The CP1‐WT peptide does not show toxicity in mice
We utilised mouse models to determine in vivo toxicity for CP1‐WT, wherein varying doses of the peptide were intraperitoneally injected, mice were monitored for 14 days and subsequent blood tests were performed to test for toxicity. Animals across all the cohorts survived throughout the entire experimental tenure and showed no or transient loss in body weight (Fig 5A).
Blood chemistry analyses revealed the absence of any significant changes in liver (Fig 5B, Appendix Fig S9A–C), or kidney (Fig 5C, Appendix Fig S9D and E) function across all the four peptide‐treated cohorts, relative to the vehicle control DMSO‐treated cohort with their absolute values (across all the animals) being largely confined within the published reference limits (Østergaard et al, 2011).
CP1‐WT treatment protects mice after infection with lethal doses of Salmonella Typhimurium, Staphylococcus aureus and a carbapenem‐resistant MDR clinical isolate of Acinetobacter baumannii
We tested the in vivo efficacy of the CP1‐WT peptide against S. Typhimurium, S. aureus and A. baumannii in mouse infection models. For the Salmonella infection, a colitis model was used. Here, the mice were infected orally with ~108 CFU (lethal dose) followed by intraperitoneal treatment with three doses of DMSO, peptide or ciprofloxacin at 24 (0.6% DMSO or 50 mg/kg of antibacterial agent), 36 (0.3% DMSO or 25 mg/kg of antibacterial agent) and 48 (0.3% DMSO or 25 mg/kg of antibacterial agent) hours post‐infection. The mortality (Fig 6A) and morbidity (Appendix Fig S10A) were considerably higher in the untreated relative to peptide‐treated (0/7) and ciprofloxacin‐treated (0/7) cohorts (Fig 6A). Although all the cohorts developed clinical signs of infection (Mosquito et al, 2010) within 24 h, peptide treatment attenuated further progression of illness from day 2 onwards (Fig 6B). Peptide treatment led to larger reductions relative to ciprofloxacin in bacterial loads in liver, spleen and kidney (Fig 6C–E). Previous reports suggested that using a lethal dose of 108 CFU would cause systemic infection of S. Typhimurium post 3 days of infection (Santos et al, 2001; Roy Chowdhury et al, 2022). In accordance with this observation, reductions in the bacterial loads upon peptide treatment were also noted in the peyer's patches (~16‐fold) (Appendix Fig S10B) and mesenteric lymph nodes (~2‐fold) (Appendix Fig S10C), whereas in the ciprofloxacin‐treated cohort, ~10‐fold reduction was observed in the peyer's patches (Appendix Fig S10B) with no changes in the mesenteric lymph nodes (Appendix Fig S10C), relative to the DMSO‐treated cohort. For all the surviving animals, histopathology analyses were performed for liver, kidney and spleen. As expected, tissue sections from uninfected animals showed normal hepatic and renal architectures (Fig 6F, Appendix Fig S10D). Marked pathological changes were observed in the liver sections isolated from infected mice, namely aggregation of inflammatory cells, central vein congestion, damage of endothelial lining of veins, hepatic portal vein distortion, cytoplasmic degeneration and necrotic lesions (Fig 6G). Most of these damage markers were observed in the liver sections isolated from DMSO‐treated cohort (Fig 6H). The efficacy of the peptide was reflected with normal hepatic architecture with multiple binucleated cells (indicative of regeneration of hepatic cells and normalisation of liver parenchyma) (Fig 6I), whereas liver sections from ciprofloxacin‐treated cohort still showed some infection‐induced damage markers (Fig 6J). Based on structural changes in tissue sections, these observations were scored. Mean pathological score of 0.2 was observed in the liver sections upon peptide treatment, which was ~10‐fold lower than in the untreated cohort (Fig 6K). Marked pathological changes were observed in the kidney sections isolated from infected animals, namely loss of normal renal architecture, glomerular atrophy, renal tubules showing degeneration and necrosis, focal haemorrhage and vascular congestion (Appendix Fig S10E), most of which were still retained in the sections from DMSO‐treated cohorts (Appendix Fig S10F). The efficacy of the peptide was reflected in the kidney tissue sections which revealed normal renal histo‐architecture with normal glomerulus (Appendix Fig S10G), relative to the sections from ciprofloxacin‐treated cohort which still showed infection markers like vascular congestion and cellular infiltration (Appendix Fig S10H). Mean pathological score of 0.4 was observed in the kidney sections upon peptide treatment, which was ~10‐fold lower than in the untreated cohort (Appendix Fig S10I). Moreover, tissue sections from uninfected animals showed normal splenic architecture (Appendix Fig S10J). Spleen sections from infected mice showed marked pathological changes, namely congestion of white pulp and red pulp, haemorrhage and necrosis (Appendix Fig S10K), most of which still remained in the sections analysed from the DMSO‐treated cohort (Appendix Fig S10L). Upon peptide treatment, normal splenic architecture with normal lymphoid follicles and sinuses was restored (Appendix Fig S10M), whereas some infection markers, namely changes in lymphoid follicles and abnormal architectures of the white pulp, remained in the ciprofloxacin‐treated cohort (Appendix Fig S10N). Mean pathological score of 0.2 was observed in the spleen sections upon peptide treatment, which was ~10‐fold lower than in the untreated cohort (Appendix Fig S10O).
Figure 6. The CP1‐WT peptide reduces infection with S. Typhimurium, an MDR A. baumannii and S. aureus when tested in murine infection models.

-
A–KAction of the CP1‐WT peptide in treatment of S. Typhimurium oral infection.
-
ASurvival was monitored for the S. Typhimurium infected animals across all the cohorts.
-
BClinical scoring for symptoms were recorded for the S. Typhimurium infected animals across all the cohorts.
-
C–EBacterial loads in S. Typhimurium infected organs, namely (C) liver, (D) kidney and (E) spleen, were estimated. Data are presented as mean ± SD CFU/ml values for the bacterial organ loads isolated from seven mice in each cohort.
-
F–JHistopathology analyses with representative H&E‐stained liver sections at different magnifications are shown for S. Typhimurium infected liver treated with various agents.
-
KMean pathological scoring from the tissue sections used in histopathology analyses in panels (F–J) for S. Typhimurium infected liver treated with various agents are shown.
-
L–TAction of the CP1‐WT peptide in treatment of A. baumannii intraperitoneal infections.
-
L–NBacterial loads in A. baumannii infected organs, namely (L) liver, (M) kidney and (N) spleen, were estimated. Data are presented as mean ± SD CFU/ml values for the bacterial organ loads isolated from seven mice in each cohort.
-
O–SHistopathology analyses with representative H&E‐stained liver sections at different magnifications are shown for A. baumannii infected liver treated with various agents.
-
TMean pathological scoring from tissue sections used in histopathology analyses in panels (O–S) for A. baumannii infected liver treated with various agents are represented.
-
U–WAction of the CP1‐WT peptide in treatment of S. aureus subcutaneous infections.
-
UBacterial loads on skin tissue measured on day 6 post‐infection were estimated. Data are presented as mean ± SD CFU/ml values for the bacterial organ loads isolated from seven mice in each cohort.
-
VAbscess volumes measured on day 6 post‐infection were estimated. Data are presented as mean ± SD abscess volume values isolated from seven mice in each cohort.
-
WPhotographs of representative abscesses (shown by arrows) in mice 6 days after infection.
Data information: For all the three infection models stated above, n = 2 biological replicates with seven mice per cohort were used. In panels (A–E), (L–N) and (U, V), representative data for only one biological replicate are presented as mean ± SD values for the parameters obtained from seven mice in each cohort. In panels (K and T), to assign histopathological scores, data are collected from five mice in each cohort, and the representative data for only one biological replicate are presented as mean ± SD values. In panel (A), percent survival was compared between untreated cohort (N.T) and the DMSO/peptide/ciprofloxacin‐treated cohort using a two‐way ANOVA test using Bonferroni correction (ns P > 0.05; *P < 0.01). In panels, (C–E), (K–N) and (T–V), Mann–Whitney rank sum test was used (ns P > 0.05, *P < 0.05, **P < 0.01, ***P < 0.001). The notations, namely N.T, denote no treatment; Pep and Cip denote CP1‐WT and ciprofloxacin treatments respectively. For histopathology analyses in panels (F–J) and (O–S), except for uninfected and peptide‐treated mice, pathology sections from infected or treated (DMSO or ciprofloxacin) mice showed aggregation of multiple inflammatory cells (INF) and oedema (E) in liver parenchyma, central vein congestion (C), distortion of hepatic portal vein (HPV), haemorrhage (H), necrosis (N) and pyknotic nuclei (arrows in panels H, Q). Scale bar: 50 μm in panels (F–J) and (O–S).
We tested the in vivo efficacy of the peptide against a carbapenem‐resistant MDR clinical isolate of A. baumannii (P1270) (Nagarajan et al, 2018, 2019) in a mouse peritoneal infection model. Insignificant changes in mean body weights of the mice were observed throughout the experimental duration (Appendix Fig S11A). Surprisingly, 12 h post‐infection, all the animals, including mice in the untreated cohort, revived and visually appeared to be in a condition similar to those observed at the start of the experiment, despite showing all the clinical infection symptoms within 6 h post‐infection (Appendix Fig S11B). Relative to the DMSO‐treated cohort, the peptide treatment caused a notable ~18‐fold bacterial load reduction in liver compared to the lower ~3‐fold reduction upon ciprofloxacin treatment (Fig 6L). The peptide also performed moderately better than ciprofloxacin in reducing kidney and spleen bacterial loads by ~12.6‐ and ~4.5‐fold respectively (relative to the DMSO‐treated cohort) (Fig 6M and N). As expected, tissue sections from uninfected animals showed normal hepatic and renal architectures (Fig 6O, Appendix Fig S11C). In accordance with the pathological markers visible in the liver and kidney tissue sections from S. Typhimurium infected animals, similar infection markers were also seen in these sections from A. baumannii infected animals (Fig 6P, Appendix Fig S11D). Most of these infection markers were retained in the liver and kidney sections analysed from DMSO‐treated cohorts (Fig 6Q, Appendix Fig S11E). Peptide‐treated animals exhibited normal hepatic architecture with multiple binucleated cells and normal renal histology, whereas in ciprofloxacin‐treated animals, minor vascular congestion in the liver, minimum cellular infiltration and glomeruli with vascular congestion with normal renal tubules were observed (Fig 6R and S, Appendix Fig S11F and G). Mean pathological scores of 0.4 and 0.6 were observed in the liver and kidney sections respectively upon peptide treatment, which were ~7‐fold less than in the untreated cohort (Fig 6T, Appendix Fig S11H). As expected, the uninfected animals showed normal splenic architecture (Appendix Fig S11I). Similar infection markers were observed in the A. baumannii‐infected spleen sections as were seen in the S. Typhimurium‐infected sections (Appendix Fig S11J), most of which were retained in the sections analysed from DMSO‐treated cohort (Appendix Fig S11K). Peptide‐treated animals exhibited well‐defined splenic architecture with diffused white pulp (Appendix Fig S11L), whereas in ciprofloxacin‐treated animals, alterations of splenic white pulp compared to the red pulp were still observed (Appendix Fig S11M). Mean pathological score of 0.4 was observed in the spleen section upon peptide treatment, which was ~7‐fold less than in the untreated cohort (Appendix Fig S11N). Overall, the in vivo animal data demonstrated that CP1‐WT performed better than ciprofloxacin.
In vivo efficacy of the peptide was also tested against S. aureus in a mouse subcutaneous infection model. Relative to the DMSO‐treated cohort, the peptide significantly reduced the bacterial load on the skin tissue by ~32‐fold and the abscess volume by ~5‐fold, whereas ciprofloxacin showed only mild decrements of ~2‐fold and 1.2‐fold for skin bacterial loads and abscess volumes respectively (Fig 6U and V). Visual inspection of the animals clearly showed the progression of Staphylococcal infection in terms of presence of abscesses in the untreated, DMSO‐ and ciprofloxacin‐treated animals, whereas peptide‐treatment led to elimination of the abscess (Fig 6W).
Discussion
The looming peril posed by AMR calls for the urgent development of novel antibacterial strategies (Theuretzbacher & Outterson, 2020; Rawson et al, 2021). The WHO‐listed priority pathogens belonging to the ESKAPE family (De Oliveira et al, 2020) require immediate attention, with increasing resistance observed even towards the last resort antibiotics, namely tigecycline, colistin and carbapenems (Nagarajan et al, 2019). Fluoroquinolones, a long‐established class of broad‐spectrum antibiotics, target Type II topoisomerases, namely DNA Gyrase in the gram‐negative and Topoisomerase IV in the gram‐positive bacteria. Essentiality of their functions and absence in higher eukaryotes make these enzymes attractive targets for the development of novel antibacterial drugs with potentially low toxicity towards eukaryotic organisms (Collin et al, 2011; Khan et al, 2018). With increasing evidence of extensive fluoroquinolone resistance witnessed across the globe, alternative inhibitors of Type II topoisomerases bearing similarities to enzyme‐inhibitor proteins present natively in the bacterial cellular milieu can potentially act as potent antibacterial agents. In this study, a 24‐mer peptide derived from the sequence of a prokaryotic toxic protein, CcdB, has been shown to significantly combat in vivo infections of S. Typhimurium, S. aureus and carbapenem‐ and tigecycline‐resistant A. baumannii. To the best of our knowledge, this is the first study to demonstrate that a synthetic peptide designed based on the sequence of a natural proteinaceous toxin shows in vivo antibacterial efficacy against both gram‐negative and gram‐positive organisms.
CcdB binds proximal to the exit gate in the bottom cavity of the Gyrase A59 dimer while fluoroquinolones bind to the DNA‐gate region in the head dimer interface of the enzyme (Fig 1A) (Morais Cabral et al, 1997; Dao‐Thi et al, 2005; Collin et al, 2011). The two molecules have different mechanisms of action, and there is an absence of mutations that causes cross‐resistance of the two inhibitors (Bernard et al, 1993; Critchlow et al, 1997; Collin et al, 2011). Full‐length CcdB protein is immunogenic and also cannot enter cells, precluding its use as an antibacterial agent. A previous report of a synthetic 40‐mer CcdB‐based peptide demonstrated dual in vitro inhibition of Gyrase‐mediated DNA supercoiling and Topoisomerase IV‐mediated DNA relaxation, but did not investigate in vivo inhibition of bacterial growth (Trovatti et al, 2008). In the present work, we utilised the C‐terminal helical stretch of CcdB, involved in Gyrase‐binding (Bahassi et al, 1995; Dao‐Thi et al, 2005; Tripathi et al, 2016), to design inhibitory peptides. Upon addition of the cell‐penetrating, arginine‐rich CP1 stretch to the N‐terminus of the WT peptide containing the crucial Gyrase‐binding helical stretch of CcdB, growth decline of E. coli, S. Typhimurium, S. aureus and an MDR strain of A. baumannii bacterial cells were observed in the presence of the peptide. No growth decline was observed with the WT peptide lacking CP1. The CP1‐WT peptide bound strongly to both E. coli Gyrase A14 and the E. coli ParC subunit of Topoisomerase IV. The increase in Gyrase‐binding affinity of CP1‐WT relative to WT peptide may also contribute to its antibacterial efficacy. Significant membrane damage was observed for all the strains. The lack of growth inhibition of P. aeruginosa might be partially attributed to the formation of biofilm‐like structures which restrict entry of a majority of antibacterial agents (Rasamiravaka et al, 2015; Olivares et al, 2020). For Pseudomonas aeruginosa in water reservoirs, it was observed that the cells remained viable and cultivable despite being membrane compromised as evidenced by propidium iodide (PI) staining (Lewenza et al, 2018). The organic solvent, DMSO, itself caused membrane damage in the gram‐positive organism S. aureus (Fig 3C), consistent with published reports of DMSO‐induced membrane damage (Ghajar & Harmon, 1968). The negative control CP1‐Mut peptide, harbouring two CcdB substitutions that abrogate Gyrase binding, namely W99A and G100T (Smith & Maxwell, 2006; Adkar et al, 2012; Tripathi et al, 2016), failed to inhibit the growth of E. coli and the pathogenic strains.
In mice, the CP1‐WT peptide was safe and well tolerated (Fig 5). It showed in vivo therapeutic efficacy against S. Typhimurium, S. aureus and a carbapenem‐ and tigecycline‐resistant MDR strain of A. baumannii using oral, skin and peritoneal infection models respectively. In comparison with ciprofloxacin, the peptide caused greater decline in Salmonella and A. baumannii burden loads in liver, kidney and spleen. In the Staphylococcal infection model in mice, the peptide exhibited a large decline (~17‐fold) in the bacterial load in skin tissue, compared to ciprofloxacin which is conventionally used to treat clinical infections of S. aureus (Fig 6U).
In vitro biochemical studies showed that the likely molecular mechanism involved in the antibacterial action of the CP1‐WT peptide was inhibition of Topoisomerase II enzymes (Tables 3 and 4). DNA Gyrase or Topoisomerase IV was the primary intracellular target of the peptide depending on the bacterial strain used.
The likely mechanism of CP1‐WT peptide‐induced bacterial cell death is shown (Fig 7). The first and second steps involve binding of the peptide to the cell membrane, and internalisation throughout the cytosol of the bacteria respectively (Figs 4E–H, EV3 and EV4). These steps occur instantly, as is evident from the efficient cellular uptake of the peptide even at T = 0 h when the peptide has just been added to the cells, followed by imaging of these treated cells (Fig EV3). The third step involves molecular targeting of the peptide to Topoisomerase II enzymes. As indicated by the decrease in amount of other topoisomers and presence of linear DNA in the E. coli Topoisomerase IV cleavage assay (Appendix Fig S12), the peptide likely forms a ternary complex with the enzyme and the nicked linear DNA, similar to that formed for the full‐length CcdB protein. This results in inhibition of either Gyrase or Topoisomerase IV, depending on the bacterial strain used. Peptide‐mediated topoisomerase inhibition leads to the penultimate step of membrane permeabilisation likely through the SOS response, as is evident from significant cellular uptake of propidium iodide after 2 h of peptide treatment (Figs 2 and 3). This leads to a cascade of reactions, ultimately causing cell death, confirmed using TEM microscopic images which revealed cell death markers like membrane blebs, generalised membrane damage and exclusion of cytoplasmic contents out of the cells (Fig 4A–D).
Figure 7. Plausible mechanism for CP1‐WT peptide‐mediated bacterial cell death.

The peptide binds to the cell membrane, followed by internalisation and uniform localisation throughout the cytosolic space. In the cytosol, the peptide sits on the adduct of DNA and Topoisomerase II enzyme, thereby forming a ternary poisoned complex, similar to that formed by the full‐length CcdB protein and Gyrase. Depending on the bacterial strain used, either Gyrase or Topoisomerase IV acts as the primary intracellular target for the peptide. Molecular targeting of the Topoisomerase II enzyme within the cytosol of the bacteria leads to membrane damage generating a cascade of reactions which ultimately cause cell death, confirmed using TEM microscopic images (Fig 4A–D) which revealed cell death markers like membrane blebs, generalised membrane damage and leakage of cytoplasmic contents out of the cells.
It was evident from the propidium iodide‐based flow cytometry and confocal microscopy experiments that no significant membrane damage occurred immediately after addition of peptide to the bacterial cells (Fig 3A–D). TEM microscopy also revealed that no morphological changes in the cellular membrane were observed immediately after peptide addition. Membrane damage was observed in the bacterial strains only after a significant treatment time (1–3 h) with the CP1‐WT peptide (Figs 3A–D and 4A–D). Consequently, it is likely that it occurred because of targeting of the intracellular Topoisomerase II enzymes by the peptide, which triggered a cascade of events leading to membrane permeabilisation and membrane damage, ultimately resulting in cell death.
In recent years, several small‐molecule antibacterial agents called novel bacterial topoisomerase inhibitors (NBTIs) have been developed to combat target‐mediated bacterial resistance acquired upon exposure to fluoroquinolones (Desai et al, 2021). These non‐quinolone class of inhibitors, called NBTIs, bind to bacterial Gyrase and Topoisomerase IV, and bear no cross‐reactivity with quinolones and minimal cross‐reactivity to human topoisomerases (Lahiri et al, 2015; Charrier et al, 2017). NBTIs bind to a site different from, but adjacent to the quinolone‐binding catalytic site on the enzyme. The exact mechanism of NBTI‐mediated enzyme inhibition is completely different from that of fluoroquinolones, wherein the NBTIs bind to the enzyme in the presence of uncleaved DNA, in contrast to the fluoroquinolones, which bind to the enzyme‐DNA complex containing double‐stranded breaks in the DNA (Lahiri et al, 2015; Desai et al, 2021). NBTIs appear to inhibit DNA cleavage by binding to DNA prior to its cleavage reaction, thereby inhibiting the subsequent processes involving DNA conformational changes upon strand passage (Lahiri et al, 2015). Notwithstanding these interesting developments, Gyrase is a major antibacterial target and it is well worth finding novel inhibitors that have distinct mechanisms of action and binding sites relative to both fluoroquinolones and NBTIs. CcdB, the prokaryotic toxin and a known Gyrase inhibitor, binds to the enzyme at a site distal and distinct from the NBTI‐binding and quinolone‐binding sites (Fig 1A), and none of the developed NBTIs bind to the CcdB‐binding pocket of Gyrase A enzyme. With the increasing burden of AMR, the basic scaffold of CcdB‐sequence‐based peptides can be used to design promising, natural antibacterial therapeutics, capable of combating both gram‐positive and gram‐negative bacteria which are resistant to conventional antibiotics. The present work also validates the conserved CcdB binding site on Type II topoisomerases as a drug target.
Materials and Methods
Peptide synthesis
Synthesis of peptides was performed using the standard Fmoc‐based strategy on Rink Amide AM resin (0.7 mmol/g) at a 150 mg scale as described previously (Ghosh et al, 2016), wherein their N‐termini were acetylated post‐Fmoc deprotection (Lahiri et al, 2018). 5(6)‐Carboxyfluorescein (FAM) labelling was performed by fluorophore‐coupling at the free N‐termini of the peptides as described previously (Chatterjee et al, 2012) and these labelled peptides were used in flow cytometry and microscopy experiments. All the peptides were dissolved in DMSO and purified by RP‐HPLC using a Shimadzu UFLC system equipped with a Prominence Diode Array (PDA) ultraviolet detector and a semi‐preparative column (Phenomenex C18, 250 mm × 10 mm I.D., 5 μm) with a binary gradient of acetonitrile in water (20–70% CH3CN over 20 min) at a flow rate of 4 ml/min. Post‐purification, their identities were confirmed by MALDI‐MS (Bruker Daltronics), followed by lyophilisation. To confirm the purity of the peptides, analytical RP‐HPLC was performed using an analytical column (Phenomenex C18, 250 mm × 4.6 mm I.D., 5 μm) with a binary gradient of acetonitrile in water (20–70% CH3CN at a flow rate of 1 ml/min. Highly pure (~95% purity) peptides were synthesised. DMSO was used to dissolve all the peptides.
In vitro Gyrase‐binding affinities of the peptides
Surface plasmon resonance (SPR) experiments were used to study competitive binding of the WT peptide versus the full‐length CcdB protein to Gyrase A14, which were performed on a Biacore 2000 (Biacore, Uppsala, Sweden) instrument equipped with an optical biosensor maintained at 25°C. CcdB and Gyrase A14 proteins were purified as described previously (Bajaj et al, 2008; Aghera et al, 2020). The SPR experiments were performed at a flow rate of 30 μl/min. The CcdB protein (60 μg/ml) was immobilised with 1,000 response units (RUs) by standard amine coupling to the surface of a research‐grade CM5 chip. An un‐immobilised sensor surface that had been activated and deactivated served as the negative control for each binding interaction. Gyrase‐peptide complexes were made by incubating the components at room temperature for 60 min in varying molar ratios of 1:10, 1:15 and 1:20 of Gyrase A14:peptide (100 nM of Gyrase A14 being used in each of the complexes). One hundred nanomolar of Gyrase A14 was first passed over the CcdB protein‐immobilised surface, followed by sequential injections of the various pre‐formed Gyrase‐peptide complexes, in the order of increasing concentrations of the peptide. Running buffer of PBS (pH 7.4) containing 0.05% Tween surfactant was used. In all the cases, the sensor surface was regenerated between the binding reactions by passing 4 M MgCl2 for 30 s in two washes. The correction for non‐specific binding was performed by subtracting the negative control flow cell signal from the observed signal. The analysis was done using the BIA EVALUATION 3.1 software (Tripathi et al, 2016; Rathore et al, 2017). Three biological replicates, each with their technical duplicates, were performed.
In vitro Gyrase‐binding affinities of the peptides were obtained using microscale thermophoresis (MST) experiments. The target, histidine‐tagged Gyrase A14, was fluorescently labelled using the MO‐L008 Monolith™ His‐tag labelling kit following the manufacturer's protocol and diluted in PBST buffer (PBS, pH 7.4, 0.05% Tween‐20) to attain a final concentration in the range of 20–40 nM for usage in the binding studies. The non‐fluorescent peptides were titrated in a 1:1 dilution manner against the target. Samples were loaded into Monolith™ NT.115 MST Standard Capillaries (NanoTemper Technologies), and the fluorescence values were measured using Monolith NT.115 at room temperature (LED excitation power setting – 100%, MST power setting ranging from 40 to 80%) (Chattopadhyay & Varadarajan, 2019; Chattopadhyay et al, 2022). MO.Affinity Analysis software (version 2.2.5, NanoTemper Technologies) was used to determine the affinity parameter, K D. For each of the interactions, three biological replicates, each with their technical duplicates, were used. The mean experimental and the mean fitted fluorescence readings (fraction bound) were plotted together against ligand concentration and the mean K D values, along with their SD values, were calculated.
Purification of the ParC subunit of Topoisomerase IV enzyme
The ParC protein was purified from E. coli BL2l(λDE3)pLysS cells following T7 promoter induction. Briefly, 500 ml of LB medium (HiMedia) was inoculated with 1% of the primary inoculum and grown at 37°C till an OD600 of 0.6–0.8 was reached. The cells were induced with 0.4 mM IPTG and grown for 3 h. The cells were then harvested through centrifugation (3,022 g, 4°C for 15 min), followed by sonication in buffer A (50 mM Tris–HCI, pH 8.4, 150 mM NaCl, 20 mM EDTA, 0.02% lysozyme, 0.12% Tween‐20), and further centrifugation to separate the soluble fraction from the insoluble fraction of the cell lysate. The ParC protein was purified from the inclusion bodies. The cell pellet was solubilised in 1× Buffer A (pH 8.4), supplemented with 150 mM NaCl and 6 M Guanidine hydrochloride. This soluble fraction was refolded in vitro through three rounds of dialysis against 2 l each of the refolding buffers as follows – Round 1: 400 mM Arginine hydrochloride, 150 mM NaCl, Buffer B (50 mM Tris–HCI, pH 7.5, 5 mM DTT, 1 mM EDTA); Round 2: 100 mM Arginine hydrochloride, 150 mM NaCl, Buffer B; Round 3: Buffer B. Finally, the precipitated protein was removed by centrifugation and the supernatant containing the folded ParC was stored in Buffer B for further usage.
In vitro Topoisomerase IV‐binding affinity of the CP1‐WT peptide
Surface plasmon resonance binding experiments were performed using a Biacore T200 biosensor, equipped with streptavidin (SA) chip. All measurements were performed at 25°C in a running buffer of 50 mM Tris–HCI, pH 7.5, 5 mM DTT, 1 mM EDTA and 0.05% (v/v) Tween‐20. Biotinylated CP1‐WT peptide was captured over the flow cell at 1300 RU. Analyte samples of ParC were prepared in the running buffer in the following concentrations, namely 2.4, 4.8, 7.2 and 9.5 nM. Binding over the biotinylated CP1‐WT peptide and a streptavidin reference surface were tested for 100 s, followed by a dissociation phase of 170 s, at a flow rate of 50 μl/min. Blank buffer cycles were performed throughout the experiment by injecting running buffer instead of ParC to subtract the systematic noise from the binding signal. For surface regeneration, 4 M MgCl2 was passed over the flow cell surface at a flow rate of 30 μl/min. The data was processed and fit to a 1:1 binding model using BIAevaluation Software.
Bacterial strains and culture conditions
Escherichia coli K12 MG1655 was used in flow cytometry studies to study cellular uptake of peptide stretches. E. coli Top10, E. coli Top10Gyrase A, Salmonella enterica serovar Typhimurium (ATCC 14028s), Pseudomonas aeruginosa (PAO1), Staphylococcus aureus (ATCC 25923) and an MDR clinical isolate of carbapenem‐ and tigecycline‐resistant Acinetobacter baumannii also resistant to ciprofloxacin (P1270) (Nagarajan et al, 2018, 2019) were used for in vivo and in vitro antibacterial experiments. The genotype of E. coli Top10 is F‐mcrA Δ(mrr‐hsdRMS‐mcrBC) φ80lacZΔM15 ΔlacX74 nupG recA1 araD139 Δ(ara‐leu)7697 galE15 galK16 rpsL(StrR) endA1 λ−. The genotype of E. coli Top10Gyrase A is F−mcrA Δ(mrr‐hsdRMS‐mcrBC) φ80lacZΔM15 ΔlacX74 recA1 araΔ139 Δ(ara‐leu)7697 galU galK rpsL(StrR) endA1 nupG fhuA::IS2.
For the growth studies, MIC and MBD experiments, E. coli Top10 or Top10Gyrase A cells were grown overnight in LB media at 37°C, 180 rpm. These overnight cultures were diluted 1:100 in fresh LB and sub‐cultured at 37°C, 180 rpm till an OD600 value of ~0.2–0.3 was attained. These logarithmic phase cultures were treated with peptides or DMSO to check the effects of the compounds on E. coli. In the case of pathogenic bacteria, overnight cultures were grown at 37°C, 180 rpm for S. Typhimurium and P. aeruginosa in M9 minimal media, and A. baumannii and S. aureus in LB media, followed by centrifugation of 1 ml culture (4,000 rpm, 15 min) and resuspension of the pellet in 1 ml PBS. Ten to ninety microliter cells from the PBS aliquot (stationary phase culture) were treated with peptides or DMSO to monitor their effects on the growth of the pathogenic bacteria. The turbidity of a McFarland standard solution of 0.5 being ~1 × 10⁸ CFU/ml (Wiegand et al, 2008) was used to estimate the number of cells used for in vitro bacterial experiments.
Throughout the course of the entire study, due to technical limitations, the same peptide had to be synthesised in multiple batches which resulted in their varying yields across the batches. Hence, to achieve similar stock concentrations for a particular peptide across all the batches, varying amounts of DMSO had to be added, which resulted in slightly varying percentages of DMSO being used for similar peptide concentrations in various experiments. To account for the usage of varying DMSO concentrations, in every experiment, a DMSO sample with the precise concentration of that being present in the CP1‐WT sample was also used as a control.
Cellular uptake of peptides
Cellular uptake of the FAM‐conjugated peptide stretches (CP1 – CP8) by E. coli was studied using flow cytometry to assess their cell permeation abilities. Briefly, the OD600 of an overnight culture of E. coli K‐12 MG1655 was adjusted to 1. One hundred twenty microliter cells (~2 × 10⁷ cells) were isolated from this solution, mixed with varying peptide concentrations and the remaining volume was adjusted with LB media to make a final reaction volume of 200 μl. The cells were incubated with the peptide at room temperature for 120 min. Post‐incubation, the samples were centrifuged (1,500 g, 10 min), followed by washing of the pelleted cells twice with PBS and resuspending in 200 μl PBS. The fluorescence signals from the cells were analysed on an Accuri C6 cytometer (BD Accuri Cytometers, Ann Arbor, MI) and plotted.
Bacterial growth curves
Two hundred microliter cell aliquots were isolated from early log phase cultures of E. coli Top10 or Top10Gyrase A (OD600 value of ~0.2–0.3), mixed with appropriate doses of peptides or ciprofloxacin (10 μg/ml; positive control), added to the wells of a honeycomb plate and placed in an automated Bioscreen C microbial growth reader. The growth profiles (OD600 values) were measured continuously at 37°C for 15 h at regular intervals of 30 min under shaking conditions of maximum amplitude. Three biological replicates, each with its technical duplicates were performed and the mean OD600 values, along with their SD values, were calculated and plotted against time.
Antimicrobial susceptibility
Minimum inhibitory concentration (MIC)
Modified from the report by Wiegand et al (2008), a 50 μl cell aliquot of E. coli Top10 or Top10Gyrase A (~3 × 10⁶ cells) from a log phase sub‐culture (OD600 ~0.3) was mixed with an appropriate volume of the peptide or ciprofloxacin (10 μg/ml, as the positive control) and the remaining volume was made up with LB media to achieve a final reaction volume of 200 μl. A 50 μl cell aliquot mixed with 150 μl LB and a separate 200 μl LB solution acted as growth and sterility controls respectively. Samples were added to a 96‐deep well round bottomed polystyrene plate, covered with a gas‐permeable polyurethane Breathe‐Easy® membrane and incubated at 37°C, 300 rpm for 16 h. After 16 h, the samples were pipetted out, added to a 96‐well microtiter plate, and the OD600 plate reading was measured in a Thermo Scientific Varioskan® Flash instrument. The MIC of a peptide was defined as the lowest peptide concentration with a well OD600 comparable to the OD600 of sterility control well (Daly et al, 2017). For each peptide, three biological replicates, each with its technical duplicates, were performed and the mean OD600 values along with their SD values were calculated and plotted against peptide concentrations.
For MIC estimation for the pathogenic strains, protocols exactly similar to that followed for E. coli were used, except that in these cases, ~105 cells (for each pathogen) were incubated in individual wells with appropriate volumes of the peptides or ciprofloxacin to achieve their desired concentrations. The 96‐well microtiter plates covered with Breathe‐Easy® membranes were incubated at 37°C, 300 rpm for 16 h. The absorbance of the plates at 595 nm was recorded in a Tecan 96‐well plate reader. Media control with no peptide was used as positive control and media with ciprofloxacin was used as a negative control. 2% DMSO was used as vehicle control as this DMSO concentration was present in the highest concentration of peptides (80 μM) used in these assays. For each pathogenic strain incubated with a particular peptide or ciprofloxacin, five biological replicates were performed.
Minimum bactericidal dose (MBD)
Following protocols exactly similar to the MIC experiments, 200 μl reaction mixtures containing either varying peptide concentrations, ciprofloxacin, components of growth or sterility controls were prepared by incubation of the antibacterial agent for 30 min at 37°C. Each of these samples were diluted 1:10 sequentially with fresh LB media to reach final dilutions of 10−4 and 10−5. Fifty microliter of E. coli Top10 or Top10Gyrase A cells from both the 10−4 and 10−5 diluted suspensions were plated onto antibiotic‐free LB agar plates. The plates were incubated at 37°C for 16 h and colonies were counted. The MBD value (a proxy for modified Minimum Bactericidal Concentration (MBC)) of a peptide was defined as the lowest peptide concentration that killed bacteria with a ≥ 3‐logarithmic reduction (≥ 99.9% killing) of the initial inoculum (untreated sample). For each peptide, three biological replicates, each with its technical duplicates, were performed and the mean CFU/ml values along with their SD values were calculated and plotted against varying peptide concentrations.
In the case of pathogenic bacteria, the MBD values were determined in the stationary phase owing to the physiological relevance of this stage in their pathogenicity. Ten microliter cells (~106 cells) from the 1 ml PBS cell aliquot were mixed with appropriate volumes of the peptide or ciprofloxacin and the remaining volume was made up with PBS to attain a final reaction volume of 100 μl, followed by incubation at 37°C for 30 min. Ten microliter cells mixed with DMSO and PBS acted as growth control, whereas 100 μl PBS acted as sterility control. Fifty microliter cells from the 10−4 and 10−5 diluted suspensions were plated. Pilot experiments were performed to assess viability of these pathogens in presence of DMSO, wherein CFU/ml counts of the viable cells obtained at varying DMSO concentrations were used to determine the highest tolerable DMSO concentration. For each strain incubated with a particular peptide or ciprofloxacin, five biological replicates were performed. The mean and SD values of CFU/ml were calculated for the undiluted suspensions and plotted against peptide concentrations and percentage of DMSO in the solution.
Bacterial membrane damage studied by propidium iodide uptake
An overnight culture of E. coli Top10 or Top10Gyrase A was diluted in LB and sub‐cultured till it attained an OD600 of ~0.5 (~1 × 10⁸ CFU/ml) (Wiegand et al, 2008), followed by a 1:10 dilution with LB. Fifty microliter cell aliquots (~5 × 10⁵ cells) were mixed with varying peptide concentrations or ciprofloxacin (10 μg/ml; positive control) and the remaining volume was made up with PBS to attain a final reaction volume of 400 μl. A 50 μl cell aliquot mixed with 350 μl PBS acted as the negative control, and a 400 μl PBS solution acted as growth and sterility controls respectively. Samples were incubated for 60 min at 37°C, 180 rpm, followed by centrifugation at 1,274 g for 10 min. The cells were collected, resuspended in 400 μl fresh PBS (by placing the cells on ice) and incubated with 2 μg/ml propidium iodide (Sigma‐Aldrich) on ice in dark conditions for 15 min. The cellular fluorescence signals were analysed on an Accuri C6 cytometer (BD Accuri Cytometers, Ann Arbor, MI). Three biological replicates, each with its technical duplicates, were performed, and the mean percentage of propidium iodide uptake, along with their SD values, was calculated and plotted against varying peptide concentrations.
Multiple Sequence Alignment (MSA) of Topoisomerase II sequences from various bacteria
The Gyrase A protein sequences isolated from different bacteria were obtained from the UniProt database, wherein the entries, namely P0AES4, P20831, P37411, P48372 and Q2FCU6 corresponding to E. coli, S. aureus, S. Typhimurium, P. aeruginosa and A. baumannii respectively were used to perform MSA using Clustal Omega (version 1.2.4). The identity matrix was generated by Clustal 2.1. The Gyrase A14 fragment (residues 363–494) in the Gyrase A subunit (Dao‐Thi et al, 2005) in the MSA was used to analyse the conservation of critical amino acids, which had been characterised previously as CcdB‐binding hotspot residues (Aghera et al, 2020). Similarly, the ParC subunits of the Topoisomerase IV enzymes involved in CcdB‐binding (preprint: Kim et al, 2021) with entries namely P0AFI2, P0C1U9, P26973, A0A485FYM2 and A0A3Q8UHN5 corresponding to E. coli, S. aureus, S. Typhimurium, P. aeruginosa and A. baumannii respectively, were used for MSA. Gyrase A14 and ParC sequences from E. coli were aligned to identify the putative CcdB‐binding residues in the ParC sequence. Subsequently, these residues were analysed for their conservation across all the strains in the MSA result.
Confocal microscopy to monitor peptide‐induced membrane damage and peptide‐membrane interaction
For all the pathogenic strains used in the study, ~107 cells isolated from the 1 ml stationary phase cell suspension in PBS were incubated with the peptide or 2% DMSO for 2 h at 37°C, 180 rpm. The cells were smeared on a coverslip, stained with propidium iodide (PI) (0.5 μg/ml) for 30 s, washed with PBS, counterstained with DAPI (5 μg/ml) and washed again twice with PBS. Unstained and DMSO‐treated cells acted as controls to account for auto‐fluorescence and solvent‐induced membrane damage effects respectively. The cells were imaged by a Zeiss confocal microscope (LSM 710, Zeiss, Germany; 100× oil emersion objective; AxioCam digital camera) and analysed by ZEN 2.3 software. The total number of cells in a particular field and the number of cells showing PI fluorescence were counted and plotted. Five biological replicates were performed, and the mean percentage of PI uptake, along with their SD values, was calculated and plotted.
To monitor the peptide‐membrane interaction and cellular localisation, similar protocols for E. coli and all the pathogens were followed, except that FAM‐conjugated peptides were used in this assay at their respective MIC concentrations. The cells were smeared on a coverslip, stained with FM 4‐64FX (lipophilic dye; 10 μg/ml) for 10 min, washed with PBS, counterstained with DAPI (DNA and nuclear staining dye; 0.1 μg/ml) and washed again twice with PBS. Unstained and DMSO‐treated cells were used as controls. The cells were imaged by a Zeiss confocal microscope (LSM 880, Zeiss, Germany; 63× oil emersion objective) and analysed by ZEN 2.3 software. Five biological replicates were performed. Mean intensities analysed by ZEN 2.3 software were plotted along with their SD values.
Transmission electron microscopy to monitor peptide‐induced morphological changes in the cellular membrane of bacterial strains
An overnight culture of E. coli Top10 or the pathogenic strains was diluted in LB and sub‐cultured till it attained an OD600 of ~0.3. ~105 cells (for E. coli or each pathogen) were incubated with the CP1‐WT and CP1‐Mut peptides for 1, 2 and 3 h at 37°C, 180 rpm. Post‐incubation, the samples were drop casted on copper grids and stained with 1% uranyl acetate (Sigma Aldrich). The samples were imaged in a transmission electron microscope (Thermo‐Fischer Scientific).
Generation, selection and identification of resistant mutants
In order to assess the propensity for development of de novo resistance to the CP1‐WT peptide, the increase in MIC and identity of the resistant mutants were determined with the E. coli Top10 strain. Resistant mutants were generated by serial passaging of the cells using the broth microdilution method, which was used to determine the MIC of the peptide in each passage (Wiegand et al, 2008). Briefly, the peptide was diluted in LB media (50 μl of each dilution) by two‐fold dilution method in a 96‐well plate. The highest concentration of CP1 WT peptide used was 640 μM. Then, 100 μl inoculum, containing 106 cells from an overnight grown bacterial suspension, were added in each of the wells, and the remaining volume was made up with LB media to achieve a final reaction volume of 200 μl. The wells containing cells in the absence of the peptide and only media acted as growth and sterility controls respectively. The plate was incubated at 37°C, 300 rpm for 16 h. This was considered as Passage 0. After 16 h, the OD600 plate reading was measured in a Thermo Scientific Varioskan® Flash instrument to determine the MIC. For resistance generation, 1% of the culture from the well containing 0.5 × MIC of the peptide in the 0th passage was used as the inoculum in the subsequent Passage 1 and added to each of the wells in a fresh plate containing serially‐diluted peptide, to make the final desired volume of 200 μl in each well. The MIC was recorded for the 1st passage. This routine was repeated till the 4th passage, where the desired level of resistance was achieved (MIC > 640 μM). The entire experiment was also performed in the resistant strain, E. coli Top10Gyrase A.
For selection of resistant mutants generated in E. coli Top10, cells from the 4th passage were used. Two microliter of the culture was isolated from the well containing 640 μM of the peptide (in the 4th passage) and diluted in 10‐fold steps in LB media to achieve a 10−6 diluted solution. Ten microliter of cells from 10−6 diluted mixture was plated on LB agar plate containing 640 μM of the peptide. The plate was incubated for 16 h at 37°C.
Genomic DNA isolation – Genomic DNA was isolated from seven resistant colonies using established protocol as described previously (Wilson, 2001). The isolated genomic DNA was treated with RNAse A and purified using sodium acetate/ethanol precipitation method to remove any RNA contamination.
Gene amplification and sequencing – To identify the resistance causing mutation(s) in the target genes, subunits of the Type II topoisomerase genes were sequenced. The genes for Gyrase and Topoisomerase IV subunits, namely gyrase A, gyrase B, parC and parE subunits, were selectively amplified from the isolated genomic DNA and sequenced using Sanger sequencing.
In vivo toxicity experiments
In vivo toxicity for the CP1‐WT peptide was determined using the BALB/c mouse model, wherein survival of the animals was monitored upon single‐dose intraperitoneal treatment with the peptide. Eight‐week‐old female BALB/c mice (weighing 23 ± 2 g) were grouped into six cohorts (n = 5 per cohort), namely untreated, DMSO‐treated (vehicle control) cohorts and four peptide‐treated cohorts, each receiving one of the following doses – 25, 50, 75 or 100 mg/kg. 1.6% DMSO was used as vehicle control, and the peptide used in the experiments was synthesised from GenScript (≥ 95% purity, very low endotoxin ≤ 0.01EU/μg). All experiments were performed according to guidelines stated by the committee for the Purpose of Control and Supervision of Experiments on Animals, Government of India, and approved by the Animal Ethics Committee, Indian Institute of Science (project no. CAF/Ethics/670/2019). The mice were housed in a temperature‐ and humidity‐controlled room at the Central Animal Facility (CAF, IISc) and provided with pellet feed and water ad libitum, and their survival and body weight changes were monitored for a period of 14 days. One milliliter blood was collected from all the animals by retro‐orbital puncture and the samples were analysed to measure the levels of serum creatinine, blood urea nitrogen, alanine transaminase (SGPT), alanine aminotransferase (SGOT) and alkaline phosphatase (ALP) levels.
Mouse infection model
The efficacy of the CP1‐WT peptide in treating bacterial loads of Salmonella Typhimurium, an MDR clinical isolate of Acinetobacter baumannii and Staphylococcus aureus, was compared with ciprofloxacin using mouse models. For each of the infection models, 8‐week‐old BALB/c mice were grouped in four cohorts (n = 7 per cohort), namely untreated, DMSO‐treated (vehicle control), peptide‐treated and ciprofloxacin‐treated (positive control) cohorts. A fifth cohort of five uninfected mice was used as a healthy control which helped in comparison of the overall health and clinical symptoms across all the five cohorts. The infection CFU dose was quantified using turbidometry and retrospectively confirmed using colony plating for all the three infection models. To reproduce the prolonged usage of antibiotics spanning over days in clinical settings, a multiple dosing regimen was used, where a single dose of 50 mg/kg followed by two successive doses of 25 mg/kg each of the antibacterial compound (intraperitoneal treatment) was injected at varying time points post‐infection, depending on the bacterial strain used for infection. All the experiments were performed in accordance with the protocols stated and approved by Animal Ethics Committee, Indian Institute of Science (project no. CAF/Ethics/670/2019).
For S. Typhimurium infection, the colitis model was used as described previously (Garai et al, 2016) where the mice were orally infected with a lethal dose of 4 × 10⁸ CFU. For the peptide or ciprofloxacin, the three doses were administered intraperitoneally at 24 (50 mg/kg), 36 (25 mg/kg) and 48 (25 mg/kg) hours post‐infection. The vehicle control was treated with 0.6% DMSO (present in 50 mg/kg of the peptide) followed by two doses of 0.3% DMSO (present in 25 mg/kg of the peptide) at 24, 36 and 48 h post‐infection. The animals were monitored for 6 days post‐infection for their survival and changes in body weights. Their clinical symptoms were scored to assess the infection progress using the following criteria: 0, no symptoms; 1, minor piloerection but active; 2, minor piloerection with lethargy; 3, moderate piloerection; 4, moderate piloerection and huddling; 5, moderate piloerection and fast breathing; 6, moderate piloerection and hunched back; 7, major piloerection, fast breathing and hunched back; 8, emaciation, major piloerection, fast breathing and hunched back. Subsequently, the mice were sacrificed by cervical dislocation and liver, kidney, spleen, peyer's patch and mesenteric lymph nodes were harvested for bacterial burden estimation by plating on Salmonella‐Shigella (SS) agar. Sections of liver, kidney and spleen from all animals were fixed in 10% formalin and stained with Haematoxylin and Eosin (H&E) for histopathological sectioning. For a semi‐quantitative comparison of abnormalities and structural changes in the tissues, pathological scoring was obtained under light microscopy by an expert veterinary pathologist with the scoring criteria as 0, normal structure; 1, mild pathology; 2, moderate pathology and 3, severe pathological changes involving cellular infiltration, vascular congestion, necrosis and haemorrhage.
For A. baumannii infection, a multi‐drug resistant clinical isolate of the pathogen (P1270) (Nagarajan et al, 2018) was grown in Mueller‐Hinton media (supplemented with 8 μg/ml meropenem and 10 μg/ml ciprofloxacin) at 37°C, 180 rpm for 24 h and a dose of 4 × 10⁶ CFU was used to infect the animals intraperitoneally as described previously (Nagarajan et al, 2019). For the peptide or ciprofloxacin, the three doses were administered intraperitoneally at 6 (50 mg/kg), 12 (25 mg/kg) and 24 (25 mg/kg) hours post‐infection. Similar to the Salmonella model, 0.6% DMSO followed by two doses of 0.3% DMSO were administered at 6, 12 and 24 h post‐infection in the vehicle control cohort. The animals were monitored for 3 days post‐infection for their survival and changes in body weights. Subsequently, the mice were sacrificed by cervical dislocation and liver, kidney and spleen were harvested for bacterial burden estimation by plating on Mueller‐Hinton agar (supplemented with 8 μg/ml meropenem and 10 μg/ml ciprofloxacin). Histopathology analyses and pathological scoring of tissue sections from these organs were performed exactly similar to the protocols used for histopathology of S. Typhimurium‐infected organs.
For S. aureus infection, the skin infection model was used as described previously (Chan et al, 2017), where the mice were subcutaneously infected on their right flanks with a dose of 6 × 10⁷ CFU (in 50 μl). For the peptide or ciprofloxacin, the three doses were administered intraperitoneally at 24 (50 mg/kg), 48 (25 mg/kg) and 72 (25 mg/kg) hours post‐infection. 0.6% DMSO, followed by two doses of 0.3% DMSO were administered at 24, 48 and 72 h post‐infection in the vehicle control cohort. The animals were monitored for 3 days post‐infection, and the abscess formation was studied. Subsequently, the mice were sacrificed by cervical dislocation and skin tissue was harvested for bacterial burden estimation by plating on mannitol salt agar. At day 3 post‐infection, abscess volumes were determined as described previously (Yeaman et al, 2014) by measuring the lengths and widths at the lesion sites.
In vitro action on Gyrase supercoiling, Topoisomerase IV relaxation and decatenation
Following protocols provided by Inspiralis Limited, DNA supercoiling assays were performed using Gyrase supercoiling assay kits (Inspiralis) with the enzymes isolated from E. coli, S. Typhimurium, S. aureus, A. baumannii and P. aeruginosa. DNA decatenation assays were performed using Topoisomerase IV decatenation assay kits (Inspiralis) with the enzymes isolated from A. baumannii and S. aureus. DNA relaxation assays were performed using Topoisomerase IV relaxation assay kits (Inspiralis) with the enzymes isolated from E. coli and S. aureus. The subunits of Gyrase (Gyrase A and Gyrase B) and Topoisomerase IV (ParC and ParE) from pathogenic strains were purified individually by Inspiralis using heterologous expression in E. coli and complexed in vitro to form the complete Gyrase and Topoisomerase IV enzymes (provided in the kits), which were used in the assays. Briefly, 2 units of Gyrase, 0.2 μg relaxed pBR322, desired concentrations of the peptide or ciprofloxacin (positive control), and appropriate volumes of the assay buffer were added to get a final reaction volume of 30 μl. The reaction mixture was incubated at 37°C for 30 min and terminated by adding 30 μl STEB buffer, followed by 30 μl of chloroform: isoamyl alcohol (24:1 v/v). The solution was centrifuged at 20,379 g for 5 min, and 20 μl of the upper “blue” layer (aqueous phase) was loaded onto a 1% (w/v) ethidium bromide‐free agarose gel. The gel was electrophoresed at 4 V/cm for 2–3 h to get a clean separation of the resulting topoisomers in the mixture. The gel was stained with 1 μg/ml ethidium bromide for 15 min, followed by destaining in water for 10 min, and visualised under UV light attached with the gel documentation system (ChemiDoc, Bio‐Rad). The same protocol was used for Topoisomerase IV‐mediated decatenation (1 unit of Topoisomerase IV, 0.3 μg kinetoplast DNA isolated from Crithidia fasciculata) and relaxation (1 unit of Topoisomerase IV, 0.2 μg supercoiled pBR322) assays. All the experiments were repeated in five biological replicates and similar results were obtained. For IC50 determination, the relative amounts of supercoiled DNA (Gyrase inhibition and Topoisomerase IV relaxation inhibition) or decatenated DNA (Topoisomerase IV decatenation inhibition) were determined for the samples containing the respective enzymes and DNA, in the absence and presence of the CP1‐WT peptide. The amounts of these topoisomers were quantified using the Geldoc software (Quantity One). The raw data values (in fraction with intensity values < 1) were converted to percentages of the peptide‐free control (whose raw intensity value was 1). To calculate 50% inhibitory concentration (IC50), nonlinear regression was used to fit the percentage values to a dose response – inhibition model using GraphPad Prism software (version 8.0.1). For peptide or ciprofloxacin‐mediated E. coli Topoisomerase IV cleavage assay, the same protocol was followed as stated above for Gyrase supercoiling, except that post‐treatment, the reaction mixture was treated with 0.2% SDS and 1 mg/ml Proteinase K at 37°C for 30 min followed by the usual termination step with STEB buffer and subsequent isolation of the aqueous layer with chloroform: isoamyl alcohol precipitation. Two hundred nanogram of pUC57 was used as substrate DNA in the cleavage assay. To visualise the linear DNA in the cleavage assay, as a control, pUC57 plasmid (substrate) was digested with KpnI‐HF, which produced the expected ~3.6 kb band (single digested linear DNA product).
Using exactly similar protocols, pBAD CcdB plasmid (60 ng) (Bajaj et al, 2004) was incubated with varying peptide concentrations at 37°C for 30 min, followed by 4‐fold dilution of each of the suspensions. PCR amplification was performed using primers corresponding to the CcdB gene, and 2 ng of the DNA from the undiluted and diluted mixtures as starting template concentrations (expected product size ~470 bp). Amplification was visualised under UV light attached with the gel documentation system (ChemiDoc, Bio‐Rad). Three biological replicates were used, and similar results were obtained.
To monitor possible interaction or aggregation of DNA by CP1‐WT, 200 ng of pBAD CcdB plasmid DNA was incubated with varying peptide concentrations following exactly similar protocols as stated above. 1.25 μg/ml of ethidium bromide dye was then added to each of the solutions, and the DNA was visualised using the gel documentation system (ChemiDoc, Bio‐Rad). Three biological replicates were used and similar results were obtained.
Statistical analyses
The statistical analyses were performed using GraphPad Prism software (version 8.0.1). Except Fig 7, the mean ± SD values were plotted for all the data. P‐values were calculated using Student's t‐test, multiple t‐test, Mann–Whitney rank sum test or 2‐way ANOVA test, as indicated in the figures, where P < 0.05 were considered significant.
Author contributions
Jayantika Bhowmick: Conceptualization; data curation; investigation; visualization; methodology; writing – original draft. Manish Nag: Data curation; investigation; visualization; methodology. Pritha Ghosh: Investigation; visualization; methodology. Raju S Rajmani: Investigation; visualization; methodology. Ritika Chatterjee: Investigation; visualization; methodology. Kapudeep Karmakar: Investigation; visualization; methodology. Kasturi Chandra: Investigation; visualization; methodology. Jayanta Chatterjee: Supervision; writing – review and editing. Dipshikha Chakravortty: Supervision; writing – review and editing. Raghavan Varadarajan: Conceptualization; supervision; funding acquisition; methodology; project administration; writing – review and editing.
Disclosure and competing interests statement
The authors declare that they have no conflict of interest.
Supporting information
Appendix
Expanded View Figures PDF
PDF+
Acknowledgements
The plasmid of the parC gene was a kind gift from Prof. Valakunja Nagaraja (Department of Microbiology and Cell Biology, Indian Institute of Science). We acknowledge Dr. Ramandeep Singh from Translational Health Science and Technology Institute (India) for providing critical inputs on the results, and Dr. Shahbaz Ahmed from Molecular Biophysics Unit (Indian Institute of Science) for critical discussions and scientific help in troubleshooting experiments. We acknowledge Venkateswara Rao Nuthakki from Molecular Biophysics Unit (Indian Institute of Science) for the synthesis and purification of the WT peptide. We thank all members of the Varadarajan and Chakravortty laboratories for their valuable suggestions. The study was funded by a grant to RV from the Department of Biotechnology, Ministry of Science and Technology, India (grant number – BT/COE/34/SP15219/2015, DT.20/11/2015). We also acknowledge funding for infrastructural support from the following programs of the Government of India, namely Department of Science and Technology, Ministry of Science and Technology, India (DST FIST), University Grants Commission, Ministry of Education, India (UGC Centre for Advanced study), Ministry of Education, India (MHRD) and the Department of Biotechnology, Ministry of Science and Technology, India ‐ Indian Institute of Science (DBT‐IISc) Partnership Program. The funders had no role in study design, data collection and interpretation, or the decision to submit the work for publication. JB, PG and MN acknowledge the Ministry of Human Resource Development for their research fellowships. KK is supported by a fellowship from the Indian Institute of Science, Bangalore. KC duly acknowledges University Grants Commission for research fellowship. RC acknowledges Council of Scientific and Industrial Research for research fellowship. RV is a J. C. Bose Fellow of DST. Figure 7 and the schematic summary figure were partially and completely created with BioRender.com respectively.
EMBO reports (2023) 24: e55338
Contributor Information
Jayanta Chatterjee, Email: jayanta@iisc.ac.in.
Dipshikha Chakravortty, Email: dipa@iisc.ac.in.
Raghavan Varadarajan, Email: varadar@iisc.ac.in.
Data availability
No primary datasets have been generated and deposited.
References
- Adkar BV, Tripathi A, Sahoo A, Bajaj K, Goswami D, Chakrabarti P, Swarnkar MK, Gokhale RS, Varadarajan R (2012) Protein model discrimination using mutational sensitivity derived from deep sequencing. Structure 20: 371–381 [DOI] [PubMed] [Google Scholar]
- Aghera NK, Prabha J, Tandon H, Chattopadhyay G, Vishwanath S, Srinivasan N, Varadarajan R (2020) Mechanism of CcdA‐mediated rejuvenation of DNA gyrase. Structure 28: 562–572 [DOI] [PubMed] [Google Scholar]
- Aldred KJ, Kerns RJ, Osheroff N (2014) Mechanism of quinolone action and resistance. Biochemistry 53: 1565–1574 [DOI] [PMC free article] [PubMed] [Google Scholar]
- Andriole VT (1993) The future of the quinolones. Drugs 45: 1–7 [DOI] [PubMed] [Google Scholar]
- Bahassi EM, Salmon MA, Van Melderen L, Bernard P, Couturier M (1995) F plasmid CcdB killer protein: ccdB gene mutants coding for non‐cytotoxic proteins which retain their regulatory functions. Mol Microbiol 15: 1031–1037 [DOI] [PubMed] [Google Scholar]
- Bajaj K, Chakshusmathi G, Bachhawat‐Sikder K, Surolia A, Varadarajan R (2004) Thermodynamic characterization of monomeric and dimeric forms of CcdB. Biochem J 380: 409–417 [DOI] [PMC free article] [PubMed] [Google Scholar]
- Bajaj K, Dewan PC, Chakrabarti P, Goswami D, Barua B, Baliga C, Varadarajan R (2008) Structural correlates of the temperature sensitive phenotype derived from saturation mutagenesis studies of CcdB. Biochemistry 47: 12964–12973 [DOI] [PubMed] [Google Scholar]
- Bates AD, Maxwell A (1997) DNA topology: topoisomerases keep it simple. Curr Biol 7: R778–R781 [DOI] [PubMed] [Google Scholar]
- Bernard P, Couturier M (1992) Cell killing by the F plasmid CcdB protein involves poisoning of DNA‐topoisomerase II complexes. J Mol Biol 226: 735–745 [DOI] [PubMed] [Google Scholar]
- Bernard P, Kézdy KE, Van Melderen L, Steyaert J, Wyns L, Pato ML, Higgins PN, Couturier M (1993) The F plasmid CcdB protein induces efficient ATP‐dependent DNA cleavage by gyrase. J Mol Biol 234: 534–541 [DOI] [PubMed] [Google Scholar]
- Brown PO, Cozzarelli NR (1979) A sign inversion mechanism for enzymatic supercoiling of DNA. Science 206: 1081–1083 [DOI] [PubMed] [Google Scholar]
- Champoux JJ (1981) DNA is linked to the rat liver DNA nicking‐closing enzyme by a phosphodiester bond to tyrosine. J Biol Chem 256: 4805–4809 [PubMed] [Google Scholar]
- Champoux JJ (2001) DNA topoisomerases: structure, function, and mechanism. Annu Rev Biochem 70: 369–413 [DOI] [PubMed] [Google Scholar]
- Chan LC, Chaili S, Filler SG, Miller LS, Solis NV, Wang H, Johnson CW, Lee HK, Diaz LF, Yeaman MR (2017) Innate immune memory contributes to host defense against recurrent skin and skin structure infections caused by methicillin‐resistant Staphylococcus aureus . Infect Immun 85: e00876‐16 [DOI] [PMC free article] [PubMed] [Google Scholar]
- Charrier C, Salisbury AM, Savage VJ, Duffy T, Moyo E, Chaffer‐Malam N, Ooi N, Newman R, Cheung J, Metzger R et al (2017) Novel bacterial topoisomerase inhibitors with potent broad‐spectrum activity against drug‐resistant bacteria. Antimicrob Agents Chemother 61: e02100‐16 [DOI] [PMC free article] [PubMed] [Google Scholar]
- Chatterjee J, Beullens M, Sukackaite R, Qian J, Lesage B, Hart DJ, Bollen M, Köhn M (2012) Development of a peptide that selectively activates protein phosphatase‐1 in living cells. Angew Chem Int Ed Engl 51: 10054–10059 [DOI] [PMC free article] [PubMed] [Google Scholar]
- Chattopadhyay G, Varadarajan R (2019) Facile measurement of protein stability and folding kinetics using a nano differential scanning fluorimeter. Protein Sci 28: 1127–1134 [DOI] [PMC free article] [PubMed] [Google Scholar]
- Chattopadhyay G, Bhowmick J, Manjunath K, Ahmed S, Goyal P, Varadarajan R (2022) Mechanistic insights into global suppressors of protein folding defects. PLoS Genet 18: e1010334 [DOI] [PMC free article] [PubMed] [Google Scholar]
- Collin F, Karkare S, Maxwell A (2011) Exploiting bacterial DNA gyrase as a drug target: current state and perspectives. Appl Microbiol Biotechnol 92: 479–497 [DOI] [PMC free article] [PubMed] [Google Scholar]
- Critchlow SE, O'Dea MH, Howells AJ, Couturier M, Gellert M, Maxwell A (1997) The interaction of the F plasmid killer protein, CcdB, with DNA gyrase: induction of DNA cleavage and blocking of transcription. J Mol Biol 273: 826–839 [DOI] [PubMed] [Google Scholar]
- Daly SM, Sturge CR, Greenberg DE (2017) Inhibition of bacterial growth by peptide‐conjugated morpholino oligomers. Methods Mol Biol 1565: 115–122 [DOI] [PMC free article] [PubMed] [Google Scholar]
- Dao‐Thi MH, Van Melderen L, De Genst E, Afif H, Buts L, Wyns L, Loris R (2005) Molecular basis of gyrase poisoning by the addiction toxin CcdB. J Mol Biol 348: 1091–1102 [DOI] [PubMed] [Google Scholar]
- Davis MA, Besser TE, Eckmann K, MacDonald K, Green D, Hancock DD, Baker KNK, Warnick LD, Soyer Y, Wiedmann M et al (2007) Multidrug‐resistant Salmonella Typhimurium, Pacific Northwest, United States. Emerg Infect Dis 13: 1583–1586 [DOI] [PMC free article] [PubMed] [Google Scholar]
- De Jonge N, Garcia‐Pino A, Buts L, Haesaerts S, Charlier D, Zangger K, Wyns L, De Greve H, Loris R (2009) Rejuvenation of CcdB‐poisoned gyrase by an intrinsically disordered protein domain. Mol Cell 35: 154–163 [DOI] [PubMed] [Google Scholar]
- de Kraker MEA, Stewardson AJ, Harbarth S (2016) Will 10 million people die a year due to antimicrobial resistance by 2050? PLoS Med 13: e1002184 [DOI] [PMC free article] [PubMed] [Google Scholar]
- De Oliveira DMP, Forde BM, Kidd TJ, Harris PNA, Schembri MA, Beatson SA, Paterson DL, Walker MJ (2020) Antimicrobial resistance in ESKAPE pathogens. Clin Microbiol Rev 33: e00181‐19 [DOI] [PMC free article] [PubMed] [Google Scholar]
- Desai J, Sachchidanand S, Kumar S, Sharma R (2021) Novel bacterial topoisomerase inhibitors (NBTIs) – a comprehensive review. Eur J Med Chem 3: 100017 [Google Scholar]
- Dougherty TJ, Nayar A, Newman JV, Hopkins S, Stone GG, Johnstone M, Shapiro AB, Cronin M, Reck F, Ehmann DE (2014) NBTI 5463 is a novel bacterial type II topoisomerase inhibitor with activity against gram‐negative bacteria and in vivo efficacy. Antimicrob Agents Chemother 58: 2657–2664 [DOI] [PMC free article] [PubMed] [Google Scholar]
- Drlica K, Coughlin S (1989) Inhibitors of DNA gyrase. Pharmacol Ther 44: 107–121 [DOI] [PubMed] [Google Scholar]
- Drlica K, Zhao X (1997) DNA gyrase, topoisomerase IV, and the 4‐quinolones. Microbiol Mol Biol Rev 61: 377–392 [DOI] [PMC free article] [PubMed] [Google Scholar]
- Dwyer DJ, Kohanski MA, Hayete B, Collins JJ (2007) Gyrase inhibitors induce an oxidative damage cellular death pathway in Escherichia coli . Mol Syst Biol 3: 91 [DOI] [PMC free article] [PubMed] [Google Scholar]
- Emmerson AM, Jones AM (2003) The quinolones: decades of development and use. J Antimicrob Chemother 51: 13–20 [DOI] [PubMed] [Google Scholar]
- Fairbrother RW, Williams BL (1956) Two new antibiotics. Antibacterial activity of novobiocin and vancomycin. Lancet 271: 1177–1179 [DOI] [PubMed] [Google Scholar]
- Garai P, Lahiri A, Ghosh D, Chatterjee J (2016) Peptide‐utilizing carbon starvation gene yjiY is required for flagella‐mediated infection caused by Salmonella . Microbiology 162: 100–116 [DOI] [PubMed] [Google Scholar]
- García MT, Carreño D, Tirado‐Vélez JM, Ferrándiz MJ, Rodrigues L, Gracia B, Amblar M, Ainsa JA, de la Campa AG (2018) Boldine‐derived alkaloids inhibit the activity of DNA topoisomerase I and growth of Mycobacterium tuberculosis . Front Microbiol 9: 1659 [DOI] [PMC free article] [PubMed] [Google Scholar]
- Gellert M (1981) DNA topoisomerases. Annu Rev Biochem 50: 879–910 [DOI] [PubMed] [Google Scholar]
- Ghajar BM, Harmon A (1968) The effect of dimethyl sulfoxide (DMSO) on permeability of Staphylococcus aureus . Biochem Biophys Res Commun 32: 940–944 [DOI] [PubMed] [Google Scholar]
- Ghosh D, Lahiri P, Verma H, Mukherjee S, Chatterjee J (2016) Engineering β‐sheets employing N ‐methylated heterochiral amino acids. Chem Sci 7: 5212–5218 [DOI] [PMC free article] [PubMed] [Google Scholar]
- Higgins PG, Coleman K, Amyes SGB (2000) Bactericidal and bacteriostatic activity of gemifloxacin against Acinetobacter spp. in vitro . J Antimicrob Chemother 45: 71–77 [DOI] [PubMed] [Google Scholar]
- Hoeksema H, Johnson JL, Hinman JW (1955) Structural studies on Streptonivicin, a new antibiotic. J Am Chem Soc 77: 6710–6711 [Google Scholar]
- Kato J, Nishimura Y, Imamura R, Niki H, Hiraga S, Suzuki H (1990) New topoisomerase essential for chromosome segregation in E. coli . Cell 63: 393–404 [DOI] [PubMed] [Google Scholar]
- Khan T, Sankhe K, Suvarna V, Sherje A, Patel K, Dravyakar B (2018) DNA gyrase inhibitors: Progress and synthesis of potent compounds as antibacterial agents. Biomed Pharmacother 103: 923–938 [DOI] [PubMed] [Google Scholar]
- Khatri B, Nuthakki VR, Chatterjee J (2019) Strategies to enhance metabolic stabilities. Methods Mol Biol 2001: 17–40 [DOI] [PubMed] [Google Scholar]
- Kim JWJ, Blay V, Mira P, Barlow M, Camps M (2021) Genetic interplay between type II topoisomerase enzymes and chromosomal ccdAB toxin‐antitoxin in E. coli . bioRxiv 10.1101/2021.09.24.461737 [PREPRINT] [DOI]
- King DE, Malone R, Lilley SH (2000) New classification and update on the quinolone antibiotics. Am Fam Physician 61: 2741–2748 [PubMed] [Google Scholar]
- Komp Lindgren P, Karlsson A, Hughes D (2003) Mutation rate and evolution of fluoroquinolone resistance in Escherichia coli isolates from patients with urinary tract infections. Antimicrob Agents Chemother 47: 3222–3232 [DOI] [PMC free article] [PubMed] [Google Scholar]
- Lahiri SD, Kutschke A, McCormack K, Alm RA (2015) Insights into the mechanism of inhibition of novel bacteria topoisomerase inhibitors from characterization of resistant mutants of Staphylococcus aureus . Antimicrob Agents Chemother 59: 5278–5287 [DOI] [PMC free article] [PubMed] [Google Scholar]
- Lahiri P, Verma H, Ravikumar A, Chatterjee J (2018) Protein stabilization by tuning the steric restraint at the reverse turn. Chem Sci 9: 4600–4609 [DOI] [PMC free article] [PubMed] [Google Scholar]
- Lee MB, Greig JD (2013) A review of nosocomial Salmonella outbreaks: infection control interventions found effective. Public Health 127: 199–206 [DOI] [PubMed] [Google Scholar]
- Lei EK, Pereira MP, Kelley SO (2013) Tuning the intracellular bacterial targeting of peptidic vectors. Angew Chem Int Ed Engl 52: 9660–9663 [DOI] [PubMed] [Google Scholar]
- Levine C, Hiasa H, Marians KJ (1998) DNA gyrase and topoisomerase IV: biochemical activities, physiological roles during chromosome replication, and drug sensitivities. Biochim Biophys Acta 1400: 29–43 [DOI] [PubMed] [Google Scholar]
- Lewenza S, Abboud J, Poon K, Kobryn M, Humplik I, Bell JR, Mardan L, Reckseidler‐Zenteno S (2018) Pseudomonas aeruginosa displays a dormancy phenotype during long‐term survival in water. PLoS One 13: e0198384 [DOI] [PMC free article] [PubMed] [Google Scholar]
- Liu LF, Liu CC, Alberts BM (1980) Type II DNA topoisomerases: enzymes that can unknot a topologically knotted DNA molecule via a reversible double‐strand break. Cell 19: 697–707 [DOI] [PubMed] [Google Scholar]
- Liu LF, Rowe TC, Yang L, Tewey KM, Chen GL (1983) Cleavage of DNA by mammalian DNA topoisomerase II. J Biol Chem 258: 15365–15370 [PubMed] [Google Scholar]
- Llaca‐Díaz JM, Mendoza‐Olazarán S, Camacho‐Ortiz A, Flores S, Garza‐González E (2012) One‐year surveillance of eskape pathogens in an intensive care unit of monterrey, Mexico. Chemotherapy 58: 475–481 [DOI] [PubMed] [Google Scholar]
- Mizuuchi K, Fisher LM, O'Dea MH, Gellert M (1980) DNA gyrase action involves the introduction of transient double‐strand breaks into DNA. Proc Natl Acad Sci USA 77: 1847–1851 [DOI] [PMC free article] [PubMed] [Google Scholar]
- Morais Cabral JH, Jackson AP, Smith CV, Shikotra N, Maxwell A, Liddington RC (1997) Crystal structure of the breakage‐Reunion domain of DNA gyrase. Nature 388: 903–906 [DOI] [PubMed] [Google Scholar]
- Morrison A, Cozzarelli NR (1979) Site‐specific cleavage of DNA by E. coli DNA gyrase. Cell 17: 175–184 [DOI] [PubMed] [Google Scholar]
- Mosquito S, Ochoa TJ, Cok J, Cleary TG (2010) Effect of bovine lactoferrin in Salmonella ser. Typhimurium infection in mice. Biometals 23: 515–521 [DOI] [PubMed] [Google Scholar]
- Nagarajan D, Nagarajan T, Roy N, Kulkarni O, Ravichandran S, Mishra M, Chakravortty D, Chandra N (2018) Computational antimicrobial peptide design and evaluation against multidrug‐resistant clinical isolates of bacteria. J Biol Chem 293: 3492–3509 [DOI] [PMC free article] [PubMed] [Google Scholar]
- Nagarajan D, Roy N, Kulkarni O, Nanajkar N, Datey A, Ravichandran S, Thakur C, Sandeep T, Aprameya IV, Sarma SP et al (2019) Ω76: a designed antimicrobial peptide to combat carbapenem‐ and tigecycline‐resistant Acinetobacter baumannii . Sci Adv 5: eaax1946 [DOI] [PMC free article] [PubMed] [Google Scholar]
- Nalule Y (2011) Exploring resistance map: the rise of fluoroquinolone resistance (Part 1). https://cddep.org/blog/posts/exploring_resistancemap_rise_fluoroquinolone_resistance_part_1/
- Nayar AS, Dougherty TJ, Reck F, Thresher J, Gao N, Shapiro AB, Ehmann DE (2015) Target‐based resistance in Pseudomonas aeruginosa and Escherichia coli to NBTI 5463, a novel bacterial type II topoisomerase inhibitor. Antimicrob Agents Chemother 59: 331–337 [DOI] [PMC free article] [PubMed] [Google Scholar]
- Neill JO (2014) Antimicrobial resistance: tackling a crisis for the health and wealth of nations. London: Review on Antimicrobial Resistance; [Google Scholar]
- Olivares E, Badel‐Berchoux S, Provot C, Prévost G, Bernardi T, Jehl F (2020) Clinical impact of antibiotics for the treatment of Pseudomonas aeruginosa biofilm infections. Front Microbiol 10: 2894 [DOI] [PMC free article] [PubMed] [Google Scholar]
- Østergaard G, Hansen HN, Ottesen JL (2011) Physiological, hematological and clinical chemistry parameters, including conversion factors. In Handbook of Laboratory Animal Science: Volume 1 Essential Principles and Practices, Hau J, Shapiro SJ (eds), 3rd edn, pp 667–709. Boca Raton, FL: CRC Press; [Google Scholar]
- Pham TDM, Ziora ZM, Blaskovich MAT (2019) Quinolone antibiotics. Medchemcomm 10: 1719–1739 [DOI] [PMC free article] [PubMed] [Google Scholar]
- Pommier Y (2006) Topoisomerase I inhibitors: camptothecins and beyond. Nat Rev Cancer 6: 789–802 [DOI] [PubMed] [Google Scholar]
- Rasamiravaka T, Labtani Q, Duez P, El Jaziri M (2015) The formation of biofilms by pseudomonas aeruginosa: a review of the natural and synthetic compounds interfering with control mechanisms. Biomed Res Int 2015: 759348 [DOI] [PMC free article] [PubMed] [Google Scholar]
- Rathore U, Saha P, Kesavardhana S, Kumar AA, Datta R, Devanarayanan S, Das R, Mascola JR, Varadarajan R (2017) Glycosylation of the core of the HIV‐1 envelope subunit protein gp120 is not required for native trimer formation or viral infectivity. J Biol Chem 292: 10197–10219 [DOI] [PMC free article] [PubMed] [Google Scholar]
- Rawson TM, Wilson RC, Hope WW, Holmes AH (2021) Optimizing antimicrobial use: challenges, advances and opportunities. Nat Rev Microbiol 19: 747–758 [DOI] [PubMed] [Google Scholar]
- Reece RJ, Maxwell A (1991) Probing the limits of the DNA breakage‐Reunion domain of the Escherichia coli DNA gyrase A protein. J Biol Chem 266: 3540–3546 [PubMed] [Google Scholar]
- Robicsek A, Jacoby GA, Hooper DC (2006) The worldwide emergence of plasmid‐mediated quinolone resistance. Lancet Infect Dis 6: 629–640 [DOI] [PubMed] [Google Scholar]
- Roy Chowdhury A, Sah S, Varshney U, Chakravortty D (2022) Salmonella Typhimurium outer membrane protein A (OmpA) renders protection against nitrosative stress by promoting SCV stability in murine macrophages. PLoS Pathog 18: e1010708 [DOI] [PMC free article] [PubMed] [Google Scholar]
- Saharman YR, Karuniawati A, Severin JA, Verbrugh HA (2021) Infections and antimicrobial resistance in intensive care units in lower‐middle income countries: a scoping review. Antimicrob Resist Infect Control 10: 22 [DOI] [PMC free article] [PubMed] [Google Scholar]
- Sander M, Hsieh T (1983) Double strand DNA cleavage by type II DNA topoisomerase from Drosophila melanogaster . J Biol Chem 258: 8421–8428 [PubMed] [Google Scholar]
- Sandhaus S, Annamalai T, Welmaker G, Houghten RA, Paz C, Garcia PK, Andres A, Narula G, Rodrigues Felix C, Geden S et al (2016) Small‐molecule inhibitors targeting topoisomerase I as novel antituberculosis agents. Antimicrob Agents Chemother 60: 4028–4036 [DOI] [PMC free article] [PubMed] [Google Scholar]
- Santos RL, Zhang S, Tsolis RM, Kingsley RA, Adams LG, Bäumler AJ (2001) Animal models of Salmonella infections: enteritis versus typhoid fever. Microbes Infect 3: 1335–1344 [DOI] [PubMed] [Google Scholar]
- Scheirer KE, Higgins NP (1997) The DNA cleavage reaction of DNA gyrase: comparison of stable ternary complexes formed with enoxacin and CcdB protein. J Biol Chem 272: 27202–27209 [DOI] [PubMed] [Google Scholar]
- Shane SJ (1956) Novobiocin, a new antibiotic. Can Med Assoc J 75: 51–52 [PMC free article] [PubMed] [Google Scholar]
- Smith AB, Maxwell A (2006) A strand‐passage conformation of DNA gyrase is required to allow the bacterial toxin, CcdB, to access its binding site. Nucleic Acids Res 34: 4667–4676 [DOI] [PMC free article] [PubMed] [Google Scholar]
- Sokolsky TD, Baker TA (2003) DNA gyrase requirements distinguish the alternate pathways of Mu transposition. Mol Microbiol 47: 397–409 [DOI] [PubMed] [Google Scholar]
- Stanzl EG, Trantow BM, Vargas JR, Wender PA (2013) Fifteen years of cell‐penetrating, guanidinium‐rich molecular transporters: basic science, research tools, and clinical applications. Acc Chem Res 46: 2944–2954 [DOI] [PMC free article] [PubMed] [Google Scholar]
- Tchesnokova V, Radey M, Chattopadhyay S, Larson L, Lee J, Kisiela D (2019) Pandemic fluoroquinolone resistant Escherichia coli clone ST1193 emerged via simultaneous homologous recombinations in 11 gene loci. Proc Natl Acad Sci USA 116: 14740–14748 [DOI] [PMC free article] [PubMed] [Google Scholar]
- Theuretzbacher U, Outterson K (2020) The global preclinical antibacterial pipeline. Nat Rev Microbiol 18: 275–285 [DOI] [PMC free article] [PubMed] [Google Scholar]
- Threlfall EJ (2002) Antimicrobial drug resistance in Salmonella: problems and perspectives in food‐ and water‐borne infections. FEMS Microbiol Rev 26: 141–148 [DOI] [PubMed] [Google Scholar]
- Tripathi A, Gupta K, Khare S, Jain PC, Patel S, Kumar P, Pulianmackal AJ, Aghera N, Varadarajan R (2016) Molecular determinants of mutant phenotypes, inferred from saturation mutagenesis data. Mol Biol Evol 33: 2960–2975 [DOI] [PMC free article] [PubMed] [Google Scholar]
- Trovatti E, Cotrim CA, Garrido SS, Barros RS, Marchetto R (2008) Peptides based on CcdB protein as novel inhibitors of bacterial topoisomerases. Bioorg Med Chem Lett 18: 6161–6164 [DOI] [PubMed] [Google Scholar]
- Tse YC, Kirkegaard K, Wang JC (1980) Covalent bonds between protein and DNA. Formation of phosphotyrosine linkage between certain DNA topoisomerases and DNA. J Biol Chem 255: 5560–5565 [PubMed] [Google Scholar]
- Valenzuela MV, Domenech M, Mateos‐Martínez P, González‐Camacho F, de la Campa AG, García MT (2020) Antibacterial activity of a DNA topoisomerase I inhibitor versus fluoroquinolones in Streptococcus pneumoniae . PLoS One 15: e0241780 [DOI] [PMC free article] [PubMed] [Google Scholar]
- Wall ME, Wani MC (1996) Camptothecin and taxol: from discovery to clinic. J Ethnopharmacol 51: 234–239 [DOI] [PubMed] [Google Scholar]
- Wang X, Biswas S, Paudyal N, Pan H, Li X, Fang W, Yue M (2019) Antibiotic resistance in Salmonella Typhimurium isolates recovered from the food chain through National Antimicrobial Resistance Monitoring System between 1996 and 2016. Front Microbiol 10: 985 [DOI] [PMC free article] [PubMed] [Google Scholar]
- Wiegand I, Hilpert K, Hancock REW (2008) Agar and broth dilution methods to determine the minimal inhibitory concentration (MIC) of antimicrobial substances. Nat Protoc 3: 163–175 [DOI] [PubMed] [Google Scholar]
- Wilson K (2001) Preparation of genomic DNA from bacteria. Curr Protoc Mol Biol Chapter 2: Unit 2.4 [DOI] [PubMed] [Google Scholar]
- Yang C, Li H, Zhang T, Chu Y, Zuo J, Chen D (2020) Study on antibiotic susceptibility of Salmonella Typhimurium L forms to the third and forth generation cephalosporins. Sci Rep 10: 3042 [DOI] [PMC free article] [PubMed] [Google Scholar]
- Yeaman MR, Filler SG, Chaili S, Barr K, Wang H, Kupferwasser D (2014) Mechanisms of NDV‐3 vaccine efficacy in MRSA skin versus invasive infection. Proc Natl Acad Sci USA 111: E5555–E5563 [DOI] [PMC free article] [PubMed] [Google Scholar]
- Zhanel GG, Walkty A, Vercaigne L, Karlowsky JA, Embil J, Gin AS, Hoban DJ (1999) The new fluoroquinolones: a critical review. Can J Infect Dis 10: 207–238 [DOI] [PMC free article] [PubMed] [Google Scholar]