

Abstract
In addition to triggering humoral responses, conventional B cells have been described in vitro to cross‐present exogenous antigens activating naïve CD8+ T cells. Nevertheless, the way B cells capture these exogenous antigens and the physiological roles of B cell‐mediated cross‐presentation remain poorly explored. Here, we show that B cells capture bacteria by trans‐phagocytosis from previously infected dendritic cells (DC) when they are in close contact. Bacterial encounter “instructs” the B cells to acquire antigen cross‐presentation abilities, in a process that involves autophagy. Bacteria‐instructed B cells, henceforth referred to as BacB cells, rapidly degrade phagocytosed bacteria, process bacterial antigens and cross‐prime naïve CD8+ T cells which differentiate into specific cytotoxic cells that efficiently control bacterial infections. Moreover, a proof‐of‐concept experiment shows that BacB cells that have captured bacteria expressing tumor antigens could be useful as novel cellular immunotherapies against cancer.
Keywords: B cell‐mediated antigen cross‐presentation, cancer immunotherapy, cellular therapy, Listeria monocytogenes, transphagocytosis
Subject Categories: Autophagy & Cell Death; Immunology; Microbiology, Virology & Host Pathogen Interaction
B cells capturing Listeria monocytogenes acquire antigen cross‐presentation abilities in a process that involves autophagy. These bacteria‐instructed B cells (BacB) effectively cross‐prime naïve CD8+ T cells which differentiate into specific cytotoxic cells that efficiently control bacterial infections.

Introduction
B cells play crucial roles during immune responses to pathogen or tumor insults, however, their functions outside the humoral responses are poorly understood. The major role of B cells is to orchestrate humoral immunity to generate high‐affinity antibodies against antigens (Nutt et al, 2015). The first step in this response begins with the recognition of foreign antigens e.g. soluble or particulate antigens and large immune complexes, by the B cell receptor (BCR) (Yang & Reth, 2010; Mattila et al, 2013; Liu et al, 2016). B cells mainly recognize the unprocessed antigens on the surface of antigen presenting cells (APCs) such as subscapular sinus macrophages (Carrasco & Batista, 2007; You et al, 2011; Prokopec et al, 2016), dendritic cells (DCs) (Qi et al, 2006; Gonzalez et al, 2010) and follicular dendritic cells (FDCs) (Suzuki et al, 2009). Antigen exposition produces a BCR microcluster formation that finishes with the antigen internalization by B cells (Fleire et al, 2006; Yuseff et al, 2011; Natkanski et al, 2013). In addition, small soluble antigens can also rapidly access the B cell compartment of the secondary lymph organs through conduits (Roozendaal et al, 2009). The BCR‐mediated extraction of antigens allows the B cells to present them to the CD4+ T cells in the T‐B border of the lymph nodes (Garside et al, 1998; Allen et al, 2007; Crotty, 2019). Consequently, the CD4+ T cell contacts provide the necessary signals for the B cells to become fully activated and to produce a full humoral immune response (Akkaya et al, 2020).
Some studies suggest that B cells can be also involved in cross‐presentation, activating naïve CD8+ T cells (de Wit et al, 2010; Alloatti et al, 2015; Ren et al, 2021) despite the general belief indicating that cross‐presentation is mainly carried out by certain subtypes of DC (Cerovic et al, 2015; Wculek et al, 2020; Canton et al, 2021). Increasing evidence has shown that DC‐mediated cross‐presentation is crucial to triggering the CD8+ T cells responses necessary to clean viral infections (Wu et al, 2019; Barbet et al, 2021) and to fight against tumors (Sánchez‐Paulete et al, 2017; Wculek et al, 2020).
It is not clear, however, how B cells capture and process the cross‐presented antigens, neither the physiological role of such B‐cell mediated antigen cross‐presentation. In this regard, recent studies have shown that B cells infiltration in tumors is correlated with good prognosis and it has been suggested that this could be related to the antigen presentation ability of B cells (Garnelo et al, 2017; Edin et al, 2019; Lu et al, 2020; Hu et al, 2021).
It is well known that professional phagocytes like DCs usually internalize pathogens by phagocytosis (Gordon, 2016). Similarly, B cells from early vertebrates are able to phagocytose pathogens (Li et al, 2006). Mammals maintain this innate capacity in certain B cell subsets (B1 B cells) (Gao et al, 2012). However, it is widely accepted that conventional B cells (B2 cells), the most common type of B cells in the spleen, do not have phagocytic abilities (Ochando et al, 2006). Indeed, they are commonly used as negative controls in phagocytosis experiments (Vidard et al, 1996; Ochando et al, 2006). Contrary to this theory, some authors have shown that conventional B cells phagocytose antigens through their BCR and initiate a humoral response against those antigens (Martínez‐Riaño et al, 2018). In addition, other investigations have reported the capture of Salmonella in vitro by conventional B cells (Rosales‐Reyes et al, 2012; Souwer et al, 2012). Consequently, there is not a clear consensus about whether mammalian conventional B cells are phagocytic cells neither their ability to process and present antigens from captured pathogens.
We previously described that the non‐phagocytic CD4+ T cells, are able to capture bacteria by a process termed trans‐phagocytosis from infected DCs (Cruz‐Adalia et al, 2014, 2017), similarly to what is observed for several viruses (Holl et al, 2010; Gaspar et al, 2011). Likewise, it has been shown that infected DCs, which are unable to completely destroy the uptaken bacteria (Campisi et al, 2011) migrate towards the lymph nodes, where they establish stable contacts with B cells (Waite et al, 2011), which could favor bacterial uptake by B cells. However, the ability of the B cells to capture bacteria from infected DCs by trans‐phagocytosis, which could be a source to provide antigens for cross‐presentation, has not yet been explored.
In this study we show that conventional B cells are able to capture bacteria by trans‐phagocytosis while forming immunological contacts with infected DCs. We also show that these captured bacteria are a source of cross‐presented antigens. Exposure to bacteria instructs B cells (BacB cells) that acquired the ability of cross‐present bacterial antigens, being able to destroy internalized bacteria, process bacterial antigens and cross‐present these antigens activating naïve CD8+ T cells, which in turn, trigger a potent cytotoxic response. The antigen cross‐presentation ability of BacB cells, which requires active autophagy, drives the activation of CD8+ T cells involved in the resolution of pathogen infection and the elimination of implanted tumors. These results pave the way for future research regarding the use of BacB cells as a potential novel generation of cellular immunotherapy against cancer.
Results and Discussion
B cells capture bacteria by trans‐phagocytosis from infected dendritic cells
A controversy exists regarding the ability of conventional B cells to phagocytose bacteria (Menon et al, 2003; Krocova et al, 2020). Although some studies suggest that they induce potent CD8+ T cells responses during infection (Khanna et al, 2007), the way that B cells capture antigens for CD8+ T cells activation has not yet been described. As a response to this lack of consensus, we have studied the capacity of B cells to capture Listeria monocytogenes, a bacterium model that induces CD8+ T cell cellular immunity (Chávez‐Arroyo & Portnoy, 2020; Levine et al, 2021).
Conventional B cells (CD19+ CD5−; Fig EV1A) were purified from mouse spleen to test their ability to capture bacteria. Conventional B cells in vitro were refractory to direct bacteria capture, even though L. monocytogenes is a pathogen able to infect non‐phagocytic cells. On the contrary, professional phagocytes such as BM‐DCs were able to capture L. monocytogenes (Fig 1A). Next, we enabled immunological contact between infected BM‐DCs (iDCs) and conventional B cells. To mimic immune synapses, we used the well‐known MD4‐HEL model. B cells were obtained from MD4 mice, expressing a BCR that recognizes Hen Egg Lysozyme (HEL). HEL‐decorated BM‐DCs were infected with L. monocytogenes, and co‐incubated with MD4 B cells. The subcellular localization of Listeria during iDCs/B cell contacts was imaged by confocal microscopy. During early immunological synapse formation, i.e occurred within 30 min, the bacteria inside iDCs polarized towards cell‐to‐cell contacts (Fig 1B). Extended (2 h) iDC/B cell immunological synapses showed that B cells were able to capture bacteria (Fig 1C, Movie EV1).
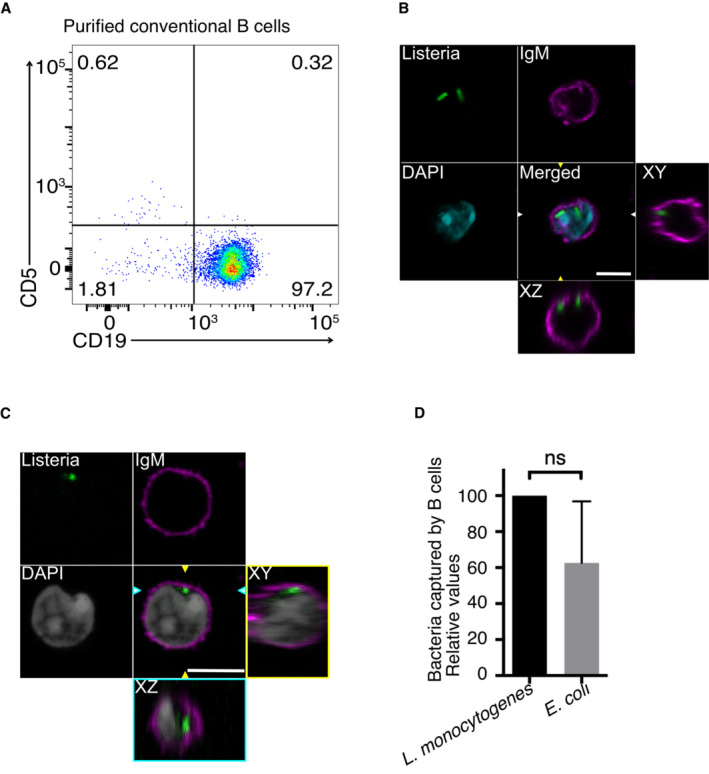
Figure EV1. B cells capture bacteria by trans‐phagocytosis.
-
AAnalysis by flow cytometry of CD5 expression (negative in conventional B cells, positive in B1 cells) in B cells isolated from spleen.
-
B, CConfocal images of B cells from WT mice that have captured L. monocytogenes (green), after 4 h of infected DC/B cell contacts. B cell surface was detected using an anti IgM antibody (magenta) the B cell nucleus was stained with DAPI (cyan in (B) and gray in (C)). The orthogonal views show intracellular bacteria. Scale bar represents 5 μm. Arrowheads indicate the XZ and YZ axes.
-
DGentamicin survival assay showing transphacosytosis of E. coli captured by B cells, in values relative to L. monocytogenes capture. The column bars represent the mean of at least three independent experiments. Non‐significant differences are marked as (ns) according to Student t‐test.
Source data are available online for this figure.
Figure 1. B cells capture bacteria by trans‐phagocytosis.

-
AGentamicin survival assay showing bacteria captured by DC or B cells.
-
B, CConfocal images of DCs decorated with HEL (not colored) infected with L. moncytogenes (in red), coincubated during 30 min (B) or 120 min (C) with noninfected B cells (in blue) isolated from MD4 mice. Actin is shown in cyan. In (C), the orthogonal views show intracellular bacteria in B cell. Scale bars represent 5 μm. White arrow in (B) point to a bacterium at the B cell‐DC contact area surrounded by actin. Arrowheads in (C) indicate the XZ and YZ axes.
-
DL. monocytogenes‐infected DCs were decorated (or not) with HEL, followed by coincubation B cells in conditions that allow DC‐B cell contacts or in the presence of a phisical barrier (transwell) preventing cellular interactions. After conjugate formation (90 min), B cells were reisolated, and intracellular bacteria in B cells were measured by classical gentamicin survival assays.
-
EGentamicin survival assay showing bacteria captured by B cells treated or not whith 80 μM Dynasore.
-
FQuantification of DC/B cells conjugate formation afer dynasore treatmeted of B cells. Data were normalized compared to DC/B cells conjugates without treatment (vehicle).
-
GBacteria‐infected and HEL‐loaded DCs were co‐incubated with B cells from MD4 mouse. After conjugate formation, BacB cells were re‐isolated, and intracellular bacteria were detected by gentamicin survival assays at different times. Data were normalized compared to time 0. As control of the bacterial fitness, in parallel, HeLa cells were directly infected.
-
HWT B cells were allowed to form conjugates with Listeria‐infected DC, after 30 min samples were treated with the indicated inhibitors; Leupeptin + NH4Cl, pepstatin‐A + E64D, lactacystin, or PBS for controls. One hour later gentamicin was added to kill extracellular bacteria and 2 h later B cells were reisolated by negative selection, lysed and plated in agar‐containing plates. CFUs were counted; each colony represents one live intracellular bacterium inside B cells.
Data information: Column bars in the figure represent the mean of at least three independent experiments. Error bars indicate the SD. Significant differences, analyzed by t‐test (two samples) or one way ANOVA (more than two samples), are represented by asterisk; *P < 0.05, ***P < 0.0005, non‐significant differences are marked as (ns).
Source data are available online for this figure.
The process of bacterial capture by B cells from infected DC (transphagocytosis) was further quantified by classical gentamicin survival assays as described (Cruz‐Adalia et al, 2014). B cells, were re‐isolated 90 min after iDC/B cells conjugate formation. Gentamicin was added to the medium 30 min after cell–cell contacts and left for an additional 60 min to kill extracellular bacteria; under the conditions used, gentamicin does not permeate inside B cells. Then, B cells were lysed and the intracellular content was plated in BHI (Brain Heart Infusion) agar plates. After 48 h incubation at 37°C the bacterial colonies were counted, whereby each colony represented one live intracellular bacterium. Direct bacterial capture by B cells was used as negative control. The possible requirement of cell‐to‐cell contact was investigated using polycarbonate filter‐containing chambers of 3 μm pore size (Transwell) which impedes cellular contact between the iDCs and B cells, but allows the passage of bacteria. The possible role of BCR activation by their cognate antigen was tested by decorating (or not) the DC cells with HEL which is recognized by BCR of MD4 B cells.
B cells need physical contact with iDCs in order to capture bacteria (Fig 1D); in the presence of a physical barrier preventing cell‐to‐cell contact, but allowing bacterial dissemination, no bacterial capture was detected. BCR activation, by the presence of HEL at DC surface, is not necessary for bacterial capture (Fig EV1B and C, Movies EV2 and EV3), but increased about three‐fold the bacterial uptake compared with the absence of antigen at the time measured i.e. 90 min DC/B cells contacts (Fig 1D). B cells treated with a pharmacological inhibitor of dynamin, dynasore, before iDC/B co‐culture showed a decrease in bacteria capture (Fig 1E), indicating that transphagocytic process requires the cellular endocytic machinery. The treatment of B cells with dynasore does not impede DC/B cell immune contacts (Fig 1F).
Bacterial viability following capture by B cells was analyzed using gentamicin survival assays at different time intervals. The B cells rapidly killed the internalized bacteria (Fig 1G). Indeed, B cells destroyed more than 95% of the internalized L. monocytogenes in the first hour. As a control for the measure of bacterial fitness, L. monocytogenes infection of HeLa cells was monitored, and showed intracellular bacterial growth (Fig 1G). These combined results show that B cells capture bacteria by trans‐phagocytosis during contact with infected DCs and efficiently destroy the uptaken bacteria. The presence of leupeptin (inhibitor of cysteine, serine and threonine peptidases in lysosomes) and ammonium chloride (which inhibits the acidic degradation in the lysosomes) partially inhibit bacterial degradation by B cells (Fig 1H). Likewise, the combination of Pepstatin A and E64D, (inhibitors of Cathepsins D and B respectively) also partially inhibits bacteria degradation, suggesting that lysosome degradation plays an important role in intracellular bacterial clearance in B cells. On the contrary, the presence of proteasome inhibitor (lactacystin) does not impede bacterial degradation (Fig 1H). Our results matched with previous observations about the requirement of endosomal acidification, proteasomal processing and classical MHC class‐I/peptide transport for cross‐presentation by B cells (Robson et al, 2008).
In addition, supporting the active role played by B cells in bacterial capture, and ruling out the necessity of bacterial virulence factors in the transphagocytosis process, we observed that B cells are able to capture pathogen (L. monocytogenes) and non‐pathogen (Escherichia coli) bacteria (Fig EV1D).
B cells capturing bacteria establish mature immune synapses with naïve CD8 + T cells
We investigated whether B cells can process and cross‐present antigens from captured bacteria. The expression levels of co‐stimulatory molecules CD80 and CD86, which are necessary for effective antigen presentation, as well as MHC‐I (H‐2Kb haplotype) were analyzed in B cells after 24 h of iDC/B cells contacts. Co‐stimulatory molecules and H‐2Kb increased on the surface of B cells after L. monocytogenes uptake (Fig 2A–F).
Figure 2. L. monocytogenes capture instructs B cells to become antigen cross‐presenting cells.

-
A–DCD80 (A, B) and CD86 (C, D) expression in B cells measured by flow cytometry on day 0 (non‐instructed; naïve) and day 2 after L. monocytogenes capture (BacB). (A and C) show representative experiments, (B and D) show the mean of at least three independent experiments.
-
E, FH‐2Kb expression in B cells measured by flow cytometry on day 0 (naïve, pale gray) and day 1 after L. monocytogenes capture (BacB; dark gray). (E) Shows a representative experiment, (F) shows the mean of four independent experiments.
-
G, HExpression of OVAp‐I in the context of H‐2Kb was detected by flow cytometry with anti‐OVAp‐I/H‐2Kb antibody, comparing BacB capturing Listeria‐WT (pale gray) and Listeria‐OVA (dark gray). (G) Shows a representative experiment, (H) shows the mean of two independent experiments.
-
IConfocal images of Listeria‐WT (left panels) or Listeria‐OVA (right panels) BacB cells incubated with naïve OTI CD8+ T cells previously stained with CellTraceViolet (CV, red). Actin and CD3 fluorescence are shown on a “fire” scale and in cyan and white respectively in the merged images. Scale bars = 10 μm. *Indicate CD8+ T cells. Arrow points to the IS.
-
JQuantification of actin accumulation at the IS on CD8+ T cells conjugated with Listeria‐WT or Listeria‐OVA BacB cells, analyzed using Synapse measures software from confocal images. Each dot corresponds to one IS. Three independent experiments were performed.
Data information: Column bars in the figure represent the mean. Error bars indicate the SD. Significant differences, analyzed by t‐test are represented by asterisk; *P < 0.05, ***P < 0.0005, non‐significant differences are marked as (ns).
Source data are available online for this figure.
In order to quantify bacteria capture and antigen processing/presentation of bacteria antigens by B cells, we generated a L. monocytogenes strain that constitutively expressed ovalbumin (Listeria‐OVA). After 24 h of iDC/B cells contacts, the B cell population presented the OVA peptide SIINFEKL (OVA‐pI) on MHC class I (Fig 2G and H). These data indicated that by increasing the cell‐to‐cell contact time to 24 h, a large majority of B cells had captured bacteria, processed and presented bacterial antigens, i.e. OVA, indicating that bacteria capture and antigen cross‐presentation is a massive event.
The hallmark of naïve CD8+ T cell activation by the antigen presenter APC is the formation of a functional structure, formed at the cell‐to‐cell contact, which is termed immunological synapsis (IS; Dustin & Depoil, 2011). The IS refers to an area of intimate contact between T cells and APCs presenting antigens recognized specifically by the T cell receptor (TCR), where signals are coordinated, and integrated to support T cell activation. The mature IS architecture is commonly divided into areas known as Supra Molecular Activation Clusters (SMAC). The T Cell Receptor (TCR) and other signaling molecules accumulate in the central area of the SMAC (cSMAC). This cSMAC is surrounded by the peripheral SMAC (pSMAC) accumulating integrin LFA‐1 and massive quantities of F‐actin that is the signature of IS formation and the first step in CD8+ T cell activation (Huppa & Davis, 2003; Calabia‐Linares et al, 2011). Naïve CD8+ T cells isolated from OTI transgenic mice, which express a TCR that recognizes ovalbumin peptide (OVA‐pI 256–264; SIINFEKL) in the context of the H‐2Kb MHC‐I haplotype, were co incubated with B cells capturing either Listeria‐OVA or its isogenic wild‐type strain (Listeria‐WT). Immunofluorescence microscopy analysis confirmed that naïve OTI CD8+ T cells established mature IS when were in contact with B cells that have captured Listeria‐OVA but not when B cells captured Listeria‐WT (Fig 2I). When OTI CD8+ T cells contacted B cells that captured Listeria‐OVA the accumulation of CD3 and F‐actin were clearly visible at the IS (Fig 2I right panels) as well as the typical actin ring formed in the pSMAC (Movies [Link], [Link]). By contrast, when B cells have captured Listeria‐WT they rarely made contacts with OTI CD8+ T cells, and no sign of IS formation was detected (Fig 2I left panels). Quantification of actin accumulation at the IS using the plugin of imageJ “synapse measures” on confocal images (Calabia‐Linares et al, 2011), confirmed that B cells capturing Listeria‐OVA, but not B cells capturing Listeria‐WT induced massive actin polymerization on contact with naïve OTI CD8+ T cells (Fig 2J).
BacB cells cross‐present bacterial antigens, activating naïve CD8 + T cells
Antigen cross‐presentation is important for the activation of naïve CD8+ T cells and the generation of a cytotoxic response. It is widely believed that only some DCs subsets have the ability to cross‐present antigens. Contrary to this theory, several reports have shown that B cells can cross‐present external antigens. Coupling the TLR9 ligand CpG to OVA enhanced non‐cognate B cell endocytosis ability and promoted B cell activation. CpG‐OVA complex‐loaded B cells cross‐primed CD8 T cells in vivo (Heit et al, 2004). Using plasmid‐encode antigen as a DNA vaccination tool, Hon et al (2005) found that B cells mediate cross‐priming of antigen‐specific CD8+ T cells. Furthermore, BCR‐recognition of specific antigen drove an efficient antigen uptake and cross‐presentation in MHC class‐I, stimulating CD8+ T cells responses in vitro comparable to those ones elicited by bone marrow‐derived DCs (Robson et al, 2008). The authors used immune‐stimulating complexes where OVA and HEL proteins were incorporated to stimulate HEL‐specific B cells and, thus, the uptake of immune complexes triggered by cognate BCR/antigen interactions. Immunization studies indicated that HEL‐specific B cells have a major role in maintaining the clonal expansion of OVA‐specific CD8+ T cells (Robson et al, 2008). This study set up the groundwork of targeting B cells for promoting CD8+ T cell responses as a therapeutic tool. In agreement with these studies, mouse B cells have been shown to prime antigen specific cytotoxic response following DNA stimulation better than DCs in vivo (Colluru & McNeel, 2016). Besides, Mariño et al (2012) found in an autoimmune mouse model of diabetes that B cells cross‐present autoantigens to self‐reactive CD8+ T cells by MHC class‐I and BCR‐dependent mechanisms. Moreover, a previous study found that cross‐presentation of Salmonella antigens by B cells result in the activation of a CD8+ cytotoxic T cell response in vitro, requiring the help of CD4+ T cells. The mechanism of cross‐presentation of Salmonella antigens by B cells is however unknown (de Wit et al, 2010).
To assess the antigen‐crosspresenting capacity of B cells capturing bacteria, DCs were infected with either Listeria‐OVA or its isogenic wild‐type strain, Listeria‐WT. iDCs were cultivated together with non‐infected B cells overnight. Then, B cells were repurified by cell sorting (Fig EV2A) and tested for antigen presentation to naive OTI CD8+ T cells. Note that bacterial instruction requires at least 24 h and most of the DC died after 24 in the presence of Listeria (Fig EV2B), surprisingly B cells are more resistant. Flow cytometry analysis (Fig EV2C) of OTI CD8+ T cell proliferation showed a robust proliferation only when B cells have captured Listeria‐OVA (Fig 3A and B). OTI CD8+ T cells incubated with B cell that have captured Listeria‐WT did not proliferate (Fig 3A and B).
Figure EV2. Flow cytometry gating strategy.

- Purity of Listeria‐WT or Listeria‐OVA BacB cells after cell sorting. Size and complexity are shown by plotting side (SSC) versus forward‐scattered (FSC) light.
- Analysis of DC viability during B cells instruction. DC population was gated by size and complexity after 24 infected‐DC/B cells conjugates formation. Cell viability of DC population was further analyzed using Live/Dead Fixable Viability Near‐IR staining. More that 90% of the DC died during the instruction protocol.
- Gating strategy for flow cytometry analysis of CD8+ T cells. All cells, excluding debris, were taken by size and complexity. Then, excluded doblets and dead cells. CD8+ T cells were analyzed by antibody staining for IgM and CD8. CD8+ (IgM−) T cells population were further analyzed for CD25 expression and CellTrace Violet staining (proliferation).
Figure 3. BacB cells process antigens from captured bacteria and cross‐prime naïve CD8+ T cells.

-
ARepresentative experiments showing naïve OTI CD8+ T cell proliferation measured by flow citometry 1, 2 or 3 days after Listeria‐WT (top panels) or Listeria‐OVA (bottom) BacB cell contacts. The histograms show CellTrace Violet stain dilution (proliferation) corresponding to CD8+ T cell population (CD8+, IgM−). Non‐activated naïve CD8+ T cells (thin gray line) are shown as a negative proliferation control.
-
BMean of at least three experiments showing the % of naïve OTI CD8+ T cell proliferated after activation (days 1–3) with BacB capturing Listeria‐WT (WT) or Listeria OVA (OVA). Non‐activated, non‐proliferative CD8+ T cells (NP) are shown as control.
-
C, DCD25 expression in OTI CD8+ T cells on day 1 (light red), day 2 (red) and day 3 (dark red) after activation with Listeria‐WT (left panel) or Listeria‐OVA (right panel) BacB cells. FMO control is shown in gray and dash line. (C) Representative experient. (D) Mean of at least three independent experiments.
-
ERepresentative experiment showing OT‐I CD8+ T cells proliferation measured at day 3 after activation with OVAp‐I‐loaded BM‐DCs (left panel, light gray) or by polyclonal activation using CD3/CD28 antibodies (right panel, light gray) compared in parallel with Listeria‐OVA BacB‐mediated activaton (dark gray in both panels).
-
FMean of at least three experiments showing the % of naïve OTI CD8+ T cell proliferated after activation as in (D).
-
G, HProliferation of OTI CD8+ T cells activated with Listeria‐OVA BacB cells (H‐2Kb) that captured bacteria from infected H‐2Kb or H‐2Kk iBM‐DCs. Non‐activated naïve CD8+ T cells are shown (thin gray line). B cells were isoated from WT mice. (G) Shows a representative experiment, (H) shows the mean of the proliferation index from at least three independent experiments (relative to H‐2Kk iBM‐DCs donor cells).
-
IRelative specific cytotoxicity of effector CD8+ T cells (CTL) generated after activation with Listeria‐OVA BacB cells (black) or OVAp‐I‐loaded splenocytes (gray). Various OVA loaded EL‐4 (target cell):CTL ratios were measured. It is shown the mean of four independent experiments (biological replicates).
-
J–LIntracellular expression, measured by flow cytometry, of the indicated proteins in non‐activated, naïve, CD8+ T cells or in CD8+ T cells activated with either antiCD3 + antiCD28 antibodies (αCD3/CD28), OVA‐decorated splenocytes (OVA‐pI), or Listeria‐OVA BacB cells (BacB). The mean fluorescence intensity and the sd corresponding to three independent experiments is shown.
Data information: Column bars in the figure represent the mean of at least three independent experiments. Error bars indicate the SD. Statistical significant differences analyzed by one‐way ANOVA is represented by asterisk. *P < 0.05, ***P < 0.0005, non‐significant differences are marked as (ns).
Source data are available online for this figure.
Together, these results show that bacterial exposure “instructs” B cells (From now on termed bacteria instructed B cells; BacB) that acquire antigen cross‐presentation abilities, and confirmed the specificity of BacB‐mediated antigen cross‐presentation.
The activation of naïve OTI CD8+ T cells was confirmed by the upregulation of the activation marker CD25 (Fig 3C and D). This increase in CD25high OTI CD8+ T cell population was only observed when the APCs were BacB cells that have captured Listeria‐OVA (Listeria‐OVA BacB), but not when APCs were Listeria‐WT BacB cells. OTI CD8+ T cells that have been activated by Listeria‐OVA BacB cells, showed proliferations levels comparable, and even larger, than those generated by the positive controls of T cell proliferation, i.e. BM‐DC decorated with soluble OVA‐pI (as bacteria exposure damage BM‐DC, we used LPS‐activated, OVApI‐decorated DC to maximize its antigen presenting ability) and polyclonal T‐cell activation using anti CD3/CD28 antibodies (Fig 3E and F). Therefore, BacB‐mediated antigen presentation induce a potent activation of naïve CD8+ T cells. Likewise, BacB‐mediated CD8+ T cell activation was also observed using B cells isolated from WT mice in absence specific BCR activation (Fig EV3A and below throughout the manuscript) confirming that transphagocytosis and bacteria‐induced instruction does not require BCR engagement. We found no major differences in antigen cross‐presentation abilities of BacB cells from WT or MD4 mice (HEL‐activated). We decided, therefore, to use WT B cells which is a more physiological setting that MD4 B cells/HEL decorated DC.
Figure EV3. BacB‐mediated cross‐presentation.

- Representative experiment showing proliferation of CellTrace Violet‐stained OTI CD8+ T cells activated by WT BacB cells (orange). Non‐activated naïve CD8+ T cells are shown (gray).
- Representative experiment showing proliferation of CellTrace Violet‐stained OTI CD8+ T cells activated by WT upper panel or Tap1−/− BacB cells (lower panel). Non‐activated naïve CD8+ T cells are shown (gray).
- Represenatative confocal images showing actin accumulation (fire scale) at the IS in naïve OT‐I CD8+ T cells (stained with CellTrace Violet, red) contacting either Listeria‐OVA (upper panles) or E. coli‐OVA (lower panles) BacB cells. Scale bars = 10 μm.
- Cuantification of actin accumulation at the IS using Synapse measures. Each dot corresponds to one IS analaysis, data were collected from three independent experiments.
- Represenatative confocal images showing actin accumulation (fire scale) at the IS in naïve OT‐I CD8+ T cells (stained with CellTrace Violet, red) contacting either Listeria‐OVA (upper panels) or Listeria Δhly‐OVA (lower panels) BacB cells. Scale bars = 10 μm.
- cuantification of actin accumulation at the IS using Synapse measures. Each dot corresponds to one IS analaysis, data were collected from three independent experiments.
- Expression of LLO in the indicated bacterial strains, measured by Western blotting.
Data information: Bars in the figure represent the mean. Statistical significant differences, analyzed by t‐test are represented by asterisk; **P < 0.005, ***P < 0.0005, non‐significant differences are marked as (ns).
We further investigated whether BacB cells process endogenously bacterial antigens to induce CD8+ T cell proliferation, or whether BacB cells capture MHC molecules from DC during the trans‐phagocytosis process by trogocytosis (Schriek et al, 2022). OTI CD8+ T cells were incubated with Listeria‐OVA BacB cells (expressing H‐2Kb MHC‐I haplotype). In these experiments, the B cells captured bacteria from BM‐DCs expressing either H‐2Kb or H‐2Kk MCH‐I haplotypes. Note that OTI CD8+ T cells recognize OVAp in the context of H‐2Kb haplotype and therefore APCs expressing H‐2Kk are unable to activate OTI CD8+ T cells. OTI CD8+ T cell proliferation was similar in both conditions (Fig 3G and H), supporting the hypothesis that BacB cells are able to process antigens endogenously. In agreement, OTI CD8+ T cell proliferation was reduced when the antigen presentation was mediated by Tap1−/− BacB cells, compared to that observed when wild‐type BacB cells were used (Fig EV3B) indicating that BacB cells, similarly to what was observed in DC (Blander, 2018) and CD4+ T cells (Cruz‐Adalia et al, 2017), use the Tap‐dependent, canonical way (Barbet et al, 2021), as the major cross‐presentation pathway.
Finally, we tested whether BacB cell‐mediated antigen presentation induced the differentiation of naïve CD8+ T cells into cytotoxic effector cells. OTI CD8+ T cells cross‐primed with Listeria‐OVA BacB cells eliminated OVApI‐expressing EL‐4 lymphoma target cells (Lang et al, 2005) more efficiently than OT‐I CD8+ T cells activated by splenocytes (Fig 3I), highlighting the capacity of BacB cells to generate potent cytotoxic effector CD8+ T cells. In agreement with these data, BacB‐mediated activation of naïve CD8+ T triggers the expression granzyme B, perforin and interferon gamma IFN‐γ (Fig 3J–L), which are involved in the cytotoxic activity of CD8+ T cells (Tau et al, 2001), at similar and even higher levels than observed in CD8+ T cells activated by using anti CD3 and anti CD28 antibodies or by OVA‐decorated splenocytes (positive controls).
Together, these in vitro results show that bacteria capture by transphagocytosis is a source of antigens for BacB cells, that cross‐prime naïve CD8+ T cells, inducing their differentiation into effective cytotoxic T cells (CTLs).
Autophagy is necessary for bacteria‐mediated instruction of bacB cells
Autophagy has emerged as an important function in processing antigens presented via the major histocompatibility complex class I (MHC I) (English et al, 2009; Mintern et al, 2015; Parekh et al, 2017) and MCH II (Paludan et al, 2005; Schmid et al, 2007; Münz, 2016), as well as regarding the innate immune response to pathogens (Germic et al, 2019; Tao & Drexler, 2020). Pathogens and pathogen‐containing vacuoles can be marked by “eat‐me” signals that trigger the xenophagy, a type of non‐canonical autophagy that targets intracellular pathogens for lysosomal degradation (Gutierrez et al, 2004; Pilli et al, 2012; Wang et al, 2020). Studies of Listeria infection in non‐phagocytic cells as well as professional phagocytes have shown that intracellular L. monocytogenes triggers the cellular autophagy (Anand et al, 2011; Mitchell et al, 2018).
We analyzed whether bacteria described to trigger autophagy could be involved in the B cell instructing process using B cells isolated from WT mice. BacB cells capturing different bacteria were assessed for their APC capacity by measuring CD80 and H‐2Kb expression. B cells capturing E. coli (bacteria that do not trigger autophagy) expressed lower levels of H‐2Kb or CD80 than Listeria BacB cells (Fig 4A–D). Accordingly, E. coli‐OVA BacB cells were unable to form mature IS with OT‐I CD8+ T cells (Fig EV3C and D) neither induce the proliferation of OT‐I CD8+ T cells (Fig 4E and F).
Figure 4. The capture of bacteria described to trigger autophagy are necessary for cross‐presentation.

-
A–DSurface expression of H‐2Kb (A, B) and CD80 (C, D) in L. monocytogenes (orange) or E. coli (purple) BacB cells analyzed by flow cytometry. (A and C) panels show representative experiments, (B and D) panels show the mean of at least three independent experiments.
-
E, FOTI CD8+ T cells proliferation 3 days after activation with Listeria‐OVA (E, left panel, orange) or E. coli‐OVA (E, right panel, purple) BacB cells. Non‐activated naïve CD8+ T cells (gray) are shown as a negative proliferation control. (E) Panel show a representative experiment, (F) panel shows the proliferation index mean of at least three independent experiments.
-
G–JSurface expression of H‐2Kb (G, H) and CD80 (I, J) in L. monocytogenes (orange) or L. monocytogenes Δhly (blue) BacB cells analyzed by fow cytometry. (G and I) panels show a representative experiment, (H and J) panels show the mean of at least three independent experiments.
-
KRepresentative data showing OTI CD8+ T cells proliferation 3 days after activation with Listeria‐OVA (left panel, orange) or Listeria Δhly‐OVA (right panel, blue) BacB cells. Non‐activated naïve CD8+ T cells (gray) are shown as a negative proliferation controls.
-
LProliferation index mean of at least three experiments as in (K).
-
MRepresentative data showing OTI CD8+ T cells proliferation 3 days after activation with Listeria‐OVA (orange), Listeria Δhly‐OVA (blue) or Listeria Δhly::hly‐OVA BacB cells (Purple).
-
NProliferation index mean of at least three experiments as in (H).
Data information: All B cells were isolated from WT mice. Column bars in the figure represent the mean. Error bars indicate the SD. Statistical significant differences, analyzed by t‐test (two samples) or one way ANOVA (more than two samples), are represented by asterisk; *P < 0.05, **P < 0.005, ****P < 0.00005 non‐significant differences are marked as (ns).
Source data are available online for this figure.
There are obvious differences in PAMPs (Pathogen Associated Molecular Patterns) expression between E. coli and L. monocytogenes which are Gram− and Gram+ respectively. These bacteria show also very different behavior, being pathogen (L. monocytogenes) and non‐pathogen (E. coli).
Listerolysin O (LLO; encoding by the hly gene) is an essential virulent factor of L. monocytogenes which triggers cellular autophagy (Meyer‐Morse et al, 2010; Mitchell et al, 2018). We, therefore, also analyzed the antigen cross‐presenting abilities of BacB cells that have captured LLO‐deficient L. monocytogenes expressing OVA (Listeria Δhly OVA), and compared to what is observed using its isogenic WT strain. Listeria Δhly OVA BacB cells were unable to establish functional IS with naïve OTI CD8+ T (Fig EV3E and F) nor regulate CD80 or H‐2Kb expression (Fig 4G–J) or induce proliferation of naïve OT‐I CD8+ T cells (Fig 4K and L). Complementation assays allowing the expression of LLO in Listeria Δhly (ListeriaΔhly::hly OVA; Fig EV3G) show the recovery of the phenotype of Listeria‐OVA BacB cells. ListeriaΔhly::hly OVA BacB cells were able to efficiently activate OT‐I CD8+ T cells (Fig 4M and N).
In order to analyze the autophagic flux in BacB cells and to determine whether bacteria internalization triggers canonical or non‐canonical autophagy we followed the protocol as described in (Martinez‐Martin et al, 2017). Briefly, we measured by flow cytometry the accumulation of vesicular LC3 using bafilomycin A1 (BafA1) or chloroquine, two commonly used autophagy inhibitors, which block LC3 degradation differently. The total autophagy flux was revealed as the mean fluorescence intensity (MFI) after chloroquine treatment, the canonical autophagy flux was detected as the MFI after BafA1 treatment, and the noncanonical autophagy flux as the difference between total and canonical, normalized by the MFI of LC3 before inhibitor treatment. Listeria exposure triggered a three‐fold increase in non‐canonical autophagy in BacB cells, compared to non‐instructed B cells (Fig EV4A). This increase in non‐canonical autophagy that was not observed when using Listeria Δhly, which maintain levels similar to those observed in non‐instructed B cells (Fig EV4A). No differences were detected in any condition regarding canonical autophagy. Therefore Listeria‐mediated instruction promote both, the increase non‐canonical autophagy and antigen cross‐presentation in BacB cells.
Figure EV4. Role of non‐canonical autophagy in BacB‐mediated antigen cross‐presentation.

-
AAutophagy index (AI) measuring LC3 by flow cytometry. The total autophagy flux is defined as the mean fluorescence intensity (MFI) after chloroquine treatment, the canonical autophagy flux as the MFI after BafA1 treatment, and the noncanonical autophagy flux as the difference between the two normalized by the MFI of LC3 before inhibitor addition. The Bar charts show the mean of the Autophagic Index in non‐instructed B cells (B cells contacting non‐infected DC), and BacB cells instructed with either L. monocytogenes or L. monocytogenes Δhly, from three independent experiments. No statistical differences between the groups were noticed in canonical autophagy. The statistical differences between groups related to non‐canonical autophagy are shown; *P < 0.05. No statistical differences is marked as “ns”. AU, arbitrary units. Error bars indicate SEM.
-
B, COTI naïve CD8+ T cells proliferation 3 days after activation with either Listeria‐OVA Atg16l1f/f (WT) (orange) or Listeria‐OVA Atg16l1f/f KO (Atg16l1 KO) (green) BacB cells. OT‐I naïve CD8+ T cells proliferation was measured by CellTraceViolet stain dilution. (B) Representative data and (C) mean from at least three independent experiments.
-
DSurface expression of H‐2Kb at the cell surface of Listeria‐OVA Atg16l1f/f (WT) (orange) or Listeria‐OVA Atg16l1f/f KO (Atg16l1 KO) (green) BacB cells. Column bars shown the mean of three independent experiments.
-
EViability of Listeria‐OVA Atg16l1f/f (WT) (orange) or Atg16l1f/f KO (Atg16l1 KO) (green) BacB cells measured by flow cytometry. Column bars shown the mean of three independent experiments.
Data information: (B–E), Bars in the figure represent the mean and error bars the SD. Statistical significant differences, analyzed by t‐test are represented by asterisk; *P < 0.05, **P < 0.005, non‐significant differences are marked as (ns).
Source data are available online for this figure.
To further analyze whether Listeria‐induced autophagy plays a determinant role in B cell instruction, BacB mediated cross‐presentation was tested using B cells isolated from WT or its isogenic Atg16l1 KO mice (Conway et al, 2013). Deletion of Atg16l1 prevents the formation of the Atg12–Atg5‐Atg16 complex. This conserved complex is essential for lipidation of LC3 during canonical and non‐canonical autophagy, and consequently for autophagosome formation. Therefore, Atg16l1 is essential for autophagy induction (Walczak & Martens, 2013).
The antigen presentation ability of Listeria‐OVA BacB cells was tested using B cells isolated from WT or Atg16l1 KO mice. Naïve OTI CD8+ T cell proliferation was reduced drastically when the APC were Atg16l1 KO BacB cells (Fig EV4B and C). Acording to these data, H‐2Kb expression was also reduced in Atg16l1 KO BacB cells (Fig EV4D). Cell viability of Atg16l1 KO BacB cells was not reduced during the time of the experimentation (Fig EV4E). Together, these results show that non‐canonical autophagy, plays a major role in bacteria‐mediated antigen cross‐presentation by BacB cells.
BacB cells orchestrate cytotoxic responses in vivo
To further investigate the physiological role of BacB cell mediated antigen cross presentation in vivo, including its impact on CD8+ T cell differentiation and bacterial challenge resolution, adoptive transfer assays were performed using Rag1−/− host mice (lymphocyte‐deficient mice with intact innate immunity). The Rag1−/− mice were adoptively transferred with naïve CD8+ T cells from wild type C57BL/6J mice, expressing the natural TCR repertoire together with: no B cells (group 1), B cells from WT mice (group2), B cells from Atg16l1 KO mice (group 3) or B cells from B2m KO mice (defective in MHC‐I; group 4) (Fig 5A). Groups 3 and 4 were defective in antigen presentation. Mice from all groups were infected with a low (non‐lethal) dose of L. monocytogenes (103 bacteria per mouse) 1 day after cellular transfer. Four weeks after the first bacterial challenge, all mice were re‐challenged with sublethal dose (105 bacteria per mouse) of L. monocytogenes. The differentiation of CD8+ T cells in memory precursor effector cells (MPECs; CD127hi KLRG1lo), short‐lived effector cells (SLECs; CD127lo KLRG1hi) and early effector cells (EECs; CD127lo KLRG1lo) was analyzed 2 days after bacterial re‐challenge (Fig 5B–D). A significant increase in the EECs, a population with high plasticity described to increase after intracellular pathogen infections i.e. Listeria (Opata et al, 2015; Plumlee et al, 2015), was observed in the presence of WT B cells compared with the antigen presenting defective B cells.
Figure 5. BacB cells orchestrate protective cytotoxic responses in vivo .

-
AExperimental design to test the role of the antigen presenting ability of BacB cells to activate and differentiate naïve CD8+ T cells in the context of bacterial challenge.
-
B–DDifferentation of different CD8+ T cell populations ((B) early effector cells, EECs (CD127lo KLRG1lo); (C) memory precursor effector cells, MPECs (CD127hi KLRG1lo); (D) short‐lived effector cells, SLECs (CD127lo KLRG1hi)), gated on CD3+CD8+ T cells in the presence of the indicated B cells, 2 days after a second bacterial rechallenge (as indicated in A).
-
EL. monocytogenes load in liver 2 days after a second bacterial challenge (30 days after the first challege) in the presence of the indicated B cells.
-
FKaplan Meier survival curve of Rag1−/− mice after adoptive transfer and bacteria challenge.
-
GExperimental design to test whether BacB cell therapy could activate tumor‐recognizing CD8+ T cells that would fight against already implanted tumors in immunocopentent aimals.
-
HBacB cells reduce melanoma growth. B16 F10 melanoma cells (4 × 10⁵) were injected s.c. in the mid‐right flank of C57BL/6J (WT) host mice (4 mice/group; treated with BacB or untreated). Once tumors were formed and visible (6 days after imlantation) mice were treated with Listeria TRP2 BacB cells or with vehicle (PBS) (three consecutive injections in 3 days). Tumor growth were monitored every 1–3 days. It is shown the mean and the SD of the tumor volume in each group at the indicated time points. Mice with tumors ≥ 300 mm3 were sacrified.
-
IRepresentative tumors extracted 10 days post‐implantation from animals treated with Listeria‐TRP2 BacB cells or utreated (vehicle) controls.
Data information: Bars in the figure represent the mean. Error bars indicate the SD. Statistical significant differences, analyzed by ANOVA are represented by asterisk; *P < 0.05, **P < 0.005, ***P < 0.0005, ****P < 0.00005 non‐significant differences are marked as (ns).
Source data are available online for this figure.
These in vivo data confirm the active role of BacB dependent antigen cross‐presentation in CD8+ T cell differentiation after a Listeria challenge, and the role of autophagy in the BacB antigen cross‐presentation process.
In view of these data, we investigated whether BacB mediated antigen cross‐presentation plays a relevant role in controlling bacterial infections. Rag1−/− host mice were adoptively transferred with B cells from WT mice and Atg16l1 KO mice (antigen presentation‐defective). The control mice were not transferred with any B cells. All the mice were simultaneously transferred with naïve CD8+ T cells from wild type C57BL/6J mice, expressing the natural TCR repertoire. All groups were infected with a low (non‐lethal) dose of L. monocytogenes (103 bacteria per mouse) 1 day after cellular transfer. Three weeks after first bacterial challenge, all the mice were re‐challenged with a sublethal dose (105 bacteria per mouse) of L. monocytogenes. Two days after the bacterial re‐challenge, the bacterial load in the liver was quantified by colony counting (Fig 5E).
In the absence of the B cells only half of the mice effectively responded to the challenge, maintaining a bacterial load lower than 105 bacteria/g of liver, as a result of the action of their innate immunity and the CD8+ T cells primed by innate immune cells i.e. DC. This result mimics which was observed in the presence of B cells with deficient antigen presentation abilities (B cells from Atg16l1 KO mice). Conversely, in the presence of WT B cells, all mice (100%) were able to control the bacterial challenge. These data show that B cell‐dependent cross‐priming of CD8+ T cells improve the control of bacterial infections in vivo.
In addition, we tracked the survival of C57BL/6J mice during the time after they had been infected with a higher dose of Listeria. Note that in this experiment, we included an extra group which did not received any B, or CD8+ T lymphocytes. In the conditions tested, it seems that the best survival line was observed when Rag1−/− mice had been transferred with WT B cells which were able to cross‐present bacterial antigens, and naïve CD8+ T cells (Fig 5F). However, when the B cells were unable to present antigens to CD8+ T cells, the survival rate was very similar to that observed in the absence of B cells.
BacB cells as a potential antitumor immunotherapy
We have therefore described a pathway for bacterial antigen acquisition by B cells and shown that BacB‐mediated antigen cross‐presentation plays an important role in activating in vivo CD8+ T cells which are crucial for the improved control of intracellular bacterial infections. The “novel” abilities of BacB cells could have biomedical applications. For instance, the scientific community has striven to develop effective cellular immunotherapies based on T cell responses. Recent studies have shown that B and T cell infiltration correlate well with a with good prognosis in several cancers such as, melanoma, sarcoma or renal cell carcinoma (Nielsen et al, 2012; Garnelo et al, 2017; Edin et al, 2019; Cabrita et al, 2020; Helmink et al, 2020; Lu et al, 2020; Petitprez et al, 2020; Hu et al, 2021). Also, the ability of cross‐present antigens by B cells provides a prospective tool for cancer immunotherapy (Shin et al, 2016; Possamaï et al, 2021). These observations led to further investigations into whether BacB cells could be used in vivo as potential novel antitumor therapy. As a proof‐of‐concept experiment, we tested BacB cell therapy in a model of aggressive murine melanoma.
We engineered a recombinant strain of L. monocytogenes to express murine tyrosinase‐related protein‐2 (TRP‐2). TRP2 is a non‐mutated melanocyte‐derived differentiation antigen which is highly expressed in melanomas (Bloom et al, 1997). The rationale behind this investigation was that our previous data suggested that BacB cells might cross‐present TRP2 antigen and trigger CD8+ T cells responses against TRP2 expressing tumor cells.
B16 F10 melanoma cells were implanted subcutaneously in immune competent C57BL/6J mice. The mice were treated with the vehicle (PBS1x) or Listeria‐TRP2 BacB cells for 3 consecutive days, 6 days after tumor implantation, when the tumors were formed and clearly visible (Fig 5G). BacB cells treatment greatly reduced the melanoma tumor size (Fig 5H and I). This highlights BacB cells as potential novel tool for cancer immunotherapy.
Materials and Methods
Mice
Wild‐type (WT) C57BL/6J mice (RRID: IMSR_JAX:000664), C57BL/6‐Tg (TcraTcrb)1100Mjb/J OT‐I mice expressing TCR specific for OVA peptide 257–264 (SIINFEKL) in the context of H‐2Kb (RRID:IMSR_JAX:003831), C57BL/6J 129S7‐Rag1tm1Mom/J (Rag1−/−) mice, which lack B and T lymphocytes (RRID:IMSR_JAX:002216), were from Jackson Laboratory. C57BL/6‐Tg(IghelMD4)4Ccg/J (JAX stock #002595; Mason et al, 1992) MD4 mice expressing BCR specific for HEL were kindly provided by Dr. Yolanda Carrasco (CNB‐CSIC, Madrid), C57BL/6J 129S2‐Tap1tm1Arp/J (Tap1−/−) mice were kindly provided by Dr. Margarita del Val (CBM, Madrid). Atg16l1f/fKO and Atg16l1f/f mice (Conway et al, 2013) were kindly provided by Dra. Nuria Martín Martinez (CBM). Atg16l1f/f mice were used as WT mice in all experiments including Atg16l1 KO mice.
For Atg16l1 gene deletion, Atg16l1f/fKO mice and the corresponding controls Atg16l1f/f mice were treated with i.p. doses of 1 mg of Tamoxifen (Sigma) consecutively during 3 days. Seven days after the last dose, mice were treated with a unique booster dose of Tamoxifen. Six to seven days after the last dose, the animals were tested for effective gene deletion and used for experiments.
Male or female mice aged 8–12 weeks were used for experiments. Mice were maintained at the Centro Nacional de Biotecnología (CNB, Madrid) animal facilities and for some experiments in the SPF unit at the Centro Nacional de Investigaciones Cardiovasculares (CNIC, Madrid).
Experimental groups were assigned randomly and measurements made in a double‐blind manner.
Experimental procedures were approved by the Committee for Research Ethics of CNB‐CSIC and CNIC, and experiments were conducted in accordance with Spanish and EU guidelines. All procedures were approved by the Madrid local authority (project no PROEX 431/15).
Bacterial strains
Bacterial strains used were L. monocytogenes 10403S (Listeria‐WT) and L. monocytogenes 10403SΔhly (Listeria‐Δhly) that were kindly provided by Prof. DA. Portnoy (University of California). In this work, we generated Listeria‐OVA Listeria Δhly OVA and Listeria Δhly::hly OVA. The gene encoding for OVA was cloned in pPL2 insertion plasmid (Lauer et al, 2002) under the p60 promoter (generating pPL2OVA that was electroporated in L. monocytogenes 10403SΔhly or their isogenic L. monocytogenes 10403S). To recover LLO expression, OVA gene was cloned in pPL2 plasmid including the hly promoter and the gene part deleted in the 10403SΔhly strain (Riedel et al, 2007). LLO expression were checked by Western blotting (Fig EV3F). Bacteria were grown in brain‐heart infusion (BHI) medium (overnight, 37°C). E. coli K12 MG1655 were kindly provided by Dr. LA. Fernández‐Herrero (CNB‐CSIC). This strain was transformed with the pGEN22‐OVA plasmid to generate E. coli OVA. pGEN22 is a multicopy plasmid, containing a toxin‐antitoxin system that prevent plasmid elimination, therefore suitable for in vivo experiments. OVA gene was cloned under the constitutive pOmpC promoter. To generate the E. coli OVA, TSS transformation was followed (Chung et al, 1989). Once transformed, bacteria were grown at 37°C in LB supplemented with 100 μg/ml ampicillin. All bacteria samples were washed in PBS before used for the experiments.
Cells
Bone marrow dendritic cells (BM‐DCs) were generated as described (Inaba et al, 1992). Briefly, cells from mouse bone marrow were incubated with recombinant murine granulocyte–macrophage colony‐stimulating factor (rm‐GM‐CSF, 20 ng/ml) for 8–11 days, replacing the medium every 3 days. Maturation was induced the day before infection by adding to the medium 20 ng/ml lipopolysaccharide (LPS; overnight).
Primary conventional splenic B cells were obtained from single‐cell suspensions of spleen through negative selection with the MojoSort™ Mouse Pan B Cell Isolation Kit (Biolegend). Cell suspensions were incubated with the biotin antibody cocktail plus anti‐ biotinCD11b (BD) followed by incubation with magnetic Streptavidin Nanobeads. The magnetic labeled fraction, retained by the use of a magnetic separator, was discarded and the untouched B cells were collected from the supernatant for experiments.
To isolate naïve CD8+ T cells, splenic cell suspensions were incubated with the MojoSort™ mouse Naïve CD8+ T cell Isolation Kit (Biolegend) as described for B cells.
All cells, including cell lines EL‐4 lymphoma, HeLa and the B16 F10 melanoma were maintained at 37°C in RPMI 1640 medium (Fisher Scientific) supplemented with 10% fetal bovine serum (FBS), 0.1 U/ml penicillin, 0.1 mg/ml streptomycin (Lonza) and 0.05 mM 2‐mercaptoethanol, in a humid atmosphere with 5% CO2.
Reagents
OVAp‐I (OVA 257–264; SIINFEKL) was generated at Centro Nacional de Biotecnología (CNB‐CSIC, Madrid). Other reagents were: Hen Egg Lysozyme (HEL) (Sigma‐Aldrich), dynasore (Sigma‐Aldrich), chloroquine (Sigma‐Aldrich), mouse recombinant GM‐CSF (Peprotech), LPS (Sigma‐Aldrich), poly‐L‐lysine (Sigma‐Aldrich), Gentamicin (Sigma‐Aldrich).
Gentamicin survival assay
To determine the number of bacteria entering the cells, we followed the method as described (Cruz‐Adalia et al, 2014) with some modifications. BM‐DCs were infected with the indicated bacteria at MOI of 20 for 1 h at 37°C. Then the medium was washed three times with PBS to remove free extracellular bacteria. Later on, B cells were added (1:1 B/DC ratio) and after 30 min of B cell‐iDCs co‐culture, 100 μg/ml of gentamicin was added, and samples were incubated for an additional 1 h at 37°C (in the case of E. coli, 200 μg/ml of gentamicin were used). Then, samples were washed three times with PBS to remove the antibiotic and B cells were re‐isolated by either cell sorting or magnetic separation. Purified B cells were lysed with 0.05% Triton X‐100 (Sigma‐Aldrich) in distilled water. Dilutions were seeded in LB (E. coli) or BHI (L. monocytogenes) agar containing Petri dishes. Bacteria colonies were visualized and quantified one (E. coli) or 2 days (L. monocytogenes) later.
Bacterial instruction
Spleen purified B cells were added to plates containing previously washed, bacteria‐infected BM‐DCs. Three hours after DC/B‐cell contacts, gentamicin (100 μg/ml) was added to cultures and left O/N. Twenty‐four hours after cell co‐culture, B cells were purified by cell sorting (CD11c− IgM+; Fig EV2A) or negative selection kit and magnetic separator as indicated before. Purified B cells were considered BacB cells and used in different assays. B cells from MD4 mice and HEL‐decorated DC were used in experiments shown in Figs 1, 2, EV2, 3. As, transphagocytosis does not require BCR activation, experiments from Fig 3G to the end of the manuscript were performed using B cells from WT or the indicated animals, in absence HEL‐mediated BCR activation. Note that during B cells instruction process more that 90% of the DC died (Fig EV2B).
Immunofluorescence microscopy
B cells and infected BM‐DCs were co‐culture during the indicated times. Gentamicin was added to avoid extracellular bacterial growth. Samples were fixed with 4% paraformaldehyde in PBS after 30 min or 2 h of culture. B cells were prestained with CellTrace Violet.
BacB cells and naïve CD8+ T cells were allowed to form conjugates (2 h), then fixed with 4% paraformaldehyde in PBS. CD8+ T cells were prestained with CellTrace Violet.
Samples were permeabilized with 0.1% Triton X‐100 in PBS before staining with indicated antibodies (Table 1). F‐actin was detected using fluorescently tagged phalloidin. Samples were visualized by confocal microscopy (Leica TCS‐SP5; ×63 lens, controlled by Leica LAS AF). Images were analyzed with FIJI (ImageJ) software (NIH).
Table 1.
Antibodies used for immunofluorescence.
| Reactivity | Conjugated | Dilution | Source |
|---|---|---|---|
| CD3ζ | ‐ | 1:200 | Donated by Prof. B. Alarcon (CBM‐SO, Madrid) |
| L. monocytogenes | ‐ | 1:200 | AbD Serotec |
| E. coli | ‐ | 1:200 | AbD Serotec |
| L. monocytogenes | APC | 1:100 | Novus Biologicals |
| Phalloidin | Alexa Fluor 488 | 1:100 | Thermo Fisher Scientific |
| Phalloidin | TRITC | 1:100 | Thermo Fisher Scientific |
| Phalloidin | Alexa Fluor 660 | 1:100 | Thermo Fisher Scientific |
| LC3b | ‐ | 1:100 | Cell Signaling |
| Goat‐anti‐Rabbit | Alexa Fluor 488 | 1:200 | Thermo Fisher Scientific |
| Goat‐anti‐Rabbit | Alexa Fluor 546 | 1:200 | Thermo Fisher Scientific |
| Goat‐anti‐Rabbit | Alexa Fluor 647 | 1:200 | Thermo Fisher Scientific |
Quantification the actin accumulation at the IS
Cellular contacts between BacB cells and naïve CD8+ T cells were visualized by confocal microscopy as described above. In order to quantify the amount of actin accumulated at the IS, confocal images were analyzed using the plugin Synapse measures in ImageJ. Synapse measures accurately quantify the ratio between the immunofluorescence intensity of CD8+ T‐cell actin at the IS with that remained in the rest of the CD8+ T cell (and taking into account the actin present in the BacB cells and the background signal). A detailed description of the Synapse Measures program, including the algorithms used, is described in (Calabia‐Linares et al, 2011). The tutorial and the link to freely download the plugin are in this url: https://github.com/anaacayuela/SynapseMeasures.
CD8 + T‐cell proliferation assays
Cell sorter‐purified (or magnetic negatively isolated) BacB cells were incubated with naive OT‐I CD8+ T cells, previously stained with CellTrace Violet to quantify their proliferation by flow cytometry. In every cell division, the proliferating cells diluted the staining, observed as a shift to the left in the histogram; only live cells (negatively stained for 7AAD or Live/Dead Fixable Viability Near‐IR) were analyzed (Fig EV2C). As positive controls, OT‐I CD8+ T cells were incubated with OVAp‐I‐loaded BM‐DC or with antibodies activating CD3 (clone 17A2, eBioscience; 5 μg/ml, coated on plate) and CD28 (clone 37.51, BD Pharmingen, soluble 2 μg/ml).
Cytotoxicity assay
Effector cytotoxic CD8+ T cells were prepared from naïve CD8+ T cells isolated from spleen of OT‐I mice, and activated with Listeria‐OVA BacB cells, or with OVAp‐I‐loaded splenocytes as positive control, during 7 days.
EL‐4 cells were incubated alone or with 0.5 μM OVAp‐I for 1 h. After washing with PBS, OVAp‐I‐loaded EL‐4 cells were stained with 5 μM CellTrace Violet and unloaded EL‐4 cells with 0.5 μM CellTrace Violet. After washing with complete medium (with FBS), the populations were mixed and incubated with CTL at various ratios (5:1, 2:1, 1:1, 0.5:1 EL‐4:CTL; for 4 h). Next, they were analyzed by flow cytometry. Specific cytotoxicity was calculated as 1 − (% EL‐4 CellViolethigh/% EL‐4 CellVioletlow) × 100 (Lang et al, 2005). Relative cytotoxicity was calculated by subtracting the specific cytotoxicity of the negative control (EL‐4 cells incubated without CTL).
Western blotting
Proteins of bacteria or cell lysates were separated by standard procedures on SDS‐PAGE gels (Mini‐PROTEAN TGX, Biorad) and transferred onto Trans‐Blot Turbo PVDF membrane (Biorad). Membranes were blocked for 1 h in 5% BSA and then probed with the correspond antibodies (see Table 2).
Table 2.
Antibodies used for western blotting.
| Reactivity | Dilution | Source |
|---|---|---|
| LC3b | 1:1,000 | Cell Signaling |
| ERK | 1:200 | Santa Cruz |
| TRP2 | 1:200 | Santa Cruz |
| LLO | 1:3,000 | Diatheva |
| Rabbit‐HRP | 1:20,000 | Sigma‐Aldrich |
Autophagy flux
After bacteria‐instruction protocol, BacB cells were left untreated or incubated with chloroquine or bafilomycin for 2 h. After this time, cells were processed using Guava autophagy LC3 antibody‐based detection kit following manufacture instructions. Afterwards, vesicular LC3 levels were detected by flow cytometry and LC3 mean fluorescence levels were used to calculate total autophagy, non‐canonical autophagy and canonical autophagy relative levels as described in (Martinez‐Martin et al, 2017).
Anti‐tumor assay
B16 F10 melanoma cells (4 × 10⁵) were injected subcutaneously (s.c) into the mid‐right flank of C57BL/6J recipient mice and adoptively transferred with BacB cells as therapeutic treatment when tumors were already implanted and clearly visible (at days 6, 7 and 8). Mice were divided into two groups, control treated i.v. with PBS (group 1) and adoptively transferred i.v with 106 Listeria‐TRP2 BacB cells (group 2). Tumor growth were tracked every 2 days with a dial caliper. Experimental groups were assigned randomly and measurements made in a double‐blind manner.
Analysis of CD8 + T cell populations during Listeria infection
Rag‐1−/− recipient mice were divided into four experimental groups; mice were injected i.v. with PBS (Group 1), 5 × 10⁵ naïve CD8+ T cells from WT mice (Group 2), 5 × 10⁵ naïve CD8+ T cells from WT mice plus 106 B cells from Atg16l1f/f (WT) mice (Group 3), 5 × 10⁵ naïve CD8+ T cells from WT mice plus 106 B cells from Atg16l1f/f KO mice (Group 4). One day after cell transfer, L. monocytogenes was injected i.v. (103 bacteria per mouse). The mice received a second challenge 30 days later of 2 × 10⁵ L. monocytogenes; after 2 days, bacteria load in the liver were analyzed by bacteria platting and CFUs count. Moreover, splenocytes were stained with antibodies to CD8, CD3, CD127 and KLRG1 conjugated with several fluorochromes (see Table 3).
Table 3.
Antibodies and probes used for flow cytometry.
| Reactivity | Clone | Conjugated | Dilution | Source |
|---|---|---|---|---|
| CD19 | 6D5 | Allophycocyanin | 1:200 | Southern biotech |
| CD19 | 6D5 | Phycoerythrin | 1:200 | Southern biotech |
| IgM | Polyclonal | Fluorescein isothiocyanate | 1:100 | Southern biotech |
| CD8a | 53‐6.7 | Fluorescein isothiocyanate | 1:100 | Tonbo Biosciences |
| CD8a | 53‐6.7 | Phycoerythrin | 1:100 | BD Biosciences |
| CD25 | PC61.5 | Allophycocyanin | 1:200 | Tonbo Biosciences |
| CD3 | 145‐2C11 | PECy7 | 1:100 | Biolegend |
| CD5 | PercpCy5.5 | 1:100 | eBiosciences | |
| CD127 | A7R34 | Brillant Violet | 1:200 | Biolegend |
| KLRG1 | 2F1 | Allophycocyanin | 1:100 | BD Pharmigen |
| CD11c | N418 | Phycoerythrin | 1:200 | Tonbo Biosciences |
| IaIe | 2G9 | Fluorescein isothiocyanate | 1:200 | BD Biosciences |
| Gr‐1 | RB6‐8C5 | Allophycocyanin | 1:100 | Tonbo Biosciences |
| CD86 | Phycoerythrin | 1:100 | ||
| CD80 | GL‐1 | Phycoerythrin | 1:100 | Biolegend |
| H‐2Kb | AF6‐88.5 | Phycoerythrin | 1:100 | BD Biosciences |
| SIINFEKL/H‐2Kb | eBio25‐D1.16 | Allophycocyanin | 1:50 | eBioscience |
| IFNγ | XMG1.2 | Allophycocyanin | 1:100 | BD Pharmigen |
| LIVE/DEAD® Fixable Near‐IR Dead Cell Stain Kit | 750/775 | 1:1,000 | ThermoFisher | |
| CYTO‐ID® Autophagy detection kit | 488 | 1:1,000 | Enzo | |
| 7‐AAD Viability Staining Solution | 546/647 | 1:1,000 | eBiosciences | |
| CellTrace™ Violet | 415/516 | 1:1,000 | ThermoFisher | |
| Cell Proliferation Kit | ||||
| CD16/CD32 | 2.4 G2 | 1:200 | BD Bioscience |
Determination of live bacteria in the liver
As described above, 2 days after re‐challenge, harvested livers were individually weighed, placed in PBS and homogenized with ultra turrax homogenizer. The suspensions were serially diluted and plated on BHI agar plates and colonies counted after overnight incubation at 37°C. Bacterial load was expressed as CFU per gram of liver.
Statistical analysis
All statistical analyzes were performed using GraphPad Prism software. When analyzing more than two groups, we used one‐way analysis of variance (ANOVA), and multiple mean comparisons were corrected with Tukey post‐test. Student's t‐test was used when individual comparisons of the mean between two groups were performed. Differences were considered significant at P‐value = 0.05. Data are shown in column bars representing the mean ± SD of at least three independent experiments unless otherwise indicated.
Author contributions
Raquel García‐Ferreras: Data curation; formal analysis; supervision; validation; investigation; visualization; methodology; writing – original draft. Jesús Osuna‐Pérez: Investigation; methodology. Guillermo Ramírez‐Santiago: Supervision; validation; investigation; methodology. Almudena Méndez‐Pérez: Supervision; investigation; methodology. Andrés M Acosta‐Moreno: Methodology. Lara Del Campo: Methodology. María J Gómez‐Sánchez: Methodology. Marta Iborra: Methodology. Beatriz Herrero‐Fernández: Methodology. José M González‐Granado: Methodology. Francisco Sánchez‐Madrid: Investigation. Yolanda R Carrasco: Supervision; validation; writing – review and editing. Patricia Boya: Supervision; writing – review and editing. Nuria Martínez‐Martín: Validation; investigation; methodology; writing – review and editing. Esteban Veiga: Conceptualization; resources; data curation; formal analysis; supervision; funding acquisition; validation; investigation; visualization; methodology; writing – original draft; project administration; writing – review and editing.
Disclosure and competing interests statement
The authors declare that they have no conflict of interest.
Supporting information
Expanded View Figures PDF
Movie EV1
Movie EV2
Movie EV3
Movie EV4
Movie EV5
Movie EV6
Source Data for Expanded View
PDF+
Source Data for Figure 1
Source Data for Figure 2
Source Data for Figure 3
Source Data for Figure 4
Source Data for Figure 5
Acknowledgements
We are grateful to advanced light microscopy and cytometry facilities of CNB for technical supporting. The research is supported by grants: SAF2017‐84091‐R, and PID2020‐116393RB‐I00/AEI/10.13039/501100011033, financed by MCIN, BFERO2020.04, financed by FERO foundation and PI20/0036 from ISCIII. RGF is supported by BES‐2016‐076526 from the Spanish Ministry of Economy Industry and Competitiveness, JOP is supported by fellowship LCF/BQ/SO16/52270012 from La Caixa, BHF is supported by FPU18/00895 and AMP by FPU18/03199 from Ministry of Science, Innovation and Universities. LdC has been supported by Juan de la Cierva grant IJC2018‐035386‐I and a contract associated to SEV‐2017‐0712. EVC, AMP, AMAM, and NMM belong to the Spanish National Research Council (CSIC)'s Cancer Hub. Synopsis image made with biorender.com by Eduardo Román Camacho and Esteban Veiga. We thanks Prof. Dan Portnoy who kindly provided bacterial strains.
EMBO reports (2023) 24: e56131
Data availability
No data have been deposited in public repositories.
References
- Akkaya M, Kwak K, Pierce SK (2020) B cell memory: building two walls of protection against pathogens. Nat Rev Immunol 20: 229–238 [DOI] [PMC free article] [PubMed] [Google Scholar]
- Allen CDC, Okada T, Tang HL, Cyster JG (2007) Imaging of germinal center selection events during affinity maturation. Science 315: 528–531 [DOI] [PubMed] [Google Scholar]
- Alloatti A, Kotsias F, Pauwels A‐M, Carpier J‐M, Jouve M, Timmerman E, Pace L, Vargas P, Maurin M, Gehrmann U et al (2015) Toll‐like receptor 4 engagement on dendritic cells restrains phago‐lysosome fusion and promotes cross‐presentation of antigens. Immunity 43: 1087–1100 [DOI] [PubMed] [Google Scholar]
- Anand PK, Tait SWG, Lamkanfi M, Amer AO, Nunez G, Pagès G, Pouysségur J, McGargill MA, Green DR, Kanneganti T‐D (2011) TLR2 and RIP2 pathways mediate autophagy of Listeria monocytogenes via extracellular signal‐regulated kinase (ERK) activation. J Biol Chem 286: 42981–42991 [DOI] [PMC free article] [PubMed] [Google Scholar]
- Barbet G, Nair‐Gupta P, Schotsaert M, Yeung ST, Moretti J, Seyffer F, Metreveli G, Gardner T, Choi A, Tortorella D et al (2021) TAP dysfunction in dendritic cells enables noncanonical cross‐presentation for T cell priming. Nat Immunol 22: 497–509 [DOI] [PMC free article] [PubMed] [Google Scholar]
- Blander JM (2018) Regulation of the cell biology of antigen cross‐presentation. Annu Rev Immunol 36: 717–753 [DOI] [PMC free article] [PubMed] [Google Scholar]
- Bloom MB, Perry‐Lalley D, Robbins PF, Li Y, El‐Gamil M, Rosenberg SA, Yang JC (1997) Identification of tyrosinase‐related protein 2 as a tumor rejection antigen for the B16 melanoma. J Exp Med 185: 453–459 [DOI] [PMC free article] [PubMed] [Google Scholar]
- Cabrita R, Lauss M, Sanna A, Donia M, Skaarup Larsen M, Mitra S, Johansson I, Phung B, Harbst K, Vallon‐Christersson J et al (2020) Tertiary lymphoid structures improve immunotherapy and survival in melanoma. Nature 577: 561–565 [DOI] [PubMed] [Google Scholar]
- Calabia‐Linares C, Robles‐Valero J, de la Fuente H, Perez‐Martinez M, Martín‐Cofreces N, Alfonso‐Pérez M, Gutierrez‐Vázquez C, Mittelbrunn M, Ibiza S, Urbano‐Olmos FR et al (2011) Endosomal clathrin drives actin accumulation at the immunological synapse. J Cell Sci 124: 820–830 [DOI] [PubMed] [Google Scholar]
- Campisi L, Soudja SM, Cazareth J, Bassand D, Lazzari A, Brau F, Narni‐Mancinelli E, Glaichenhaus N, Geissmann F, Lauvau G (2011) Splenic CD8α+ dendritic cells undergo rapid programming by cytosolic bacteria and inflammation to induce protective CD8+ T‐cell memory. Eur J Immunol 41: 1594–1605 [DOI] [PubMed] [Google Scholar]
- Canton J, Blees H, Henry CM, Buck MD, Schulz O, Rogers NC, Childs E, Zelenay S, Rhys H, Domart M‐C et al (2021) The receptor DNGR‐1 signals for phagosomal rupture to promote cross‐presentation of dead‐cell‐associated antigens. Nat Immunol 22: 140–153 [DOI] [PMC free article] [PubMed] [Google Scholar]
- Carrasco YR, Batista FD (2007) B cells acquire particulate antigen in a macrophage‐rich area at the boundary between the follicle and the subcapsular sinus of the lymph node. Immunity 27: 160–171 [DOI] [PubMed] [Google Scholar]
- Cerovic V, Houston SA, Westlund J, Utriainen L, Davison ES, Scott CL, Bain CC, Joeris T, Agace WW, Kroczek RA et al (2015) Lymph‐borne CD8α+ dendritic cells are uniquely able to cross‐prime CD8+ T cells with antigen acquired from intestinal epithelial cells. Mucosal Immunol 8: 38–48 [DOI] [PMC free article] [PubMed] [Google Scholar]
- Chávez‐Arroyo A, Portnoy DA (2020) Why is Listeria monocytogenes such a potent inducer of CD8+ T‐cells? Cell Microbiol 22: e13175 [DOI] [PMC free article] [PubMed] [Google Scholar]
- Chung CT, Niemela SL, Miller RH (1989) One‐step preparation of competent Escherichia coli: transformation and storage of bacterial cells in the same solution. Proc Natl Acad Sci USA 86: 2172–2175 [DOI] [PMC free article] [PubMed] [Google Scholar]
- Colluru VT, McNeel DG (2016) B lymphocytes as direct antigen‐presenting cells for anti‐tumor DNA vaccines. Oncotarget 7: 67901–67918 [DOI] [PMC free article] [PubMed] [Google Scholar]
- Conway KL, Kuballa P, Song J‐H, Patel KK, Castoreno AB, Yilmaz OH, Jijon HB, Zhang M, Aldrich LN, Villablanca EJ et al (2013) Atg16l1 is required for autophagy in intestinal epithelial cells and protection of mice from Salmonella infection. Gastroenterology 145: 1347–1357 [DOI] [PMC free article] [PubMed] [Google Scholar]
- Crotty S (2019) T follicular helper cell biology: a decade of discovery and diseases. Immunity 50: 1132–1148 [DOI] [PMC free article] [PubMed] [Google Scholar]
- Cruz‐Adalia A, Ramirez‐Santiago G, Calabia‐Linares C, Torres‐Torresano M, Feo L, Galán‐Díez M, Fernández‐Ruiz E, Pereiro E, Guttmann P, Chiappi M et al (2014) T cells kill bacteria captured by transinfection from dendritic cells and confer protection in mice. Cell Host Microbe 15: 611–622 [DOI] [PubMed] [Google Scholar]
- Cruz‐Adalia A, Ramirez‐Santiago G, Osuna‐Pérez J, Torres‐Torresano M, Zorita V, Martínez‐Riaño A, Boccasavia V, Borroto A, Martínez Del Hoyo G, González‐Granado JM et al (2017) Conventional CD4+ T cells present bacterial antigens to induce cytotoxic and memory CD8+ T cell responses. Nat Commun 8: 1591 [DOI] [PMC free article] [PubMed] [Google Scholar]
- de Wit J, Souwer Y, Jorritsma T, Klaasse Bos H, ten Brinke A, Neefjes J, van Ham SM (2010) Antigen‐specific B cells reactivate an effective cytotoxic T cell response against phagocytosed salmonella through cross‐presentation. PLoS One 5: e13016 [DOI] [PMC free article] [PubMed] [Google Scholar]
- Dustin ML, Depoil D (2011) New insights into the T cell synapse from single molecule techniques. Nat Rev Immunol 11: 672–684 [DOI] [PMC free article] [PubMed] [Google Scholar]
- Edin S, Kaprio T, Hagström J, Larsson P, Mustonen H, Böckelman C, Strigård K, Gunnarsson U, Haglund C, Palmqvist R (2019) The prognostic importance of CD20+ B lymphocytes in colorectal cancer and the relation to other immune cell subsets. Sci Rep 9: 19997 [DOI] [PMC free article] [PubMed] [Google Scholar]
- English L, Chemali M, Duron J, Rondeau C, Laplante A, Gingras D, Alexander D, Leib D, Norbury C, Lippé R et al (2009) Autophagy enhances the presentation of endogenous viral antigens on MHC class I molecules during HSV‐1 infection. Nat Immunol 10: 480–487 [DOI] [PMC free article] [PubMed] [Google Scholar]
- Fleire SJ, Goldman JP, Carrasco YR, Weber M, Bray D, Batista FD (2006) B cell ligand discrimination through a spreading and contraction response. Science 312: 738–741 [DOI] [PubMed] [Google Scholar]
- Gao J, Ma X, Gu W, Fu M, An J, Xing Y, Gao T, Li W, Liu Y (2012) Novel functions of murine B1 cells: active phagocytic and microbicidal abilities. Eur J Immunol 42: 982–992 [DOI] [PubMed] [Google Scholar]
- Garnelo M, Tan A, Her Z, Yeong J, Lim CJ, Chen J, Lim KH, Weber A, Chow P, Chung A et al (2017) Interaction between tumour‐infiltrating B cells and T cells controls the progression of hepatocellular carcinoma. Gut 66: 342–351 [DOI] [PMC free article] [PubMed] [Google Scholar]
- Garside P, Ingulli E, Merica RR, Johnson JG, Noelle RJ, Jenkins MK (1998) Visualization of specific B and T lymphocyte interactions in the lymph node. Science 281: 96–99 [DOI] [PubMed] [Google Scholar]
- Gaspar M, May JS, Sukla S, Frederico B, Gill MB, Smith CM, Belz GT, Stevenson PG (2011) Murid herpesvirus‐4 exploits dendritic cells to infect B cells. PLoS Pathog 7: e1002346 [DOI] [PMC free article] [PubMed] [Google Scholar]
- Germic N, Frangez Z, Yousefi S, Simon H‐U (2019) Regulation of the innate immune system by autophagy: monocytes, macrophages, dendritic cells and antigen presentation. Cell Death Differ 26: 715–727 [DOI] [PMC free article] [PubMed] [Google Scholar]
- Gonzalez SF, Lukacs‐Kornek V, Kuligowski MP, Pitcher LA, Degn SE, Kim Y‐A, Cloninger MJ, Martinez‐Pomares L, Gordon S, Turley SJ et al (2010) Capture of influenza by medullary dendritic cells via SIGN‐R1 is essential for humoral immunity in draining lymph nodes. Nat Immunol 11: 427–434 [DOI] [PMC free article] [PubMed] [Google Scholar]
- Gordon S (2016) Phagocytosis: an immunobiologic process. Immunity 44: 463–475 [DOI] [PubMed] [Google Scholar]
- Gutierrez MG, Master SS, Singh SB, Taylor GA, Colombo MI, Deretic V (2004) Autophagy is a defense mechanism inhibiting BCG and Mycobacterium tuberculosis survival in infected macrophages. Cell 119: 753–766 [DOI] [PubMed] [Google Scholar]
- Heit A, Huster KM, Schmitz F, Schiemann M, Busch DH, Wagner H (2004) CpG‐DNA aided cross‐priming by cross‐presenting B cells. J Immunol 172: 1501–1507 [DOI] [PubMed] [Google Scholar]
- Helmink BA, Reddy SM, Gao J, Zhang S, Basar R, Thakur R, Yizhak K, Sade‐Feldman M, Blando J, Han G et al (2020) B cells and tertiary lymphoid structures promote immunotherapy response. Nature 577: 549–555 [DOI] [PMC free article] [PubMed] [Google Scholar]
- Holl V, Xu K, Peressin M, Lederle A, Biedma ME, Delaporte M, Decoville T, Schmidt S, Laumond G, Aubertin A‐M et al (2010) Stimulation of HIV‐1 replication in immature dendritic cells in contact with primary CD4 T or B lymphocytes. J Virol 84: 4172–4182 [DOI] [PMC free article] [PubMed] [Google Scholar]
- Hon H, Oran A, Brocker T, Jacob J (2005) B lymphocytes participate in cross‐presentation of antigen following gene gun vaccination. J Immunol 174: 5233–5242 [DOI] [PubMed] [Google Scholar]
- Hu Q, Hong Y, Qi P, Lu G, Mai X, Xu S, He X, Guo Y, Gao L, Jing Z et al (2021) Atlas of breast cancer infiltrated B‐lymphocytes revealed by paired single‐cell RNA‐sequencing and antigen receptor profiling. Nat Commun 12: 2186 [DOI] [PMC free article] [PubMed] [Google Scholar]
- Huppa JB, Davis MM (2003) T‐cell‐antigen recognition and the immunological synapse. Nat Rev Immunol 3: 973–983 [DOI] [PubMed] [Google Scholar]
- Inaba K, Inaba M, Romani N, Aya H, Deguchi M, Ikehara S, Muramatsu S, Steinman RM (1992) Generation of large numbers of dendritic cells from mouse bone marrow cultures supplemented with granulocyte/macrophage colony‐stimulating factor. J Exp Med 176: 1693–1702 [DOI] [PMC free article] [PubMed] [Google Scholar]
- Khanna KM, McNamara JT, Lefrançois L (2007) In situ imaging of the endogenous CD8 T cell response to infection. Science 318: 116–120 [DOI] [PMC free article] [PubMed] [Google Scholar]
- Krocova Z, Plzakova L, Pavkova I, Kubelkova K, Macela A, Ozanic M, Marecic V, Mihelcic M, Santic M (2020) The role of B cells in an early immune response to Mycobacterium bovis . Microb Pathog 140: 103937 [DOI] [PubMed] [Google Scholar]
- Lang D, Lu MM, Huang L, Engleka KA, Zhang M, Chu EY, Lipner S, Skoultchi A, Millar SE, Epstein JA (2005) Pax3 functions at a nodal point in melanocyte stem cell differentiation. Nature 433: 884–887 [DOI] [PubMed] [Google Scholar]
- Lauer P, Chow MYN, Loessner MJ, Portnoy DA, Calendar R (2002) Construction, characterization, and use of two Listeria monocytogenes site‐specific phage integration vectors. J Bacteriol 184: 4177–4186 [DOI] [PMC free article] [PubMed] [Google Scholar]
- Levine LS, Hiam‐Galvez KJ, Marquez DM, Tenvooren I, Madden MZ, Contreras DC, Dahunsi DO, Irish JM, Oluwole OO, Rathmell JC et al (2021) Single‐cell analysis by mass cytometry reveals metabolic states of early‐activated CD8+ T cells during the primary immune response. Immunity 54: 829–844 [DOI] [PMC free article] [PubMed] [Google Scholar]
- Li J, Barreda DR, Zhang Y‐A, Boshra H, Gelman AE, Lapatra S, Tort L, Sunyer JO (2006) B lymphocytes from early vertebrates have potent phagocytic and microbicidal abilities. Nat Immunol 7: 1116–1124 [DOI] [PubMed] [Google Scholar]
- Liu W, Wang H, Xu C (2016) Antigen receptor nanoclusters: small units with big functions. Trends Immunol 37: 680–689 [DOI] [PubMed] [Google Scholar]
- Lu Y, Zhao Q, Liao J‐Y, Song E, Xia Q, Pan J, Li Y, Li J, Zhou B, Ye Y et al (2020) Complement signals determine opposite effects of B cells in chemotherapy‐induced immunity. Cell 180: 1081–1097 [DOI] [PubMed] [Google Scholar]
- Mariño E, Tan B, Binge L, Mackay CR, Grey ST (2012) B‐cell cross‐presentation of autologous antigen precipitates diabetes. Diabetes 61: 2893–2905 [DOI] [PMC free article] [PubMed] [Google Scholar]
- Martinez‐Martin N, Maldonado P, Gasparrini F, Frederico B, Aggarwal S, Gaya M, Tsui C, Burbage M, Keppler SJ, Montaner B et al (2017) A switch from canonical to noncanonical autophagy shapes B cell responses. Science 355: 641–647 [DOI] [PMC free article] [PubMed] [Google Scholar]
- Martínez‐Riaño A, Bovolenta ER, Mendoza P, Oeste CL, Martín‐Bermejo MJ, Bovolenta P, Turner M, Martínez‐Martín N, Alarcón B (2018) Antigen phagocytosis by B cells is required for a potent humoral response. EMBO Rep 19: e46016 [DOI] [PMC free article] [PubMed] [Google Scholar]
- Mason DY, Jones M, Goodnow CC (1992) Development and follicular localization of tolerant B lymphocytes in lysozyme/anti‐lysozyme IgM/IgD transgenic mice. Int Immunol 4: 163–175 [DOI] [PubMed] [Google Scholar]
- Mattila PK, Feest C, Depoil D, Treanor B, Montaner B, Otipoby KL, Carter R, Justement LB, Bruckbauer A, Batista FD (2013) The actin and tetraspanin networks organize receptor nanoclusters to regulate B cell receptor‐mediated signaling. Immunity 38: 461–474 [DOI] [PubMed] [Google Scholar]
- Menon A, Shroyer M, Wampler J, Chawan C, Bhunia A (2003) In vitro study of Listeria monocytogenes infection to murine primary and human transformed B cells. Comp Immunol Microbiol Infect Dis 26: 157–174 [DOI] [PubMed] [Google Scholar]
- Meyer‐Morse N, Robbins JR, Rae CS, Mochegova SN, Swanson MS, Zhao Z, Virgin HW, Portnoy D (2010) Listeriolysin O is necessary and sufficient to induce autophagy during Listeria monocytogenes infection. PLoS One 5: e8610 [DOI] [PMC free article] [PubMed] [Google Scholar]
- Mintern JD, Macri C, Chin WJ, Panozza SE, Segura E, Patterson NL, Zeller P, Bourges D, Bedoui S, McMillan PJ et al (2015) Differential use of autophagy by primary dendritic cells specialized in cross‐presentation. Autophagy 11: 906–917 [DOI] [PMC free article] [PubMed] [Google Scholar]
- Mitchell G, Cheng MI, Chen C, Nguyen BN, Whiteley AT, Kianian S, Cox JS, Green DR, McDonald KL, Portnoy DA (2018) Listeria monocytogenes triggers noncanonical autophagy upon phagocytosis, but avoids subsequent growth‐restricting xenophagy. Proc Natl Acad Sci USA 115: E210–E217 [DOI] [PMC free article] [PubMed] [Google Scholar]
- Münz C (2016) Autophagy beyond intracellular MHC class II antigen presentation. Trends Immunol 37: 755–763 [DOI] [PubMed] [Google Scholar]
- Natkanski E, Lee W‐Y, Mistry B, Casal A, Molloy JE, Tolar P (2013) B cells use mechanical energy to discriminate antigen affinities. Science 340: 1587–1590 [DOI] [PMC free article] [PubMed] [Google Scholar]
- Nielsen JS, Sahota RA, Milne K, Kost SE, Nesslinger NJ, Watson PH, Nelson BH (2012) CD20+ tumor‐infiltrating lymphocytes have an atypical CD27− memory phenotype and together with CD8+ T cells promote favorable prognosis in ovarian cancer. Clin Cancer Res 18: 3281–3292 [DOI] [PubMed] [Google Scholar]
- Nutt SL, Hodgkin PD, Tarlinton DM, Corcoran LM (2015) The generation of antibody‐secreting plasma cells. Nat Rev Immunol 15: 160–171 [DOI] [PubMed] [Google Scholar]
- Ochando JC, Homma C, Yang Y, Hidalgo A, Garin A, Tacke F, Angeli V, Li Y, Boros P, Ding Y et al (2006) Alloantigen‐presenting plasmacytoid dendritic cells mediate tolerance to vascularized grafts. Nat Immunol 7: 652–662 [DOI] [PubMed] [Google Scholar]
- Opata MM, Carpio VH, Ibitokou SA, Dillon BE, Obiero JM, Stephens R (2015) Early effector cells survive the contraction phase in malaria infection and generate both central and effector memory T cells. J Immunol 194: 5346–5354 [DOI] [PMC free article] [PubMed] [Google Scholar]
- Paludan C, Schmid D, Landthaler M, Vockerodt M, Kube D, Tuschl T, Münz C (2005) Endogenous MHC class II processing of a viral nuclear antigen after autophagy. Science 307: 593–596 [DOI] [PubMed] [Google Scholar]
- Parekh VV, Pabbisetty SK, Wu L, Sebzda E, Martinez J, Zhang J, Van Kaer L (2017) Autophagy‐related protein Vps34 controls the homeostasis and function of antigen cross‐presenting CD8α+ dendritic cells. Proc Natl Acad Sci USA 114: E6371–E6380 [DOI] [PMC free article] [PubMed] [Google Scholar]
- Petitprez F, de Reyniès A, Keung EZ, Chen TW‐W, Sun C‐M, Calderaro J, Jeng Y‐M, Hsiao L‐P, Lacroix L, Bougoüin A et al (2020) B cells are associated with survival and immunotherapy response in sarcoma. Nature 577: 556–560 [DOI] [PubMed] [Google Scholar]
- Pilli M, Arko‐Mensah J, Ponpuak M, Roberts E, Master S, Mandell MA, Dupont N, Ornatowski W, Jiang S, Bradfute SB et al (2012) TBK‐1 promotes autophagy‐mediated antimicrobial defense by controlling autophagosome maturation. Immunity 37: 223–234 [DOI] [PMC free article] [PubMed] [Google Scholar]
- Plumlee CR, Obar JJ, Colpitts SL, Jellison ER, Haining WN, Lefrancois L, Khanna KM (2015) Early effector CD8 T cells display plasticity in populating the short‐lived effector and memory‐precursor pools following bacterial or viral infection. Sci Rep 5: 12264 [DOI] [PMC free article] [PubMed] [Google Scholar]
- Possamaï D, Pagé G, Panès R, Gagnon É, Lapointe R (2021) CD40L‐stimulated B lymphocytes are polarized toward APC functions after exposure to IL‐4 and IL‐21. J Immunol 207: 77–89 [DOI] [PubMed] [Google Scholar]
- Prokopec KE, Georgoudaki A‐M, Sohn S, Wermeling F, Grönlund H, Lindh E, Carroll MC, Karlsson MCI (2016) Cutting edge: marginal zone macrophages regulate antigen transport by B cells to the follicle in the spleen via CD21. J Immunol 197: 2063–2068 [DOI] [PubMed] [Google Scholar]
- Qi H, Egen JG, Huang AYC, Germain RN (2006) Extrafollicular activation of lymph node B cells by antigen‐bearing dendritic cells. Science 312: 1672–1676 [DOI] [PubMed] [Google Scholar]
- Ren H, Zhang T, Wang Y, Yao Q, Wang Z, Zhang L, Wang L (2021) Tumor‐derived autophagosomes (DRibbles) activate human B cells to induce efficient antigen‐specific human memory T‐cell responses. Front Immunol 12: 675822 [DOI] [PMC free article] [PubMed] [Google Scholar]
- Riedel CU, Monk IR, Casey PG, Morrissey D, O'Sullivan GC, Tangney M, Hill C, Gahan CGM (2007) Improved luciferase tagging system for Listeria monocytogenes allows real‐time monitoring in vivo and in vitro . Appl Environ Microbiol 73: 3091–3094 [DOI] [PMC free article] [PubMed] [Google Scholar]
- Robson NC, Donachie AM, Mowat AM (2008) Simultaneous presentation and cross‐presentation of immune‐stimulating complex‐associated cognate antigen by antigen‐specific B cells. Eur J Immunol 38: 1238–1246 [DOI] [PubMed] [Google Scholar]
- Roozendaal R, Mempel TR, Pitcher LA, Gonzalez SF, Verschoor A, Mebius RE, von Andrian UH, Carroll MC (2009) Conduits mediate transport of low‐molecular‐weight antigen to lymph node follicles. Immunity 30: 264–276 [DOI] [PMC free article] [PubMed] [Google Scholar]
- Rosales‐Reyes R, Pérez‐López A, Sánchez‐Gómez C, Hernández‐Mote RR, Castro‐Eguiluz D, Ortiz‐Navarrete V, Alpuche‐Aranda CM (2012) Salmonella infects B cells by macropinocytosis and formation of spacious phagosomes but does not induce pyroptosis in favor of its survival. Microb Pathog 52: 367–374 [DOI] [PubMed] [Google Scholar]
- Sánchez‐Paulete AR, Teijeira A, Cueto FJ, Garasa S, Pérez‐Gracia JL, Sánchez‐Arráez A, Sancho D, Melero I (2017) Antigen cross‐presentation and T‐cell cross‐priming in cancer immunology and immunotherapy. Ann Oncol 28: xii44–xii55 [DOI] [PubMed] [Google Scholar]
- Schmid D, Pypaert M, Münz C (2007) Antigen‐loading compartments for major histocompatibility complex class II molecules continuously receive input from autophagosomes. Immunity 26: 79–92 [DOI] [PMC free article] [PubMed] [Google Scholar]
- Schriek P, Ching AC, Moily NS, Moffat J, Beattie L, Steiner TM, Hosking LM, Thurman JM, Holers VM, Ishido S et al (2022) Marginal zone B cells acquire dendritic cell functions by trogocytosis. Science 375: eabf7470 [DOI] [PubMed] [Google Scholar]
- Shin C‐A, Cho H‐W, Shin A‐R, Sohn H‐J, Cho H‐I, Kim T‐G (2016) Co‐expression of CD40L with CD70 or OX40L increases B‐cell viability and antitumor efficacy. Oncotarget 7: 46173–46186 [DOI] [PMC free article] [PubMed] [Google Scholar]
- Souwer Y, Griekspoor A, de Wit J, Martinoli C, Zagato E, Janssen H, Jorritsma T, Bar‐Ephraïm YE, Rescigno M, Neefjes J et al (2012) Selective infection of antigen‐specific B lymphocytes by Salmonella mediates bacterial survival and systemic spreading of infection. PLoS One 7: e50667 [DOI] [PMC free article] [PubMed] [Google Scholar]
- Suzuki K, Grigorova I, Phan TG, Kelly LM, Cyster JG (2009) Visualizing B cell capture of cognate antigen from follicular dendritic cells. J Exp Med 206: 1485–1493 [DOI] [PMC free article] [PubMed] [Google Scholar]
- Tao S, Drexler I (2020) Targeting autophagy in innate immune cells: angel or demon during infection and vaccination? Front Immunol 11: 460 [DOI] [PMC free article] [PubMed] [Google Scholar]
- Tau GZ, Cowan SN, Weisburg J, Braunstein NS, Rothman PB (2001) Regulation of IFN‐gamma signaling is essential for the cytotoxic activity of CD8+ T cells. J Immunol 167: 5574–5582 [DOI] [PMC free article] [PubMed] [Google Scholar]
- Vidard L, Kovacsovics‐Bankowski M, Kraeft SK, Chen LB, Benacerraf B, Rock KL (1996) Analysis of MHC class II presentation of particulate antigens of B lymphocytes. J Immunol 156: 2809–2818 [PubMed] [Google Scholar]
- Waite JC, Leiner I, Lauer P, Rae CS, Barbet G, Zheng H, Portnoy DA, Pamer EG, Dustin ML (2011) Dynamic imaging of the effector immune response to listeria infection in vivo . PLoS Pathog 7: e1001326 [DOI] [PMC free article] [PubMed] [Google Scholar]
- Walczak M, Martens S (2013) Dissecting the role of the Atg12‐Atg5‐Atg16 complex during autophagosome formation. Autophagy 9: 424–425 [DOI] [PMC free article] [PubMed] [Google Scholar]
- Wang Y‐T, Zaitsev K, Lu Q, Li S, Schaiff WT, Kim K‐W, Droit L, Wilen CB, Desai C, Balce DR et al (2020) Select autophagy genes maintain quiescence of tissue‐resident macrophages and increase susceptibility to Listeria monocytogenes . Nat Microbiol 5: 272–281 [DOI] [PMC free article] [PubMed] [Google Scholar]
- Wculek SK, Cueto FJ, Mujal AM, Melero I, Krummel MF, Sancho D (2020) Dendritic cells in cancer immunology and immunotherapy. Nat Rev Immunol 20: 7–24 [DOI] [PubMed] [Google Scholar]
- Wu T, Guan J, Handel A, Tscharke DC, Sidney J, Sette A, Wakim LM, Sng XYX, Thomas PG, Croft NP et al (2019) Quantification of epitope abundance reveals the effect of direct and cross‐presentation on influenza CTL responses. Nat Commun 10: 2846 [DOI] [PMC free article] [PubMed] [Google Scholar]
- Yang J, Reth M (2010) The dissociation activation model of B cell antigen receptor triggering. FEBS Lett 584: 4872–4877 [DOI] [PubMed] [Google Scholar]
- You Y, Myers RC, Freeberg L, Foote J, Kearney JF, Justement LB, Carter RH (2011) Marginal zone B cells regulate antigen capture by marginal zone macrophages. J Immunol 186: 2172–2181 [DOI] [PMC free article] [PubMed] [Google Scholar]
- Yuseff M‐I, Reversat A, Lankar D, Diaz J, Fanget I, Pierobon P, Randrian V, Larochette N, Vascotto F, Desdouets C et al (2011) Polarized secretion of lysosomes at the B cell synapse couples antigen extraction to processing and presentation. Immunity 35: 361–374 [DOI] [PubMed] [Google Scholar]