

Abstract
Aims/hypothesis
Genetic mapping has identified over 20 loci contributing to genetic risk of type 2 diabetes. The next step is to identify the genes and mechanisms regulating the contributions of genetic risk to disease. The goal of this study was to evaluate the effect of age, height, weight and risk alleles on expression of candidate genes in diabetes-associated regions in three relevant human tissues.
Methods
We measured transcript abundance for WFS1, KCNJ11, TCF2 (also known as HNF1B), PPARG, HHEX, IDE, CDKAL1, CDKN2A, CDKN2B, IGF2BP2, SLC30A8 and TCF7L2 by quantitative RT-PCR in human pancreas (n=50), colon (n=195) and liver (n=50). Tissue samples were genotyped for single nucleotide polymorphisms (SNPs) associated with type 2 diabetes. The effects of age, height, weight, tissue and SNP on RNA expression were tested by linear modelling.
Results
Expression of all genes exhibited tissue bias. Immunohistochemistry confirmed the findings for HHEX, IDE and SLC30A8, which showed strongest tissue-specific mRNA expression bias. Neither age, height nor weight were associated with gene expression. We found no evidence that type 2 diabetes-associated SNPs affect neighbouring gene expression (cis-expression quantitative trait loci) in colon, pancreas and liver.
Conclusions/interpretation
This study provides new evidence that tissue-type, but not age, height, weight or SNPs in or near candidate genes associated with increased risk of type 2 diabetes are strong contributors to differential gene expression in the genes and tissues examined.
Keywords: Colon, eQTL, HHEX, IDE, Liver, mRNA, Pancreas, SLC30A8, SNP, Type 2 diabetes
Introduction
Type 2 diabetes is a common disease with significant risk heritability. Over 20 loci in the human genome have been identified in the past few years as underlying this risk [1]. Attention is now being focused on translating these findings into understanding mechanisms of pathogenesis. Functional genomic experiments are an effective approach to elucidating biological mechanisms. One of the most popular strategies is expression quantitative trait locus (eQTL) analysis, where genetic effects on transcript levels are mapped to regions of the genome. If disease associated variants affect RNA abundance, this may represent a mechanism through which the genetic variant regulates the disease phenotype [2]. Studies determining whether genetic variants, height, weight and age may be associated with RNA abundance in tissues relevant to type 2 diabetes are lacking. Furthermore, information on translation from DNA to where the protein is produced within a tissue is also lacking.
In the present study, we investigated whether genetic variants robustly associated with type 2 diabetes also modulate expression levels of candidate genes nearby. We measured transcript abundance of eleven such genes (IDE, CDKAL1, CDKN2A, CDKLN2B, IGF2BP2, SLC30A8, TCF7L2, HHEX, TCF2 [also known as HNF1B], KCNJ11, PPPARG and WFS1) by RT-PCR in three relevant human tissues (colon, liver and pancreas) and correlated expression levels to tissue, age at sampling, height, weight and genotype. We chose three human tissues in which genes near the loci associated with increased risk may be influencing the risk of disease. Pancreas was chosen given the evidence to date of a role for these genes in insulin secretion [1, 3]. Colon was chosen as a second representative neuroendocrine tissue, given the presence of incretins released from the gut, including glucagon-like peptide-1, glucagon-like peptide-2 and gastric inhibitory polypeptide. Liver was chosen on the basis of its gluconeogenic properties. Our current understanding of developmental biology in endoderm morphogenesis, and genes and signalling pathways that control transitions to epithelium also supported a decision to study colon and liver.
Methods
Tissue procurement, DNA and RNA
Institutional Review Board approval was obtained from the University of Minnesota to obtain de-identified colon, liver and pancreas specimens from the University of Minnesota Cancer Center Tissue Procurement Facility as described [4]. Sex, age, ancestry, height and weight of tissue donors were provided in the pathology report with each tissue sample (summarised in Table 1). A summary of individual diagnoses recorded with the procurement of each tissue is listed by tissue type in Electronic supplementary material (ESM) Table 1. More than 95% of the tissues analysed in this study were from people of European descent, with less than 5% (13 of 295 samples) procured from African-Americans, Native Americans and individuals of Asian descent.
Table 1.
Clinical characteristics of study samples
| Characteristics | Colon | Liver | Pancreas |
|---|---|---|---|
|
| |||
| Men (n)a | 80 | 24 | 24 |
| Women (n)a | 65 | 23 | 25 |
| Age (years)b | 58.2±17.2 | 56.0±12.7 | 54.3±16.2 |
| Height (m)c | 1.69±1.03 | 1.70±1.12 | 1.70±9.62 |
| Weight (kg)d | 80.1±26.1 | 76.2±18.2 | 82.9±27.2 |
| BMI (kg/m2)d | 28.06±9.42 | 26.19±5.25 | 28.50±8.51 |
Unless otherwise indicated, values are means ± SD
Donor sex was available for 145 colon, 47 liver and 49 pancreas tissue samples
Donor age was available for 144 colon, 47 liver and 49 pancreas tissue samples
Donor height was available for 102 colon, 40 liver and 39 pancreas tissue samples
Donor weight and BMI were available for 101 colon, 40 liver and 39 pancreas tissue samples
All samples were histopathologically normal (non-cancerous) according to pathology reports.
DNA was extracted from frozen tissue specimens using a kit (DNeasy; Qiagen, Gaithersburg, MD, USA). Samples were genotyped by primer extension with matrix-assisted laser desorption ionisation-time of flight mass spectroscopy using a Sequenom platform (San Diego, CA, USA) as described by Saxena et al. [3]. Genotyped single nucleotide polymorphisms (SNPs) are listed in Table 2. These provided too few markers to perform any ancestry analysis in our samples. Instead, we compared the minor allele frequencies (MAF) with those for the Centre d’Etude du Polymorphisme (Utah residents with northern and western European ancestry) (CEU) population of the HapMap project [5] and found good concordance (0.2–8.0% deviation from CEU) across the majority of genotyped SNPs, with the exception of rs10757278, which varied dramatically from CEU (2% MAF compared with 50% in CEU). rs10757278 was one of two SNPs examined for CDKN2B (the other being rs10811661, for which the MAF in samples in this study were similar to those reported for the CEU population of the HapMap project).
Table 2.
Gene, sample size, covariate associations and eQTL analysis
| Gene | Sample size (n) | Covariate association (p values) | eQTL analysisa | ||||||
|---|---|---|---|---|---|---|---|---|---|
|
|
|
||||||||
| Age | Height | Weight | Tissue | SNP | p value | MAF | Detectable effect sizeb | ||
|
| |||||||||
| IGF2BP2 | 86 | 0.64 | 0.14 | 0.92 | 8.84×10⁻¹² | rs4402960 | 0.87 | 0.33 | 24 |
| rs1470579 | 0.82 | 0.30 | 24 | ||||||
| CDKAL1 | 229 | 0.24 | 0.30 | 0.41 | <2×10⁻¹⁶ | NA | - | - | - |
| SLC30A8 | 60 | 0.80 | 0.98 | 0.95 | <2×10⁻¹⁶ | rs11558471 | 0.55 | 0.35 | 33 |
| CDKN2B | 229 | 0.05 | 0.48 | 0.47 | <2×10⁻¹⁶ | rs10757278 | 0.46 | 0.06 | 10 |
| rs10811661 | 0.36 | 0.30 | 10 | ||||||
| IDE | 182 | 0.51 | 0.12 | 0.82 | <2×10⁻¹⁶ | rs1111875 | 0.80 | 0.39 | 13 |
| TCF7L2 | 217 | 0.83 | 0.46 | 0.94 | 3.82×10⁻¹⁴ | rs7903146 | 0.65 | 0.20 | 10 |
| KCNJ11 | 141 | 0.54 | 0.67 | 0.51 | <2×10⁻¹⁶ | NA | - | - | - |
| PPARG | 140 | 0.28 | 0.40 | 0.99 | <2×10⁻¹⁶ | rs1801282 | 0.64 | 0.13 | 16 |
| TCF2 | 144 | 0.53 | 0.82 | 0.63 | 9.62×10⁻¹⁵ | rs4430796 | 0.28 | 0.50 | 15 |
| HHEX | 49 | 0.69 | 0.81 | 0.84 | NA | rs1111875 | 0.66 | 0.39 | 40 |
| WFS1 | 142 | 0.63 | 0.66 | 0.37 | <2×10⁻¹⁶ | NA | - | - | - |
Includes other covariates
Per cent of variance that must be explained by each SNP allele to have 95% power at p=0.001
NA not available
Total RNA was extracted with RNeasy (Qiagen) from frozen tissue specimens and treated with DNAse (Qiagen) according to the manufacturer’s protocols. RNA was reverse-transcribed to cDNA using a kit (SuperScript III; Invitrogen, Carlsbad, CA, USA) according to the manufacturer’s directions. All quantitative RT-PCR reactions were performed on a sequence detection system (7900; Applied Biosystems, Foster City, CA, USA). All Taqman expression assays were purchased from Applied Biosystems. Taqman expression assays included: IGF2BP2, UniGene Hs.35354, Hs01118016_m1; CDKAL1, UniGene Hs.657604, Hs00214949_m1; SLC30A8, UniGene Hs.532270, Hs00545182_m1; CDKN2A/B, UniGene Hs.512599/UniGene Hs.72901, Hs_00793225_m1; IDE, UniGene Hs.500546, Hs00971002_m1; TCF7L2, UniGene Hs.593995, Hs01009053_m1; KCNJ11, UniGene Hs.248141, Hs00265026_s1; PPARG, UniGene Hs.162646, Hs01115513_m1; TCF2, UniGene Hs.191144, Hs01001602_m1; HHEX, UniGene Hs.118651, Hs00242160_m1; and WFS1, UniGene Hs.518602, Hs00903605_m1. Expression of all assays was normalised to cyclophilin A (PPIA Taqman expression assay ID Hs03045993_gH) according to the Δ crossing threshold (Ct) method or relative quantification. Technical duplicates were completed with different genes for normalisation (HPRT and cyclophilin A) resulting in a correlation coefficient of 0.8377. A correlation of replicates of Ct values for a series of pancreas and liver samples performed by the operator on the days of the analyses with the same reagents produced a Pearson correlation coefficient of 0.9927.
Method for immunohistochemistry
Paraffin-embedded sections were mounted on slides (Super Frost Plus; Fisher Scientific, Pittsburgh, PA, USA). Sections were deparaffinised, rehydrated and washed in 0.1 mmol/l PBS, pH 7.2. Sections were treated for antigen retrieval with citrate buffer and by microwaving for 20 min at 95°C. Sections were cooled and endogenous peroxidase was blocked by incubating tissue sections in 3% H2O2 (vol./vol.) for 30 min at ambient temperature. Sections were washed, encircled with a PAP pen and incubated in normal serum for 30 min. Excess serum was removed, and primary antibody applied and the sections incubated overnight at 4°C. Biotinylated secondary antibody was applied for 30 min, the sections washed and the final 3,3′-diaminobenzidine substrate applied for 30 min. Sections were developed using a Vector nickel enhanced method. Antibodies included: insulin-degrading enzyme (IDE) (MA1-91428; Thermo Fisher Scientific, Rockford, IL, USA), haemopoietically expressed homeobox protein (HHEX) (AB4134; Chemicon Millipore, Billerica, MA, USA) and solute carrier family 30 (zinc transporter), member 8 (SLC30A8) (4481.00.02; SDIx, Newark, DE, USA).
Statistical analysis
For eQTL analysis we used the lm function in R to perform linear modelling including tissue type (as a categorical variable) (http://r-project.org, accessed 6 December 2010), age, height and weight (as continuous variables) on each set of ΔCt gene expression measurements. SNPs were then added as additional covariates. When assessing significance, we corrected for testing 11 genes. We used Genetic Power Calculator [6] to calculate detectable effect sizes, asking, for each SNP, which proportion of variance of a quantitative trait would have to be explained for us to have 95% power to detect that effect at p=0.001.
Results
Candidate type 2 diabetes genes exhibit differential expression in colon, liver and pancreas
We found that tissue-specific expression of all genes differed across cell types (Fig. 1, Table 2). Gene expression values are shown in Fig. 1 as ΔCt (high ΔCt indicates greater expression). HHEX expression was only detected in pancreas. Immunostaining localised HHEX in pancreas to islets, exocrine acini and ductal epithelial cells (Fig. 2). HHEX staining in liver parenchyma and colonic epithelium revealed little to no immunoreactivity, confirming the mRNA expression data (Fig. 2). IDE mRNA was expressed only in pancreas and colon. Immunostaining for IDE in the pancreas was localised to exocrine acinar cells, islets and ductal epithelial cells (Fig. 3). IDE staining in liver was localised only to the epithelia of bile canaliculi, with no staining found in the hepatic parenchyma and moderate staining found in colonic epithelial cells (Fig. 3). IDE mRNA expression in liver was below the level of detection. SLC30A8 expression was highest in the pancreas, with less expression in liver. Immunostaining for SLC30A8 localised expression in the pancreas to islets, acini and ductal epithelial cells (Fig. 4). Little immunoreactivity was seen in the liver, and that seen was not in hepatic parenchyma and appeared to be localised to fat-storing cells (Fig. 4). No staining was found in the colon (Fig. 4). Expression of IGF2BP2 was detected in all tissues; however, with the expression assays used, abundance in colon was low (data not shown). The remaining genes, WFS1, KCNJ11, TCF2, PPARG, CDKAL1, CDKN2A, CDKN2B and TCF7L2, were detected at markedly different levels in all three tissues.
Fig. 1.

Expression of six (a) and five (b) type 2 diabetes candidate genes in three tissues: colon (C), liver (L) and pancreas (P). A positive ΔCt indicates higher expression levels. ΔCt values for the candidate genes were measured by RT-PCR. (a) Expression of WFS1, KCNJ11, TCF2, PPARG, HHEX and CDKAL1. (b) Expression of CDKN2B, IDE, IGF2BP2, SLC30A8 and TCF7L2. (c) Expression of cyclophilin (control) in each tissue. We note that not only are the majority of genes expressed at different levels in each tissue (including non-expression), but that the pattern of expression across tissues varies for each gene, suggesting that complex tissue-specific processes set final expression levels. The black horizontal bar of each box plot indicates the median, and the ends or hinges of the box depict quartiles 1 and 3 of the data. The whiskers depict the farthest points not considered outliers (within 3/2 the interquartile range). Points outside the whiskers are deemed outliers
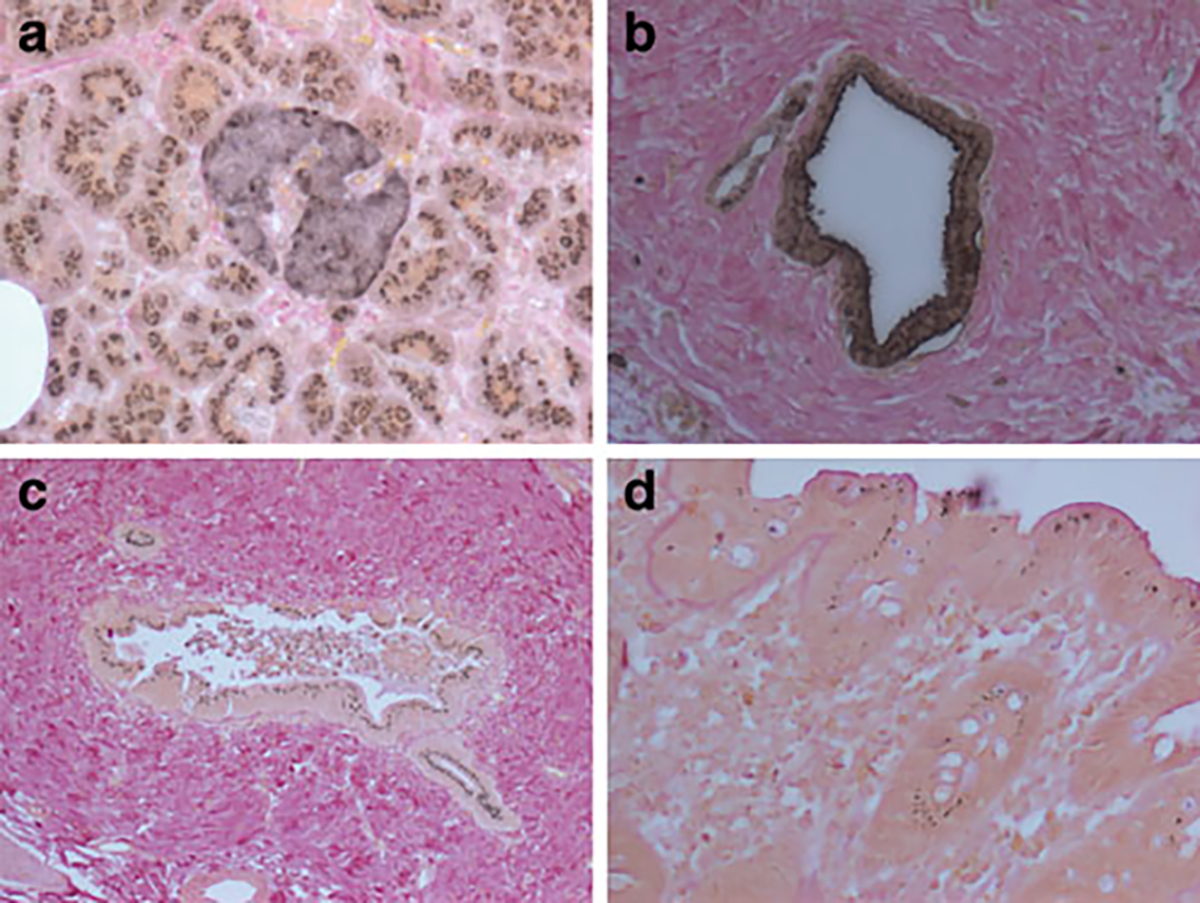
Fig. 2.
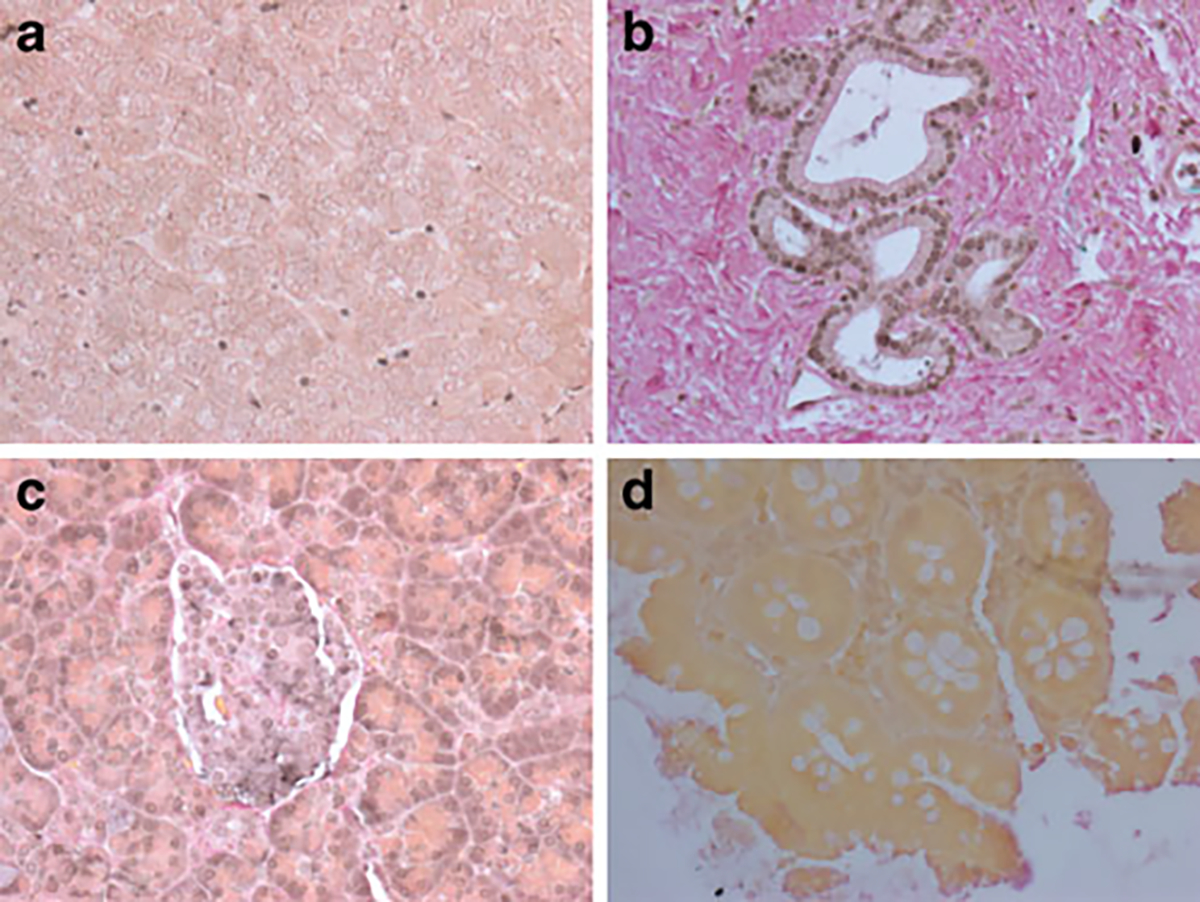
Immunohistochemical localisation of HHEX. Moderate to strong immunoreactivity was found in pancreatic acini and islets (a). Localisation was nuclear and cytoplasmic. Pancreatic ducts (b) exhibited moderate, exclusively nuclear staining. Liver parenchyma (c) and colonic epithelia (d) showed little immunoreactivity or staining
Fig. 3.
Immunohistochemical localisation of IDE. Robust immunoreactivity was found in exocrine acinar cells as well as in islets (a). Acini exhibited a subnuclear punctate pattern within the cytoplasmic compartment, while islet cells had a more diffuse staining. Pancreatic ductal epithelia (b) exhibited a stain that contained punctate as well as diffuse cytoplasmic staining. In the liver (c) only the epithelia of bile canaliculi stained positive. The punctate subnuclear staining pattern for IDE was also found in colonic epithelia (d)
Fig. 4.
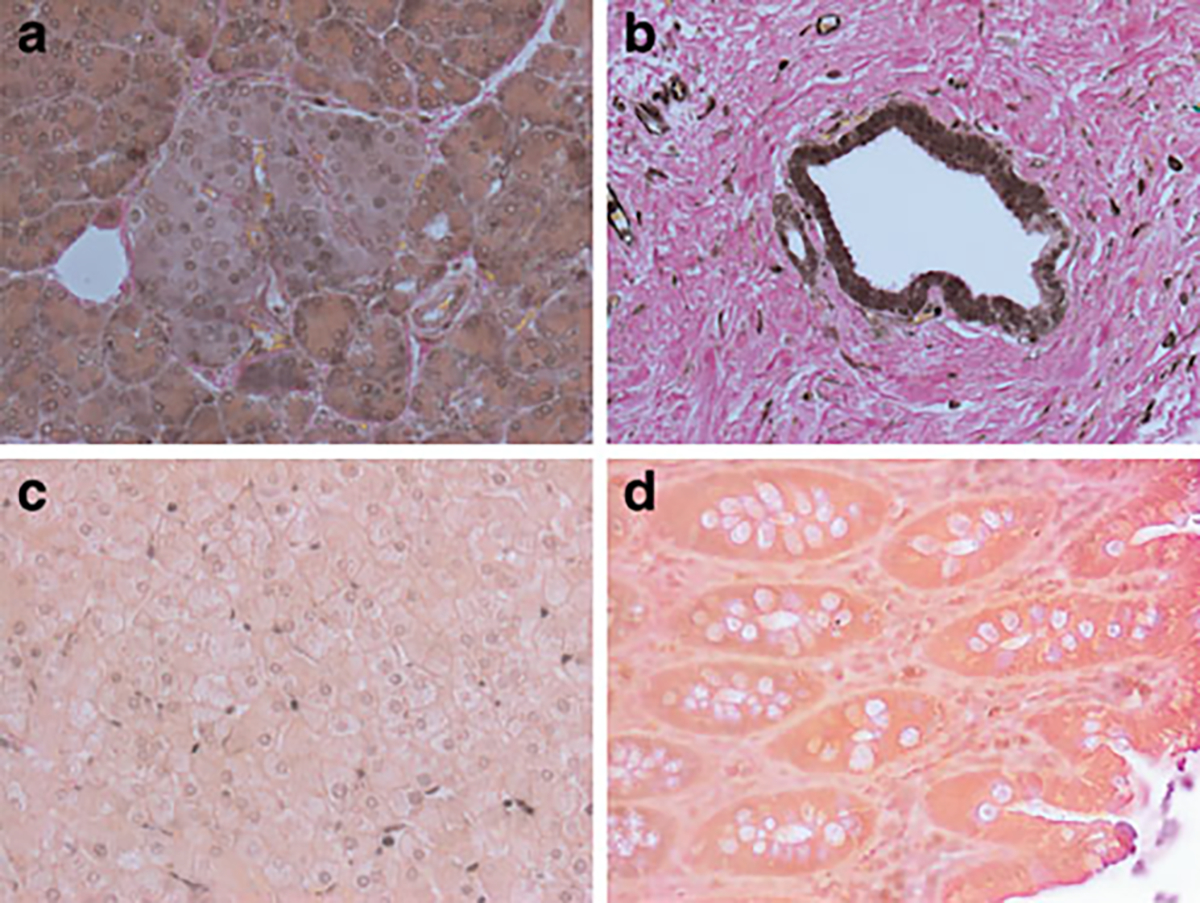
Immunoreactivity for SLC30A8. Diffuse moderate to strong immunoreactivity was found in acini as well as islet cells (a). Strong immunoreactivity for SLC30A8 was found in the ductal epithelia (b). No immunoreactivity was exhibited by (c) hepatic parenchyma, although some nuclei of the sinusoidal fat storing cells did show some immunoreactivity. d No immunoreactivity was detected in colonic epithelia
No effect of age, height, weight or type 2 diabetes risk genotypes on gene expression in tissue
A potential mechanism of action for associated SNPs is to modulate expression of nearby genes [7]. We therefore asked whether risk SNPs identifying our loci affected the expression of proximal genes (cis eQTLs). We were unable to detect any association between the tested SNPs and RNA expression at the level we were powered to detect (Table 2). We did not detect an effect of age, height or weight on gene expression.
Discussion
We have shown that expression of candidate genes at type 2 diabetes risk loci is tissue-specific in the colon, liver and pancreas. No strong associations were identified between SNPs modulating risk of type 2 diabetes and these transcript levels in cis. Common variables summarised in Table 1 (age, height and weight) also did not exert effects on gene expression in our sample.
SLC30A8, a member of the zinc transporter family, has previously been detected primarily in the secretory vesicles of beta cells [8] with reports of lower expression levels in other tissues including the liver [9]. A novel finding in the present study was that immunohistochemical staining localised SLC30A8 in the liver, albeit not in hepatic parenchyma, but in nuclei of the sinusoidal fat-storing cells. The sinusoids of the liver radiate from the central vein and are the intervening canals between hepatocytes and/or the bile canaliculi. Within this space and along the luminal surface of the endothelial walls are the mononuclear phagocytic Kupffer cells. Below the endothelium, in the sub-endothelial space known as the ‘space of Disse’, are the fat-storing cells, also known as the ‘fat-storing cells of Ito’. These are stellate cells with the capacity to accumulate exogenously administered vitamin A as retinyl esters in lipid droplets. The role of SLC30A8 in these fat-storing cells of Ito in the liver remains unclear.
While the present work represents one of the largest surveys of candidate gene expression in tissues related to type 2 diabetes, we were unable to document any genetic effects on RNA abundance that were of sufficient magnitude to be detected. We emphasise this point, given that statistical power to detect such effects by genetic mapping is determined by several factors: sample size, allele frequency, effect size and desired level of significance. Other studies have found that cis-eQTLs often explain more than 50% of the expression trait variance [10]. Our study was adequately powered to detect effects of such magnitude; thus we interpret our results as evidence that there are no cis-eQTLs on the target genes in the human tissues examined. This study suggests that caution should be exercised when interpreting eQTLs reported in smaller (and thus lower powered) studies. Replication in independent samples remains the gold standard of proof for associations with any trait, including eQTLs.
We performed an initial survey of candidate gene expression in tissues relevant to type 2 diabetes. Our major findings were of tissue-specific differences in expression of many of these genes in colon, liver and pancreas. These data argue strongly that biologically relevant tissues are critical for gaining insight into disease pathogenesis. Compared with previously published eQTL studies using lymphocytes as the cell/tissue of choice for gene expression, our study is based on a smaller sample size. However, one of its strengths is that it provides data on several tissues related to human diabetes. We recognise that although colon is a relevant tissue for incretin-related biology, samples from the small intestine vs the colon might have been more informative. Our results suggest that these disease-associated genetic variants do not act by dramatically altering expression of nearby genes in type 2 diabetes, although a more thorough dissection in specific cell types is needed, which may account for different transcript and protein isoforms. For example, isolated pancreatic islets and/or neuroendocrine cells could provide a more direct test of the hypothesis vs the entire pancreas and/or gut or small intestine. Analysis of larger collections of relevant tissues will also help understand the molecular effects of disease-associated genetic variants.
Supplementary Material
Acknowledgements
We are grateful to S. Schmechel and S. Bowell for help with procurement of tissues from the University of Minnesota Tissue Procurement Facility. We would also like to thank M. Carlson for help in preparing samples for the analysis. The study was supported by an intramural research programme of NCI/NIH and by NIH grant 1R21DK078029-01 (to J. L. Hall).
Abbreviations
- CEU
Centre d’Etude du Polymorphisme (Utah residents with northern and western European ancestry)
- Ct
Crossing threshold
- eQTL
Expression quantitative trait locus
- HHEX
Haemopoietically expressed homeobox protein
- IDE
Insulin-degrading enzyme
- MAF
Minor allele frequency
- SLC30A8
Solute carrier family 30 (zinc transporter), member 8
- SNP
Single nucleotide polymorphism
Footnotes
Duality of interest J. L. Hall is a financial consultant for Catholic Health Care West. All other authors declare that there is no duality of interest associated with this manuscript.
Electronic supplementary material The online version of this article (doi:10.1007/s00125-010-1861-2) contains supplementary material, which is available to authorised users.
Contributor Information
C. Cotsapas, Broad Institute, Cambridge, MA, USA Department of Medicine, Harvard Medical School, Boston, MA, USA; Center for Human Genetic Research, Department of Medicine, Massachusetts General Hospital, Boston, MA, USA.
L. Prokunina-Olsson, Laboratory of Translational Genomics, Division of Cancer Epidemiology and Genetics, National Cancer Institute, NIH, Bethesda, MD, USA
C. Welch, Department of Medicine, Lillehei Heart Institute, 4-280 NHH, 312 Church St SE, Minneapolis, MN 55455, USA
R. Saxena, Broad Institute, Cambridge, MA, USA Department of Medicine, Harvard Medical School, Boston, MA, USA; Center for Human Genetic Research, Department of Medicine, Massachusetts General Hospital, Boston, MA, USA; Department of Anesthesia, Critical Care and Pain Medicine, Massachusetts General Hospital, Boston, MA, USA.
C. Weaver, Department of Medicine, Lillehei Heart Institute, 4-280 NHH, 312 Church St SE, Minneapolis, MN 55455, USA
N. Usher, Department of Medicine, Lillehei Heart Institute, 4-280 NHH, 312 Church St SE, Minneapolis, MN 55455, USA
C. Guiducci, Broad Institute, Cambridge, MA, USA
S. Bonakdar, Broad Institute, Cambridge, MA, USA
N. Turner, Department of Medicine, Lillehei Heart Institute, 4-280 NHH, 312 Church St SE, Minneapolis, MN 55455, USA
B. LaCroix, Department of Medicine, Lillehei Heart Institute, 4-280 NHH, 312 Church St SE, Minneapolis, MN 55455, USA
J. L. Hall, Developmental Biology Center, University of Minnesota, Minneapolis, MN, USA Department of Medicine, Lillehei Heart Institute, 4-280 NHH, 312 Church St SE, Minneapolis, MN 55455, USA.
References
- 1.Stolerman ES, Florez JC (2009) Genomics of type 2 diabetes mellitus: implications for the clinician. Nat Rev Endocrinol 5:429–436 [DOI] [PubMed] [Google Scholar]
- 2.Jansen RC, Nap JP (2001) Genetical genomics: the added value from segregation. Trends Genet 17:388–391 [DOI] [PubMed] [Google Scholar]
- 3.Saxena R, Gianniny L, Burtt NP et al. (2006) Common single nucleotide polymorphisms in TCF7L2 are reproducibly associated with type 2 diabetes and reduce the insulin response to glucose in nondiabetic individuals. Diabetes 55:2890–2895 [DOI] [PubMed] [Google Scholar]
- 4.Prokunina-Olsson L, Welch C, Hansson O et al. (2009) Tissue-specific alternative splicing of TCF7L2. Hum Mol Genet 18:3795–3804 [DOI] [PMC free article] [PubMed] [Google Scholar]
- 5.Frazer KA, Ballinger DG, Cox DR et al. (2007) A second generation human haplotype map of over 3.1 million SNPs. Nature 449:851–861 [DOI] [PMC free article] [PubMed] [Google Scholar]
- 6.Purcell S, Cherny SS, Sham PC (2003) Genetic power calculator: design of linkage and association genetic mapping studies of complex traits. Bioinformatics 19:149–150 [DOI] [PubMed] [Google Scholar]
- 7.Franke L, Jansen RC (2009) eQTL analysis in humans. Methods Mol Biol 573:311–328 [DOI] [PubMed] [Google Scholar]
- 8.Chimienti F, Devergnas S, Favier A, Seve M (2004) Identification and cloning of a beta-cell-specific zinc transporter, ZnT-8, localized into insulin secretory granules. Diabetes 53:2330–2337 [DOI] [PubMed] [Google Scholar]
- 9.Liuzzi JP, Cousins RJ (2004) Mammalian zinc transporters. Annu Rev Nutr 24:151–172 [DOI] [PubMed] [Google Scholar]
- 10.Stranger BE, Nica AC, Forrest MS et al. (2007) Population genomics of human gene expression. Nat Genet 39:1217–1224 [DOI] [PMC free article] [PubMed] [Google Scholar]
Associated Data
This section collects any data citations, data availability statements, or supplementary materials included in this article.