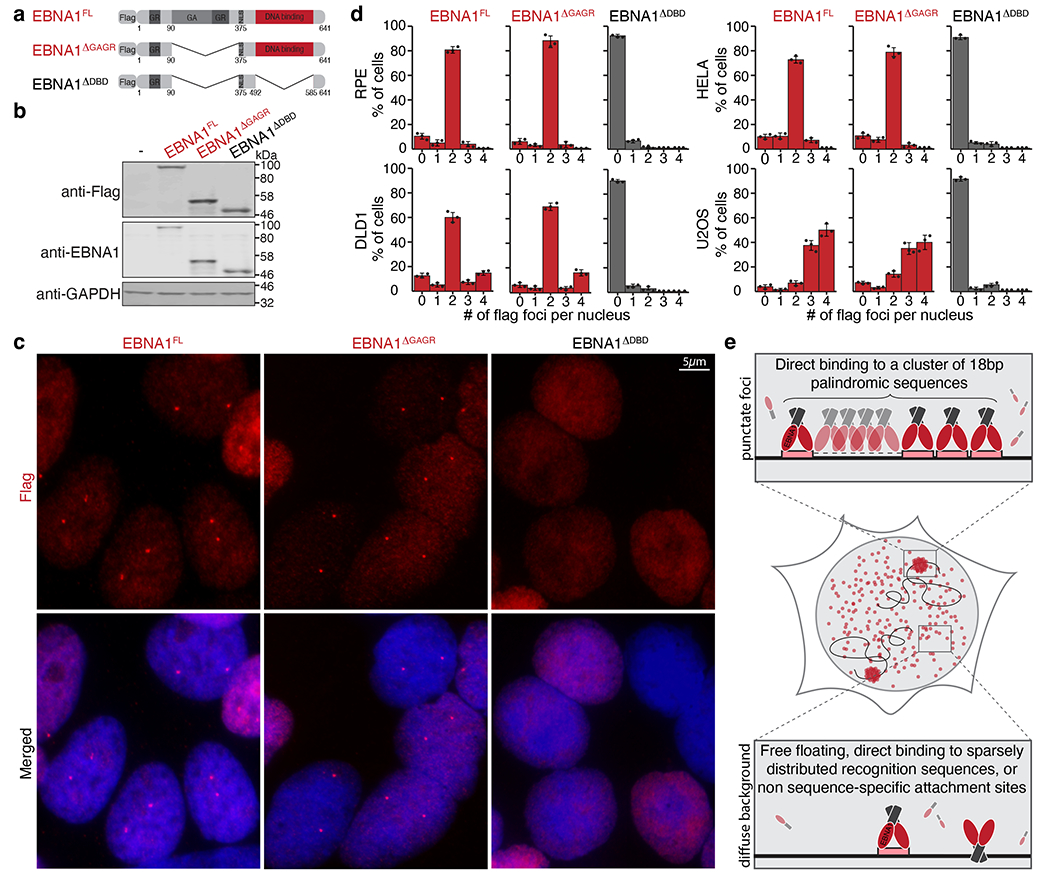
Fig. 1 |. Sequence-specific DNA-binding domain mediates enrichment of EBNA1 at a single genomic locus in the endogenous human genome.

a, Schematic representation of the Flag-tagged alleles of EBNA1. GR, glycine– arginine-rich region; GA, glycine–alanine repeat region; NLS, nuclear localization signal. b, Representative immunoblots of cells expressing the indicated Flag-tagged alleles of EBNA1. For gel source data, see Supplementary Fig. 1. c, Representative anti-Flag (red) immunofluorescence micrographs showing localization of the alleles in DLD1 cells. Scale bar, 5 μm. d, Quantification of localization of the alleles of EBNA1 in the indicated cell lines either at day 1 following transient expression in RPE, HeLa and U2OS cells, or at day 2 following stable transduction in DLD1 cells. A total of 908 RPE cells, 902 DLD1 cells, 901 HeLa cells and 893 U2OS cells were counted. Data are presented as mean values Å} s.e.m. from three independent experiments. e, Schematic representation of the hypothesis that EBNA1 foci formation is mediated by sequence-specific enrichment through the DNA-binding domain (red) at a recognition sequence (pink) clustered at a repetitive site in the human genome.
