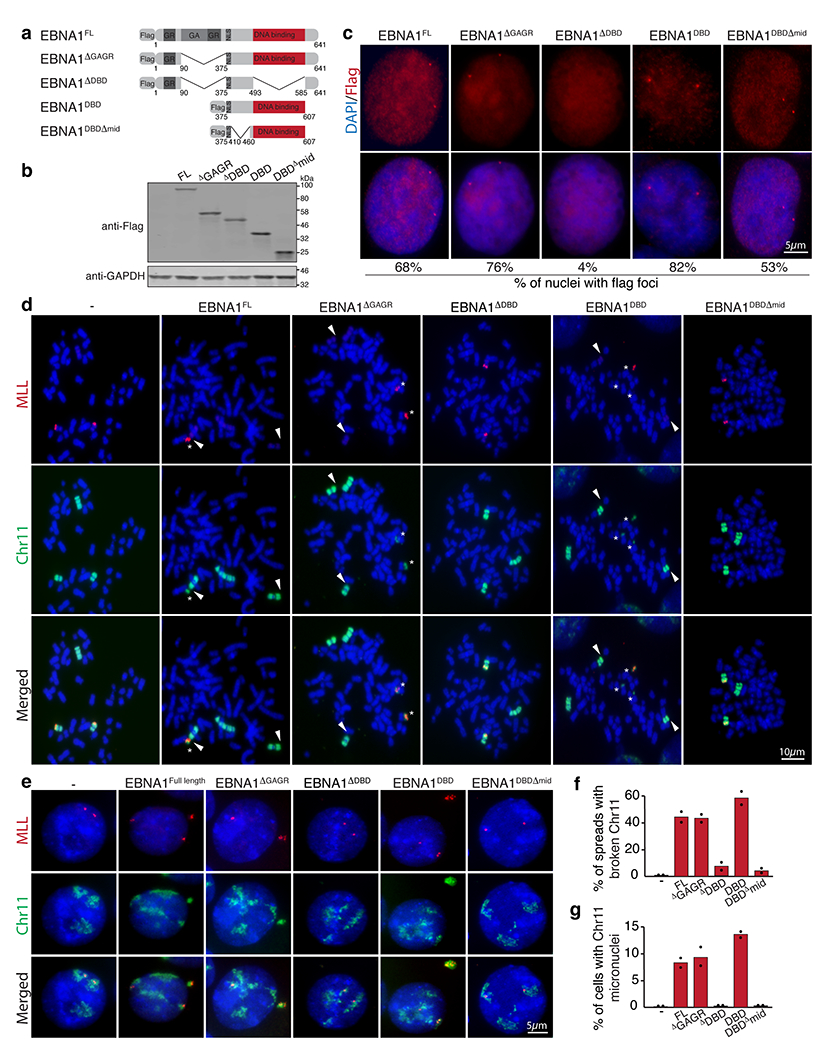
Extended Data Figure 11. EBNA1-induced breakage at 11q23 is dependent on the DNA binding domain.

(a) Schematic of the Flag-tagged alleles of EBNA1 expressed in HeLa cell that harbor two copies of chromosome 11 and a derivative chromosome 11 lacking 11q23. (b) anti-Flag immunoblot of cells expressing the indicated alleles. (c) Anti-Flag immunofluorescence showing localization of the indicated EBNA1 alleles. Numbers indicate the percentage of nuclei with flag foci. (d) Representative dual colored FISH showing chromosome 11’s in HeLa cells, including two copies of chromosome 11 (in green) harboring MLL (in red) and one derivative chromosome 11 lacking MLL. White arrows indicate the site of breakage proximal to MLL as quantified in (f). 48 mitotic spreads were quantified for non-transduced HeLas, 65 for HeLas expressing EBNA1FL, 98 for HeLas expressing EBNA1ΔGAGR, 40 for HeLas expressing EBNA1ΔDBD, 69 for HeLas expressing EBNA1DBD, and 82 for HeLas expressing EBNA1DBDΔmid. Data are presented as bars representing mean values from two independent experiments. (e) Representative FISH images of interphase nuclei showing micronucleation of chromosome 11 fragments containing MLL as quantified in (g). 210 cells were quantified for non-transduced HeLas, 150 for HeLas expressing EBNA1FL, 195 for HeLas expressing EBNA1ΔGAGR, 170 for HeLas expressing EBNA1ΔDBD, 230 for HeLas expressing EBNA1DBD, and 210 for HeLas expressing EBNA1DBDΔmid. Data are presented as bars representing mean values from two independent experiments.
