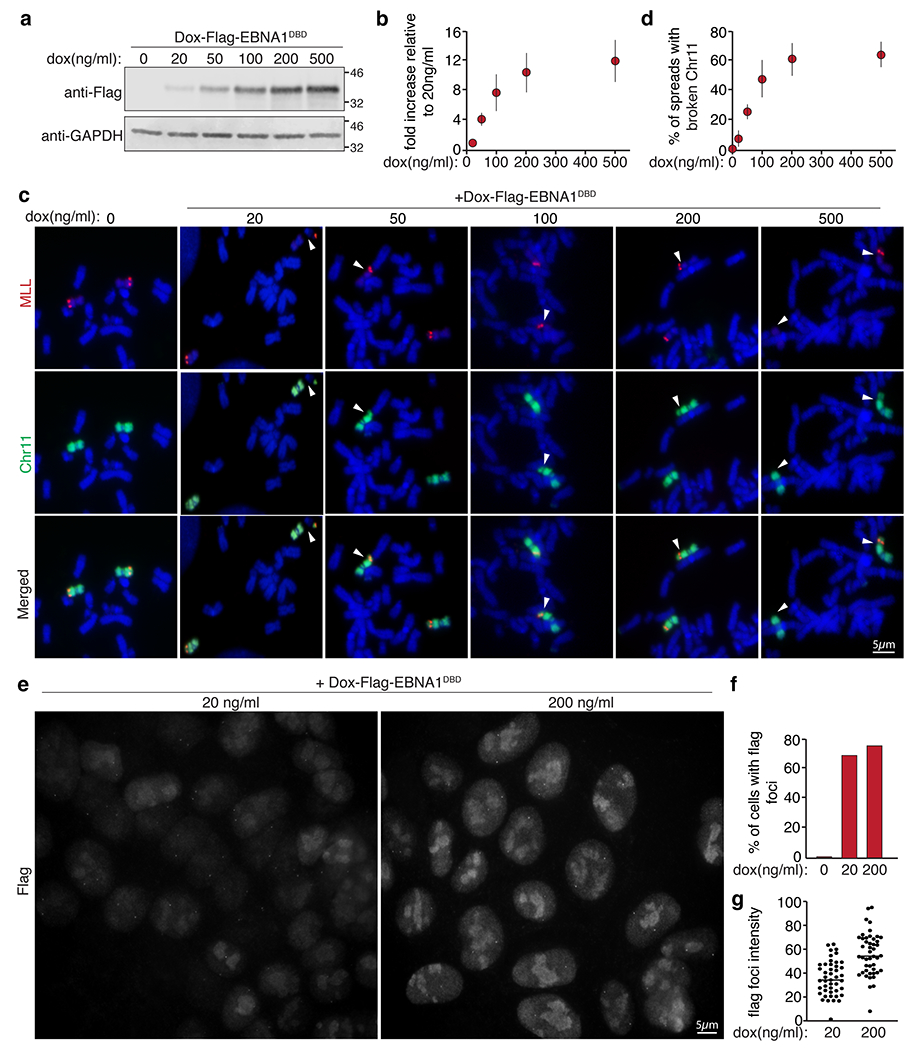
Extended Data Figure 12. EBNA1 abundance has a dose-dependent effect on the frequency of breakage at 11q23 in DLD1 cells.

(a) anti-Flag immunoblot of dox-induced Flag-EBNA1DBD expression levels at the indicated doxycycline concentrations as quantified in (b). Data are presented as mean values +/− SEM from three independent experiments. (c) Dual colored FISH of mitotic chromosome 11 (in green) and MLL (in red) showing breakage proximal to MLL at day two following induction with the indicated doxycycline concentrations as quantified in (d). A total of 786 mitotic spreads were counted. Data are presented as mean values +/− SEM from three independent experiments. (e) Representative anti-Flag immunofluorescence images of Flag-EBNA1DBD expression at 20ng/ml or 200ng/ml. (f) Percentage of cells with flag foci. (g) Intensity of flag foci of 90 signals are quantified with horizontal bars representing the mean values.
