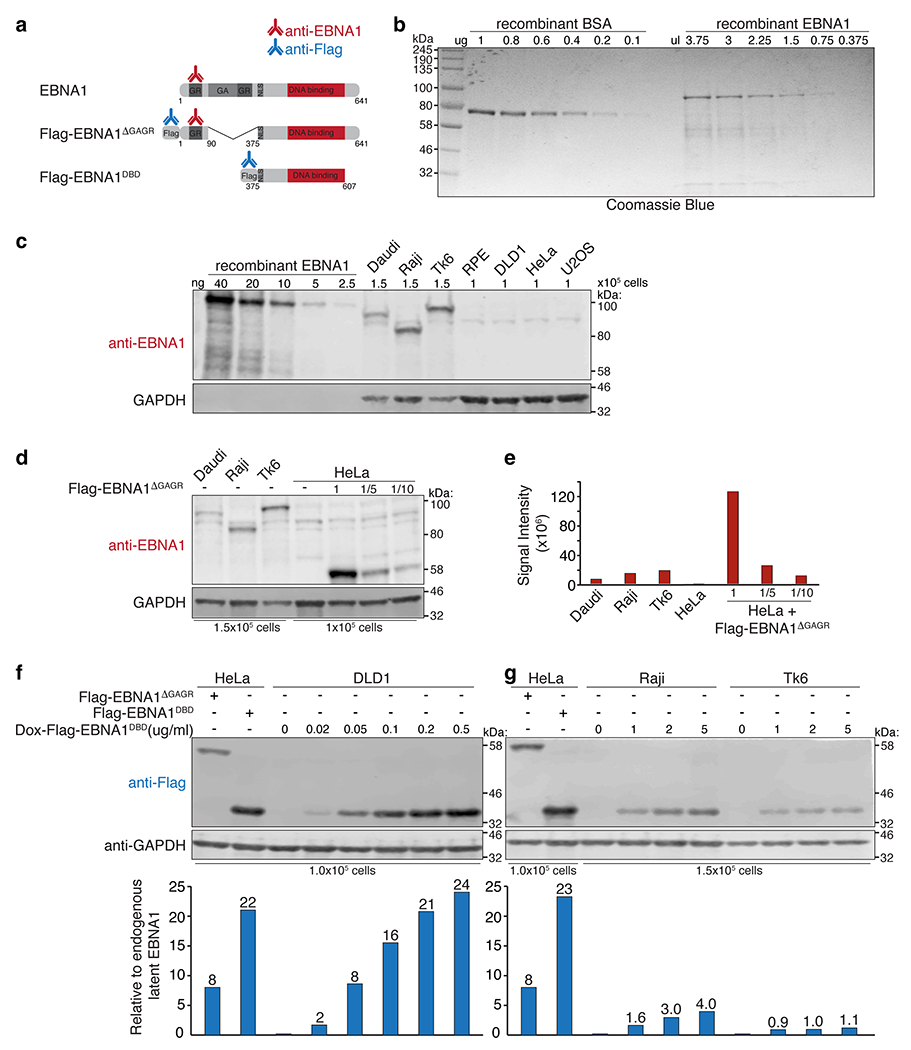
Extended Data Figure 13. Cell lines latently infected with EBV express EBNA1 levels slightly below the levels required to induce 11q23 breakage.

(a) Schematic of the antibodies used to quantify EBNA1. (b) Coomassie blue staining of recombinant BSA next to recombinant EBNA1 (Abcam 138345). (c) anti-EBNA1 (Santa Cruz sc-81581) immunoblot of recombinant EBNA1 next to whole cell lysates of the indicated cell lines. Anti-GAPDH immunoblot shows variation amongst the EBV-infected cell lines when loading the same number of cells. (d) anti-EBNA1 immunoblot of EBNA1 in the indicated EBV-infected cell lines next to HeLa cells expressing Flag-EBNA1ΔGAGR loaded at the indicated dilutions. (e) Bar graph represents signal intensity values normalized to number of cells loaded showing that the 1x Flag-EBNA1ΔGAGR in HeLa cells is expressed at 14-fold relative to baseline EBNA1 in Daudi cells and 8-fold in Raji cells and Tk6 cells. Immunoblots were repeated 3 times where S.D. values were below +/− 10%. (f-g) Anti-Flag immunoblot of HeLa cells, DLD1 cells, Raji cells, and Tk6 cells expressing the indicated Flag-tagged EBNA1 alleles. Bar graph represents fold relative to latent EBNA1 in Raji or Tk6 cells, calculated using the Flag-EBNA1ΔGAGR allele as 8-fold. Immunoblots were each repeated 3 times, S.D. values were below +/− 10%.
