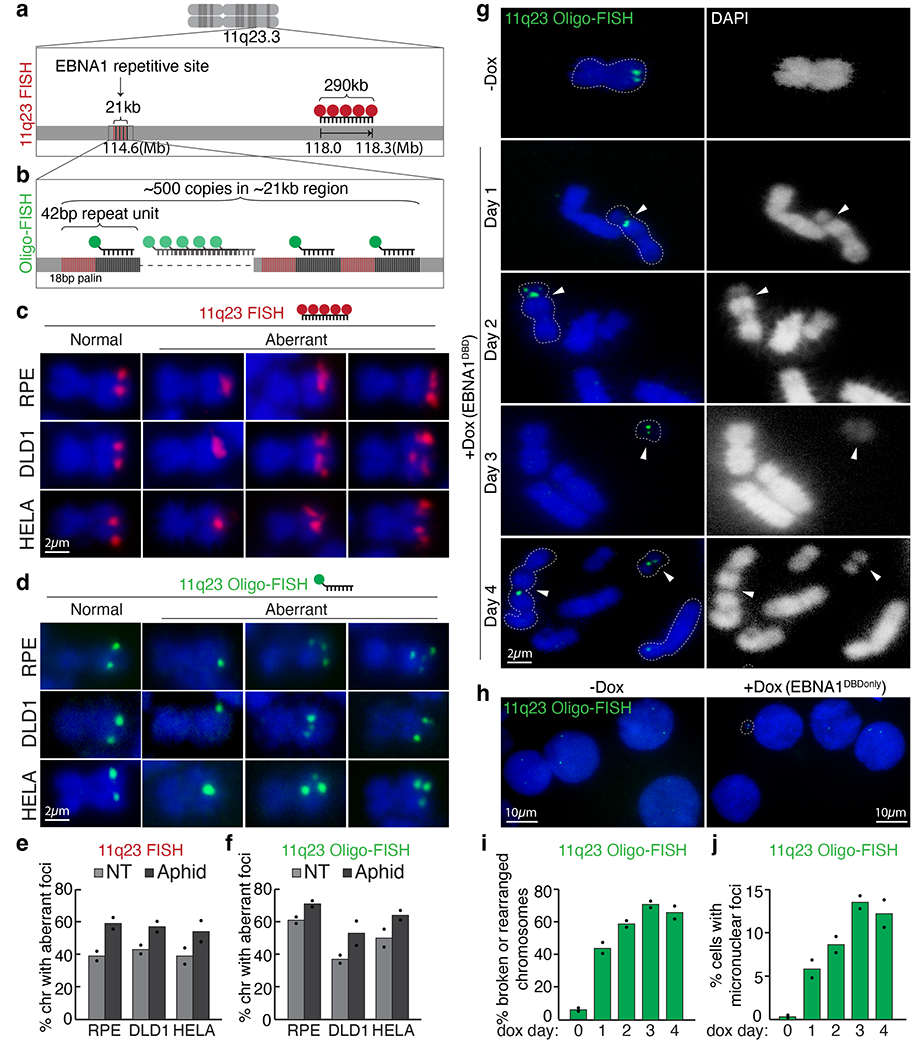
Fig. 3 |. Repetitive DNA containing the 18-bp imperfect palindromes forms aberrant structures characteristic of fragile DNA and undergoes breakage and micronucleation after induced EBNA1 expression.

a, Schematic representation of 11q23 FISH using a fluorescently labelled BAC probe (in red) that hybridizes to the indicated genomic locus. b, Schematic representation of oligo-FISH using a fluorescently labelled oligonucleotide (in green) that hybridizes to the sequence adjacent to the 18-bp palindrome as part of the 42-bp repeat unit. c,d, Representative 11q23 FISH (c) and oligo-FISH (d) images showing normal or aberrant foci on mitotic chromosomes in the indicated cell lines with or without 24 h of 0.2 μM aphidicolin. Scale bars, 2 μm. e,f, Quantification of staining in c,d, respectively. For 11q23 FISH with BAC probe, a total of 255 chromosomes were counted for RPE, 236 for DLD1 and 256 for HeLa cells. For 11q23 oligo-FISH, a total of 235 chromosomes were counted for RPE, 202 for DLD1 and 196 for HeLa cells. Data are presented as bars representing mean values from two independent experiments. NT, non treated. g, Representative 11q23 oligo-FISH images of mitotic chromosomes with and without Dox-inducible expression of EBNA1(DBD). Arrowheads indicate oligo-FISH signals that localized at either a gap on centric chromosomes or on small acentric fragments. Dashed lines outline the oligo-FISH-containing chromosomes. DAPI staining is shown as either merged in blue or separately in white. Scale bar, 2 μm. h, Quantification of 11q23 oligo-FISH staining in g. A total of 101 chromosomes were counted on day 0, 98 on day 1, 80 on day 2, 90 on day 3, and 83 on day 4. Data are presented as bars representing mean values from two independent experiments. i, Representative 11q23 oligo-FISH of interphase nuclei with and without Dox-inducible expression of EBNA1(DBD). Scale bars, 10 μm. j, Quantification of staining in i. A total of 800 interphase cells were counted on day 0, 276 on day 1, 253 on day 2, 241 on day 3, and 260 on day 4. Data are presented as bars representing mean values from two independent experiments.
