Abstract
Bleomycin B2 (BLM) in the presence of iron [Fe(II)] and O2 catalyzes single-stranded (ss) and double-stranded (ds) cleavage of DNA. Electrospray ionization ion trap mass spectrometry was used to monitor these cleavage processes. Two duplex oligonucleotides containing an ethylene oxide tether between both strands were used in this investigation, allowing facile monitoring of all ss and ds cleavage events. A sequence for site-specific binding and cleavage by Fe–BLM was incorporated into each analyte. One of these core sequences, GTAC, is a known hot-spot for ds cleavage, while the other sequence, GGCC, is a hot-spot for ss cleavage. Incubation of each oligonucleotide under anerobic conditions with Fe(II)–BLM allowed detection of the non-covalent ternary Fe–BLM/oligonucleotide complex in the gas phase. Cleavage studies were then performed utilizing O2-activated Fe(II)–BLM. No work-up or separation steps were required and direct MS and MS/MS analyses of the crude reaction mixtures confirmed sequence-specific Fe–BLM-induced cleavage. Comparison of the cleavage patterns for both oligonucleotides revealed sequence-dependent preferences for ss and ds cleavages in accordance with previously established gel electrophoresis analysis of hairpin oligonucleotides. This novel methodology allowed direct, rapid and accurate determination of cleavage profiles of model duplex oligonucleotides after exposure to activated Fe–BLM.
INTRODUCTION
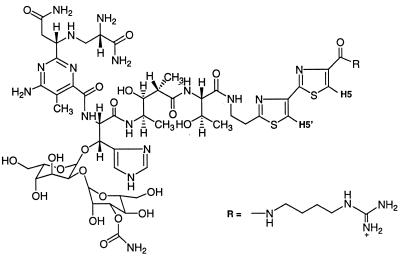
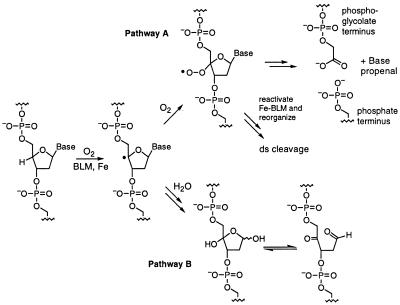
Bleomycin (BLM) (1; Fig. 1) is the major component of the clinically employed antitumor antibiotic Blenoxane (2,3). Its therapeutic effects are thought to be related to its ability to bind and initiate single-stranded (ss) and double-stranded (ds) cleavage of DNA in the presence of its required cofactors Fe(II) and O2 (4,5). Recently, RNA has also been postulated to be a target (6). Detailed studies over the past 15 years have established a generally accepted mechanism for Fe–BLM-mediated ss cleavage (4,5). Mechanisms for ds cleavage have been proposed, but the details remain to be established (7,8). In vitro activation of BLM is accomplished with Fe(II), O2 and a reductant or Fe(III) and H2O2 (4,5). The activated BLM has been identified as a ferric peroxide by electrospray ionization-mass spectrometry (ESI MS) analysis (9). This reactive intermediate (or a species formed subsequent to its generation, which is not spectroscopically detectable) is known to initiate both ss and ds DNA cleavage by abstraction of a 4′-hydrogen atom from the deoxyribose moiety of pyrimidines located 3′ to a deoxyguanosine unit (10,11). The 4′ radical partitions between two pathways depending on the availability of O2 (Fig. 2). The oxygen-dependent pathway (Fig. 2, pathway A) leads to direct DNA strand breaks forming 3′-phosphoglycolate and 5′-phosphate termini and a base propenal (12,13). In contrast, 4′-keto abasic sites and free nucleic acid bases are generated in O2-depleted environments (pathway B) and alkaline conditions are required to initiate DNA strand cleavage (14,15).
Figure 1.
The structure of BLM B2.
Figure 2.
Mechanism of DNA cleavage induced by activated Fe–BLM. Pathway A shows the cleavage mechanism and products in the presence of excess O2, over and above that required to form activated BLM. Pathway B illustrates the fragmentation in an oxygen limited environment.
Both ss and ds DNA cleavages occur in a sequence-specific fashion (16–19). Double-stranded cleavage occurs less frequently and is thought to be associated with Fe–BLM efficacy due to the difficulty of repairing this lesion (7,8,20). Recent evidence suggests that one molecule of Fe–BLM catalyzes cleavage of both strands without dissociation from the DNA (21,22). The primary site of cleavage (GTX or GCX) is typically identical in ss and ds cleavage events (7). The site of damage on the second strand is proposed to be dependent on X. If X is a pyrimidine, cleavage occurs directly opposite the primary lesion, resulting in the formation of blunt ends. Alternatively, if X is a purine, the cleavage is staggered by 1 bp to the 5′-side (7). The postulated mechanism for Fe–BLM-mediated ds DNA cleavage requires initial ss DNA cleavage according to the mechanism shown in Figure 2, pathway A. It has been proposed that reactivation and spatial reorganization of Fe–BLM is required prior to cleavage of the second strand (7,21). Based on NMR studies, a structural model for ds cleavage recognizing the importance of the intercalated bithiazole tail in the reorganization process has been proposed (4,23).
Recently, Fe–BLM-induced ds DNA cleavage has been investigated using hairpin oligonucleotides (21,22) and non-tethered duplex oligonucleotides. The former substrates facilitated qualitative analysis of site specificities as well as quantitative analysis of ss and ds cleavage events. The latter substrates were used to identify degradation products by high resolution PAGE (21), HPLC and GC-MS (13,15,24). Product analysis in some cases required derivatization and separation by chromatographic methods. These methods are time consuming and can lead to decomposition of the labile lesions.
An alternative method was therefore sought to examine both the sites of cleavage and the degradation products. Analysis by the ESI-MS method avoids derivatization and separation steps, minimizing artifacts and enabling direct monitoring of complex reaction mixtures. Routine analysis of non-volatile and fragile biomolecules by mass spectrometry has been made possible by soft ionization techniques such as matrix-assisted laser desorption ionization (MALDI) (25) and ESI (26).
Non-covalent complexes between DNA-binding drugs such as distamycin A, daunomycin or a post-activated neocarzinostatin chromophore and duplex oligonucleotides have previously been observed by ESI-MS (27–29). Attempts to observe the non-covalent complex between daunomycin and the oligonucleotide d(CGATCG)2 in the gas phase yielded unsatisfactory results, attributed to the low duplex gas phase stability (27). Successful detection of these complexes required use of hairpin oligonucleotides of at least 21 nt units or duplex oligonucleotides of at least 12 bp in length (28,29). In the present study, binding of Fe–BLM was monitored using octameric, complementary oligonucleotides tethered by a polyethylene oxide spacer. The spacer increased both gas and solution phase duplex stability of the complementary oligonucleotides, allowing use of shorter sequences for the accurate modeling of Fe–BLM binding and DNA degradation. The small size of these analytes rendered them ideal for analysis by low resolution ESI-MS. Additionally, it was also found that shorter oligonucleotides yielded better quality MS/MS data, critical for the identification of the observed cleavage products. As described in detail below, ESI-MS analysis of the designed oligonucleotides after exposure to activated Fe–BLM allowed correct modeling of all site-specific cleavage events. The presence of the tether is also crucial in distinguishing between ss and ds cleavage events, which is not possible using untethered duplex oligonucleotides.
Two sequences containing previously established ss and ds cleavage sites for Fe–BLM were examined: 5′-CCGT4ACAA-(C2H4O)6TTGT12ACGG-3′ (1) and 5′-CCGGC5CAA(C2H4O)6TT-GGC13CGG-3′ (2). The GTAC sequence in 1 is a hot-spot for DNA ss and ds cleavage (7). In contrast, 2 contains two excellent ss cleavage sites at C5 and C13. Based on our structural model for ds cleavage, a single molecule of activated BLM cannot catalyze ds cleavage of oligonucleotide 2 by cleavage at C5 and C13 (4,23). The complexity and rarity of ds cleavage has made its detailed analysis difficult to study using classical analytical methods. Herein, we report a novel analytical approach using electrospray ionization-ion trap mass spectrometry (ESI-ITMS) for direct identification of ss and ds cleavage products of covalently tethered duplex oligonucleotides. These studies represent the first step in the development of a new ESI-MS-based methodology to understand the mechanism of the ds cleavage process. Our long range goal is to develop methods for quantitative determination of ss to ds DNA cleavage ratios.
MATERIALS AND METHODS
Preparation of oligonucleotides
The oligonucleotides were prepared by the MIT Biopolymer Laboratory on a 10 µmol scale using standard phosphoramidite chemistry. The hexaethylene glycol DMT-phosphoramidite monomer was obtained from Glen Research and employed without modification of the standard coupling protocol. The oligonucleotide bases and phosphodiester backbone groups were deprotected while the DMT group was retained on the 5′-terminus to facilitate purification.
Purification of oligonucleotides
Oligonucleotides were dissolved in 100 mM triethylammonium acetate (TEAA) and were purified by reverse-phase HPLC on an Econosil C18 column (10 × 250 mm) using a linear gradient of 10–35% acetonitrile against 100 mM TEAA (pH 7.0) over 50 min at a flow rate of 3.0 ml/min. The oligonucleotides eluted between 34 and 38 min. The appropriate fractions were pooled and lyophilized to dryness. The 5′-DMT group was removed by dissolving the residue in 5 ml of aqueous acetic acid (80%). The acetic acid was removed by lyophilization after 1 h and 15 ml of water were added. The aqueous phase was extracted with 3 × 10 ml of diethyl ether. The aqueous phase was lyophilized to dryness and subsequently redissolved in 40 ml of 100 mM NH4OAc (pH 7.5) and dialyzed (1000 molecular weight cut-off membrane) against 3 × 1000 ml (2 h each) of 10 mM NH4OAc (pH 7.5). Lyophilization yielded 3.6 µmol of 1 and 4.4 µmol of 2. The purity was established using a Dionex NucleoPac PA-100 (4 × 250 mm) column: A, 25 mM NaOAc in 10% aqueous acetonitrile (pH = 6.0); B, 25 mM NaOAc and 1.0 M NaCl in 10% aqueous acetonitrile (pH = 6.0) with a linear gradient of 20–60% B over 20 min at a flow rate of 1.0 ml/min. Sample 1 eluted at 15.0 min (95% purity) and sample 2 eluted at 14.2 min (94% purity).
Preparation of anerobic Fe(II)–BLM
An anerobic chamber (MBraun) was utilized to prepare all Fe(II)–BLM solutions. An anerobic aqueous solution of Fe(II)(NH4)2(SO4)2·6H2O was prepared and its concentration was determined using a ferrozine assay (30). This solution was then added to an anerobic solution of 7.66 mM BLM B2 (Sigma, St Louis, MO) (ɛ295 = 1.4 × 10⁴/M/cm). Dilution with anerobic H2O yielded Fe(II)–BLM solutions of known concentrations. The resulting clear, colorless solutions were loaded into gas-tight syringes (Hamilton Co., Reno, NV).
Preparation of cleavage reaction mixture
The stock solutions of each tethered oligonucleotide (1 mM) were diluted at 4°C with 250 mM NH4OAc buffer (pH 7.5) saturated with O2. The anerobic Fe(II)–BLM solution prepared above was then exposed to atmospheric O2 for 10 s (this is the time required to generate activated BLM) and added to the oligonucleotide analytes. The final concentrations of oligonucleotide, Fe–BLM and buffer were 50 and 100 µM and 25 mM, respectively. At various time points (1, 2, 4 and 10 min), aliquots of the reaction mixture were quenched by adding 20 µl of the reaction mixture to 30 µl of 250 µM EDTA, 25 mM NH4OAc (pH 4.5). The quenched aliquots were stored on ice and subsequently frozen at –20°C. After completion of the reaction, the unquenched reaction mixture was directly transferred to the freezer. All samples were thawed immediately prior to ESI MS analysis. Binding of Fe(II)–BLM to 1 was monitored by mixing Fe(II)–BLM with 1 in anerobic buffer. The concentrations in this experiment were identical to those reported in the cleavage experiments.
Mass spectrometry
The reaction mixtures were directly infused into a Finnigan LCQ Ion Trap Mass Spectrometer (San Jose, CA) equipped with a standard electrospray source. The samples were introduced by syringe pump (Harvard Apparatus, South Natick, MA). The sample flow rate was adjusted to 2 µl/min. A spray voltage of 3.8 kV and a capillary temperature of 180°C were maintained in all experiments. A sheath liquid (90:10 v/v acetonitrile, 15 mM ammonium acetate in water; flow rate 4 µl/min) and nitrogen sheath gas (30 arbitrary gas units) were introduced coaxially to provide a stable background spray. Typically, 30 scans with a maximum ion injection time of 200 ms were acquired. The instrument was tuned on a series of standard oligonucleotides.
RESULTS AND DISCUSSION
Studies to define the products generated by activated Fe–BLM were performed using two tethered duplex oligonucleotides, 1 and 2, each containing well-characterized Fe–BLM binding sites. The sequence GTAC was incorporated into 1. This analyte contained two ss cleavage sites and a hot-spot for ds cleavage. The reported ss:ds cleavage ratio in a hairpin oligonucleotide of similar sequence was 3:1 (22). In these experiments ss cleavage occurred at T4 or T12 and ds cleavage was observed when one activated Fe–BLM molecule cleaved at both T4 and T12. In comparison, 10:1 to 20:1 ss:ds cleavage ratios have generally been observed for Fe–BLM-induced cleavage of DNA (31,32). The aforementioned cleavage studies involving hairpin oligonucleotides were carried out under single hit conditions (i.e. a large molar excess of DNA), ensuring that ds cleavage was not the result of two independent single strand cleavage events. In contrast, the experiments described below were not performed under single hit conditions and therefore we could not initially assess whether the observed ds cleavage of 1 was indeed due to a single Fe–BLM molecule.
Compound 2 contained two ss cleavage sites (GGCC) at C5 and C13 and no good ds cleavage site based on our proposed structural model for the mode by which a single BLM catalyzes two cleavage events (23). As noted subsequently, comparison of the cleavage results of 1 and 2 strongly suggested that ds cleavage of 1 did in fact occur by a single Fe–BLM molecule.
Hairpin sequences have previously been used as model systems to quantitate the ratio of ss:ds cleavage; however, this method is technically limited to ss:ds cleavage ratios of less than 8:1 (21,22). In an effort to develop new, mild methods to investigate ds and ss cleavage events, tethered oligonucleotides 1 and 2 have been designed. Direct ESI-ITMS analysis of the crude reaction mixture of the tethered oligonucleotides after exposure to activated Fe–BLM allowed facile distinction between ss and ds cleavage events, without the need for a separation step. It was also possible to distinguish the relative propensities for ss cleavage of the two available sites within each analyte. These studies were carried out by sequential MS data acquisition of the tethered oligonucleotides, Fe–BLM and apoBLM and the non-covalent complexes of 1 and 2 with Fe–BLM before and after activation with O2. Details of this series of experiments are outlined below.
Tethered oligonucleotide 1
The full scan MS spectrum of compound 1 displayed prominent signals at m/z 1740.7, 1305.5, 1044.3 and 870.2, reflecting the –3, –4, –5 and –6 charge states, respectively (full scan reference data not shown). Formation of head-to-tail dimers of the tethered oligonucleotide in the gas phase was ruled out, since apparent non-integer charge states of 1 were not observed (i.e. with reference to a monomer, the charge state appears to be –1.5 for the –3 charged anion of an oligonucleotide dimer) (33,34). An additional peak of moderate intensity at m/z 1267.5 indicated neutral loss of a guanine residue from the parent molecule in the gas phase.
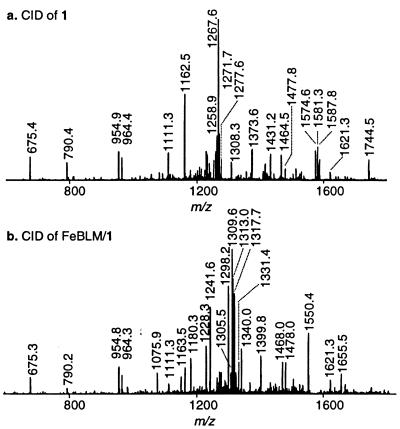
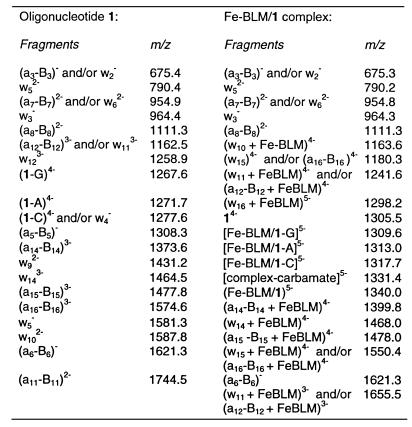
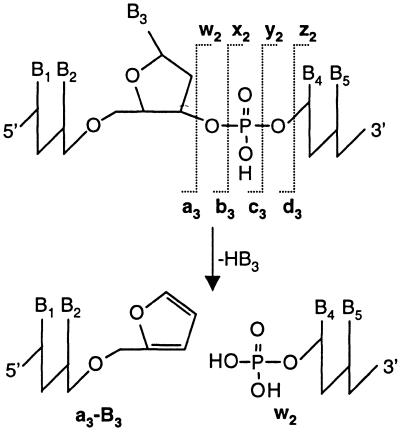
Collision-induced dissociation (CID) of the peak at m/z 1305.5 yielded the spectrum shown in Figure 3a, with the fragment ions summarized in Table 1. Abundant fragment ions consistent with loss of nucleobase moieties from the parent compound ([M–G]4–, [M–A]4– and [M–C]4–) were observed. Additionally, multiple peaks of moderate abundances in the range m/z 1230–1250 represented fragments formed upon loss of two nucleobases. Diagnostic an–Bn and wm ions due to cleavage of the sugar–phosphate backbone were also detected. This fragmentation process is triggered by excision of a nucleobase, yielding a dihydrofuran intermediate. Subsequent elimination at C3′–C4′ leads to cleavage of the 3′C–O bond at the abasic site, generating a furan terminus on the an–Bn fragment and a phosphate terminus on the complementary wm fragment. Figure 4 illustrates the mechanism and the nomenclature for gas phase dissociation of oligonucleotides (35,36); an–Bn and wm fragments are labeled in ascending order from the 5′- and 3′-termini, respectively. In the analysis of MS/MS data of 1 and 2, the polyethylene oxide spacer was simply treated as an additional monomer unit (a9 or w9). Fragmentation of the linker under CID conditions could generate ladders with a repetitive mass spacing of 44 {z = –1}, 22 {z = –2}, etc. if cleavages of the C–O bonds of the ethylene oxide hexamer were observed. The acquired MS/MS data, however, showed no product ions indicative of this degradation, which greatly facilitated interpretation of the gas phase fragmentation data.
Figure 3.
Structural analysis of the free oligonucleotide 1 and its Fe–BLM complex by CID. (a) Full scan MS/MS data of the tethered duplex oligonucleotide 1 ([M–4H]4–, m/z = 1305.5). (b) Full scan MS/MS data of the inactive ternary non-covalent Fe–BLM/1 complex ([M–5H]5–, m/z = 1340.1). All identified fragments are listed in Table 1.
Table 1. Identified product ions from gas phase fragmentation experiments (MS/MS) of the tethered duplex oligonucleotide 1 (m/z 1305.5, z = –4) and the inactive ternary Fe–BLM/1 complex (m/z 1340.1, z = –5).
Figure 4.
Nomenclature for gas phase fragmentation of oligonucleotides. The example shows backbone fragmentation between the third and fourth nucleotide units induced by neutral loss of nucleobase B3. This process leads to formation of the complementary a3–B3 and w2 fragments. Less prominent gas phase cleavages of the sugar–phosphate backbone yield b, c and d as well as x, y and z fragments.
Fe–BLM
Full scan MS analysis of a standard of anerobic Fe(II)–BLM B2 using negative electrospray ionization afforded a base peak at m/z 1477.7 (M–H)– (data not shown). This signal corresponded to ([Fe(II)–BLM]–3H)–. Zoom scan analysis allowed higher mass resolution and revealed an additional signal at 1476.7 ([Fe(III)–BLM]–4H)– of comparable intensity, indicating in situ oxidation of the iron in the ESI process. Minor peaks at m/z 1433.7 and 1091.7 were also observed in full scan MS analysis. These masses were consistent with either neutral loss of the carbamate group from ([Fe(III)–BLM]–4H)– (Δm = 43) (37,38) or loss of the carbohydrate moiety (Δm = 385), generating deglycoBLM. CID of Fe(III)–BLM (m/z 1476.7) led to the generation of identical product ions at m/z 1433.7 and 1091.8. These findings suggest that decarbamation and deglycosylation of Fe–BLM occurred in the gas phase and not in solution. MS/MS analysis of apoBLM produced analogous decarbamoyl- (m/z 1380.8) and deglycoBLM (m/z 1038.5) fragments.
Fe(II)–BLM complex with 1
Fe(II)-BLM was mixed with 1 under anerobic conditions and infused directly into the mass spectrometer. The ternary non-covalent complex was observed at m/z 1675.3, 1340.1 and 1116.9, representing the –4, –5 and –6 charged species. The resolution of the ion trap mass spectrometer was not sufficient to determine the charge state distribution of the iron ion unambiguously. CID of Fe–BLM/1 at m/z 1675.3 {z = –4} furnished abundant signals due to the loss of the nucleobases G, A and C; however, the an–Bn and wm fragments were practically absent (data not shown). In contrast, gas phase fragmentation of (Fe–BLM/1)5– (m/z 1340.1) produced a series of diagnostic product ions, shown in Figure 3b and listed in Table 1. Signals due to the loss of the nucleobases G, A and C still dominated the MS/MS spectrum and a series of short oligonucleotide fragments identical to those generated in the MS/MS analysis of 1 (Fig. 3a) was also detected in moderate abundances. The free oligonucleotide was observed at low intensity (m/z 1305.5), but there was no evidence of free Fe–BLM or its degradation products. Interestingly, longer oligonucleotide fragments still non-covalently bound to Fe–BLM were also identified. These fragments included intense ions at m/z 1298.2 [(w16+Fe–BLM)5–], 1241.6 [(a12–B12+Fe–BLM)4– and (w16+Fe-BLM)5–] and 1550.4 [(w15+Fe–BLM)4– and (a16–B16+Fe–BLM)4–]. Presence of these fragments provided qualitative information on the stability of the ternary complex in the gas phase. These data indicated that gas phase fragmentation of the sugar–phosphate backbone 3′C–O σ bonds was energetically favored over dissociation of the non-covalent complex, implicating a strong non-covalent interaction between Fe–BLM and 1 in the gas phase. Moreover, since non-covalent complex formation of apoBLM and 1 in the gas phase was not observed (vide infra), this result provided strong evidence for the crucial role of iron ions for gas phase binding of Fe–BLM to 1.
Fe–BLM-induced cleavage of 1
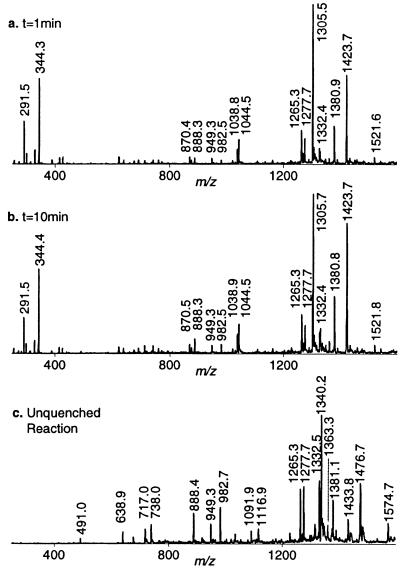
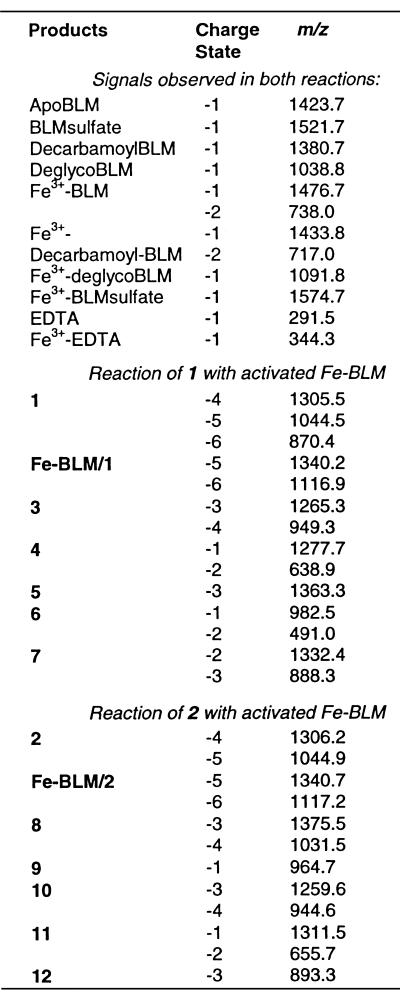
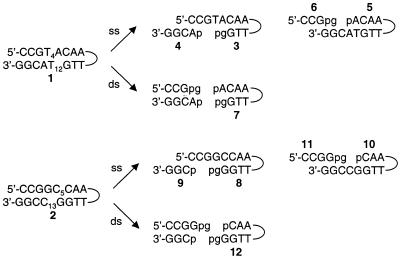
Cleavage was initiated by exposing 1 to activated Fe–BLM. Although activated Fe–BLM has previously been detected by ESI-MS (9), we did not observe it in the presence of either 1 or 2. This was due to our experimental design, which involved stopping the reaction by chelation of the iron from the Fe–BLM complex with EDTA at pH 4.5 prior to MS analysis. Figure 5a displays the full scan mass spectrum of the reaction mixture quenched after 1 min. All identified ions are listed and labeled in Table 2. EDTA and Fe–EDTA produced abundant signals at m/z 291.5 and 344.3, respectively. The absence of the ternary complex and Fe–BLM, as well as the presence of apoBLM (m/z 1423.7), confirmed quantitative complexation of the iron ions by EDTA. As stated above, there was no evidence of non-covalent complexation between apoBLM and 1 in the gas phase. The intact tethered oligonucleotide 1 gave rise to the base peak at m/z 1305.5. Fragments consistent with sequence-specific ss and ds cleavage of 1 were detected in the full scan MS spectrum. The predicted products of site-specific cleavage for 1 are shown in Figure 6. Single-stranded cleavage occurred predominantly at T12, yielding fragments 3 and 4. The signals at m/z 1265.3 and 949.3 were consistent with the –3 and –4 charged 3′-phosphoglycolate fragment 3. The corresponding tetramer, pACGG (4), was detected at m/z 1277.7. The presence of fragments containing 3′-phosphoglycolate and 5′-phosphate termini verified the occurrence of the oxygen-dependent cleavage pathway A (Fig. 2; 22,39). Acquisition of CID data for both ss cleavage products (m/z 1265.3 and 1277.7) and analysis of the diagnostic gas phase fragments allowed verification of these products and thus confirmed sequence-specific Fe–BLM-induced ss cleavage at T12. In contrast, fragments due to ss cleavage at T4 were barely visible after 1 min reaction time: a weak signal at m/z 982.5 was consistent with the 3′-phosphoglycolate cleavage product, CCGpg (6). In principle, this fragment could either arise from ss cleavage at T4 only or in a second cleavage event after initial scission at T12. The corresponding 5′-phosphate piece (5) was detected at m/z 1363.3 in extremely low abundance (peak not labeled at t = 1 and 10 min), indicating a minute amount of independent ss cleavage at T4. Additionally, the doubly cleaved oligonucleotide fragment 7 was also observed at m/z 1332.4 and 888.3, albeit at low intensities. It is presumed that ds cleavage must have predominantly arisen from a single molecule of Fe–BLM catalyzing two cleavage events, since it is considered unlikely that activated BLM could bind to the partially ss, truncated oligonucleotide 3 in solution and cause the second cleavage event. Verification of the proposed minor fragments 5, 6 and 7 by MS/MS was not practical after 1 min reaction time due their low signal abundances. Interpretation of the full scan MS data after exposure of 1 to Fe–BLM for 1 min revealed predominant cleavage at T12 and limited ss cleavage at T4 and/or ds cleavage. There was no evidence of random cleavage products. These results were in accordance with the predicted cleavage events and supported the validity of this ESI-MS-based analytical method.
Figure 5.
Fe–BLM-induced degradation of 1 monitored by full scan ESI MS analysis. (a) MS spectrum of the crude reaction mixture quenched with acidic EDTA after 1 min. (b) Acquired MS data of the reaction mixture quenched with acidic EDTA after 10 min. (c) MS analysis of the unquenched reaction. All identified products are labeled in Table 2.
Table 2. List of observed ions in the full scan MS analysis of Fe–BLM-induced degradation of 1 and 2, respectively.
Signals due to bleomycin, its iron complex, degradation products and adducts were observed in both experiments and are listed at the top of the table.
Figure 6.
Predicted oligonucleotide fragments resulting from site-specific ss and ds cleavages of the tethered duplex oligonucleotides 1 and 2 induced by activated Fe–BLM in the presence of O2. p and pg denote phosphate and phosphoglycolate termini, respectively.
ESI-ITMS analysis of the reaction mixture at several other time points (2, 4 and 10 min) showed increasingly elevated intensities of the predicted cleavage fragments (see Fig. 5b for t = 10 min). In addition, the MS spectrum of an unquenched sample (t∞) is shown in Figure 5c. In the absence of EDTA, the intact non-covalent oligonucleotide–Fe–BLM ternary complex was now observed at m/z 1340.2 (M–5H)5– and 1116.9 (M–6H)6–. Since full scan spectra acquired at earlier time points provided no evidence for complex formation between 1 and apoBLM, this result reconfirmed the importance of iron ions for the detection of the non-covalent complex in the gas phase. Therefore, the observed apparent gas phase stability of Fe–BLM/1 must have been predominantly due to electrostatic interactions between the iron cation and the negatively charged sugar–phosphate backbone. No straightforward correlation between the complexation behavior in solution and in the gas phase can be derived (33,34). At t∞ all cleavage products were observed at sufficient intensities to acquire CID data. These data verified the proposed structures of 5 and 6, confirming a small amount of independent ss cleavage at T4. Furthermore, the full scan MS data of the unquenched reaction revealed substantial amounts of apparent ds cleavage, evident by the presence of intense ions at m/z 1332.5 and 888.4. The proposed structure of 7 was ascertained by MS/MS analysis of m/z 888.4. Hence, when the reaction was allowed to proceed to completion, predominant ss cleavage at T12, minor ss cleavage at T4 and substantial ds cleavage were observed. It should be noted, however, that under these experimental conditions the ds cleavage product might theoretically arise from two independent ss cleavage events rather than from one molecule of Fe–BLM catalyzing both cleavages. The Fe–BLM-induced degradation of 2, described below, served as a control for the propensity of this alternative cleavage mechanism. Ultimately, cleavage of 1 will have to be investigated under ‘single hit conditions’ to ensure ds cleavage without the aforementioned interferences. Efforts to carry out these experiments are currently in progress.
Fe–BLM-induced cleavage of 2
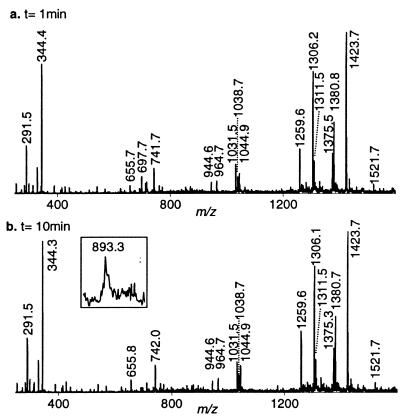
Recent studies (7,21) showed that a hairpin oligonucleotide containing the GGCC sequence yielded no ds cleavage products resulting from staggered scission at the positions corresponding to C5 and C13 in 2 under single hit conditions. Instead, small amounts of blunt ended ds cleavage products at the positions corresponding to C5/C12 or G4/C13 were observed. Fe–BLM-induced cleavage of 2, containing the core sequence GGCC, was performed as a control experiment in which such ds cleavage products due to a single Fe–BLM molecule should not be detected (16–19). The predicted site-specific cleavage products for 2 are shown in Figure 6. They included the phosphoglycolate fragments (8 and 11) and the phosphate fragments (9 and 10), as well as the apparent ds cleavage product (12). Figure 7a shows the full scan mass spectrum of the crude reaction mixture quenched with EDTA after 1 min. All identified ions are listed in Table 2. Fragment 8 was observed at m/z 1375.5 and 1031.5, as was the corresponding phosphate fragment (9) at m/z 964.7. These ions reflected site-specific cleavage at C13. The presence of compounds 10 (m/z 1259.6 and 944.6) and 11 (m/z 1311.5) verified Fe–BLM-induced cleavage at C5. The fragments were detected in abundances comparable to 8 and 9, indicating that cleavage of 2 occurred without a pronounced preference for either ss cleavage site. These findings were in marked contrast to the Fe–BLM-induced cleavage of 1. In addition, no ds cleavage was observed after 1 min reaction time. The reaction showed little change in cleavage product intensities after 10 min (Fig. 7b). However, minute amounts of compound 12 (m/z 893.3 {z = –3}) were observed after 10 min and in the unquenched reaction (t∞) (see inset to Fig. 7b). The presence of 12 furnished evidence for ds cleavage via two independent ss cleavage events. Its structure was confirmed by MS/MS analysis. Analysis of MS/MS data for all other cleavage ions confirmed the structural assignments and verified sugar damage at the 5′-GC sites. There was absolutely no indication of blunt ended ds cleavage products at any time in the experiment. The minute amount of ds cleavage observed in this experiment was thus attributed to the selected experimental conditions. Since these studies were not carried out under single hit conditions, apparent ds cleavage could occur in principle by sequential scission at C5 and C13, induced by two activated Fe–BLM molecules.
Figure 7.
Degradation of 2 by activated Fe–BLM. Full scan ESI MS analysis. (a) Recorded MS spectrum of the quenched reaction mixture. The non-covalent Fe–BLM/2 complex was destroyed by addition of acidified EDTA after 1 min. (b) The full scan MS spectrum shows the quenched reaction mixture after 10 min. The unquenched reaction (full scan not shown) yielded maximum abundance of the doubly cleaved fragment 12 (m/z = 893.3) (see inset). Identified cleavage products are listed in Table 2.
Comparison of the Fe–BLM-induced cleavage profiles of 1 and 2 accurately reflected the predicted differences. Oligonucleotide 1 underwent significant ds cleavage, evident by the formation of compound 7, whereas in contrast, oligonucleotide 2 yielded only minute amounts of the corresponding doubly truncated fragment 12, even in the presence of an excess of activated Fe–BLM. The occurrence of 12 was indicative of a competing apparent ds cleavage mechanism, involving sequential ss cleavages by two Fe–BLM molecules. Independent ds cleavage according to this mechanism is believed to be unfavorable, due to the required binding of activated Fe–BLM to a truncated, partially ss oligonucleotide fragment. The low propensity for apparent ds cleavage of oligonucleotide 2 and the absence of blunt ended ds cleavage products also verified that ds cleavage of 1 must have been primarily due to damage by a single Fe–BLM molecule without dissociation of the complex after the initial ss cleavage event. These results provided strong evidence for the validity of our cleavage model. However, quantitative investigation of ss:ds ratios will be needed to definitively prove that Fe–BLM-induced DNA damage does indeed occur according to this proposed cleavage mechanism.
CONCLUSION
Degradation of duplex oligonucleotides after exposure to activated Fe–BLM was investigated. The methodology described herein relied on two key design elements. (i) The use of tethered oligonucleotide analytes enabled reliable duplex formation of short complementary strands in solution at room temperature. The presence of the polyethylene oxide spacer did not complicate interpretation of MS and MS/MS data due to its stability in ESI experiments and under CID conditions, respectively. More importantly, problems usually associated with tracking ss and ds cleavage events posed no difficulties as diagnostic truncated, tethered fragments were generated. (ii) MS and MS/MS analyses of the crude reaction allowed accurate and fast qualitative determination of all cleavage products present in solution, bypassing the need for a separation step. Such steps are often accompanied by decomposition of cleavage products due to the extreme instability of the lesions. Observed differences in cleavage patterns were strongly dependent on the incorporated binding site and in accordance with earlier findings on sequence-specific Fe–BLM-induced damage. These results validated the use of tethered oligonucleotides for accurate modeling of DNA cleavage by Fe–BLM. The speed and accuracy of ESI-MS-based methodologies make this approach ideally suited for future studies aimed at monitoring complex DNA cleavage processes on line. While current efforts were limited to a qualitative investigation of Fe–BLM-induced damage, these experiments will also be readily amenable to quantitative analysis for the determination of ss:ds cleavage ratios of DNA cleavage under single hit conditions. This will be accomplished by coupling high performance separation techniques such as HPLC or HPCE to ESI-MS. Finally, this analytical approach should also be of general applicability for modeling DNA–drug and DNA–protein interactions.
SUPPLEMENTARY MATERIAL
See Supplementary Material available at NAR Online.
Acknowledgments
ACKNOWLEDGEMENTS
This work was supported by the National Institute of Health, grant nos CA69390 (P.V.), CA71993 (P.V.) (received as a subcontract from Harvard Medical School) and GM34454 (J.S.). R.C.B. would like to thank the Damon Runyon–Walter Winchell Cancer Research Foundation for a research fellowship.
REFERENCES
- 1.Stubbe J. and Kozarich,J.W. (1987) Chem. Rev., 87, 1107–1136. [Google Scholar]
- 2.Sikic B.I., Rosencweig,M. and Carter,S.K. (1985) In Carter,S.K. (ed.), Bleomycin Chemotherapy. Academic Press, Orlando, FL.
- 3.Lazo J.S. and Chabner,B.A. (1996) In Chabner,B.A. and Longo,D.L. (eds), Cancer Chemotherapy and Biotherapy: Principles and Practice, 2nd Edn. Lippincott Williams & Wilkins Publishers, Philadelphia, PA. [Google Scholar]
- 4.Stubbe J., Kozarich,J.W., Wu,W. and Vanderwall,D.E. (1996) Acc. Chem. Res., 29, 322–330. [Google Scholar]
- 5.Burger R.M. (1998) Chem. Rev., 98, 1153–1169. [DOI] [PubMed] [Google Scholar]
- 6.Hecht S.M. (1994) Bioconjugate Chem., 5, 513–526. [DOI] [PubMed] [Google Scholar]
- 7.Povirk L.F., Han,Y.H. and Steighner,R.J. (1989) Biochemistry, 28, 5808–5814. [DOI] [PubMed] [Google Scholar]
- 8.Steighner R.J. and Povirk,L.F. (1990) Proc. Natl Acad. Sci. USA, 87, 8350–8354. [DOI] [PMC free article] [PubMed] [Google Scholar]
- 9.Sam J.W., Tang,X.-J. and Peisach,J. (1994) J. Am. Chem. Soc., 116, 5250–5256. [Google Scholar]
- 10.Worth L., Frank,B.L., Christner,D.F., Absalon,M.J., Stubbe,J. and Kozarich,J.W. (1993) Biochemistry, 32, 2601–2609. [DOI] [PubMed] [Google Scholar]
- 11.Wu J.C., Kozarich,J.W. and Stubbe,J. (1983) J. Biol. Chem., 258, 4694–4697. [PubMed] [Google Scholar]
- 12.Giloni L., Takeshita,M., Johnson,F., Iden,C. and Grollman,A.P. (1981) J. Biol. Chem., 256, 8608–8615. [PubMed] [Google Scholar]
- 13.McGall G.H., Rabow,L.E., Ashley,G.W., Wu,S.H., Kozarich,J.W. and Stubbe,J. (1992) J. Am. Chem. Soc., 114, 4958–4967. [Google Scholar]
- 14.Burger R.M., Drlica,K. and Birdsall,B. (1994) J. Biol. Chem., 269, 25978–25985. [PubMed] [Google Scholar]
- 15.Rabow L.E., Stubbe,J. and Kozarich,J.W. (1990) J. Am. Chem. Soc., 112, 3196–3203. [Google Scholar]
- 16.Kuwahara J. and Sugiura,Y. (1988) Proc. Natl Acad. Sci. USA, 85, 2459–2463. [DOI] [PMC free article] [PubMed] [Google Scholar]
- 17.Takeshita M., Grollman,A.P. and Ohtsubo,E. (1978) Proc. Natl Acad. Sci. USA, 75, 5983–5987. [DOI] [PMC free article] [PubMed] [Google Scholar]
- 18.D’Andrea A.D. and Haseltine,W.A. (1978) Proc. Natl Acad. Sci. USA, 75, 3608–3612. [DOI] [PMC free article] [PubMed] [Google Scholar]
- 19.Takeshita M., Kappen,L.S., Grollman,A.P., Eisenberg,M. and Goldberg,I.H. (1981) Biochemistry, 20, 7599–7606. [DOI] [PubMed] [Google Scholar]
- 20.Povirk L.F. (1983) In Neidle,S. and Waring,M. (eds), Molecular Aspects of Anti-Cancer Drug Action. Macmillan, London, UK, pp. 157–181.
- 21.Absalon M.J., Kozarich,J.W. and Stubbe,J. (1995) Biochemistry, 34, 2065–2075. [DOI] [PubMed] [Google Scholar]
- 22.Absalon M.J., Wu,W., Kozarich,J.W. and Stubbe,J. (1995) Biochemistry, 34, 2076–2086. [DOI] [PubMed] [Google Scholar]
- 23.Vanderwall D.E., Lui,S.M., Wu,W., Turner,C.J., Kozarich,J.W. and Stubbe,J. (1997) Chem. Biol., 4, 373–387. [DOI] [PubMed] [Google Scholar]
- 24.Murugesan N., Xu,C., Ehrenfeld,G.M., Sugiyama,H., Kilkuskie,R.E., Rodriguez,L.O., Chang,L.-H. and Hecht,S.M. (1985) Biochemistry, 24, 5735–5744. [DOI] [PubMed] [Google Scholar]
- 25.Karas M. and Hillenkamp,F. (1988) Anal. Chem., 60, 2299–2301. [DOI] [PubMed] [Google Scholar]
- 26.Fenn J.B., Mann,M., Meng,C.K., Wong,S.F. and Whitehouse,C.M. (1989) Science, 246, 64–71. [DOI] [PubMed] [Google Scholar]
- 27.Triolo A., Arcamone,F.M., Raffaelli,A. and Salvadori,P. (1997) J. Mass Spectrom., 32, 1186–1194. [DOI] [PubMed] [Google Scholar]
- 28.Gao Q., Cheng,X., Smith,R.D., Yang,C.F. and Goldberg,I.H. (1996) J. Mass Spectrom., 31, 31–36. [DOI] [PubMed] [Google Scholar]
- 29.Gale D.C. and Smith,R.D. (1995) J. Am. Soc. Mass Spectrom., 6, 1154–1164. [DOI] [PubMed] [Google Scholar]
- 30.Stokey L.L. (1970) Anal. Chem., 42, 779–781. [Google Scholar]
- 31.Mirabelli C.K., Ting,A., Huang,C.-H., Mong,S. and Crooke,S.T. (1982) Cancer Res., 42, 2779–2785. [PubMed] [Google Scholar]
- 32.Povirk L.F., Wübker,W., Köhnlein,W. and Hutchinson,F. (1977) Nucleic Acids Res., 4, 3573–3580. [DOI] [PMC free article] [PubMed] [Google Scholar]
- 33.Smith R.D. and Light-Wahl,K.J. (1993) Biol. Mass Spectrom., 22, 493–501. [Google Scholar]
- 34.Przybylski M. and Glocker,M.O. (1996) Angew. Chem. Int. Edn Engl., 35, 806–826. [Google Scholar]
- 35.McLuckey S.A. and Habibi-Goudarzi,S. (1993) J. Am. Chem. Soc., 115, 12085–12095. [Google Scholar]
- 36.McLuckey S.A., Van Berkel,G.J. and Glish,G.L. (1992) J. Am. Soc. Mass Spectrom., 3, 60–70. [DOI] [PubMed] [Google Scholar]
- 37.Dell A., Morris,H.R., Levin,M.D. and Hecht,S.M. (1981) Biochem. Biophys. Res. Commun., 102, 730–738. [DOI] [PubMed] [Google Scholar]
- 38.Dell A., Morris,H.R., Levin,M.D. and Hecht,S.M. (1980) Biochem. Biophys. Res. Commun., 97, 987–994. [DOI] [PubMed] [Google Scholar]
- 39.Burger R.M., Peisach,J. and Horwitz,S.B. (1982) J. Biol. Chem., 257, 3372–3375. [PubMed] [Google Scholar]
Associated Data
This section collects any data citations, data availability statements, or supplementary materials included in this article.


