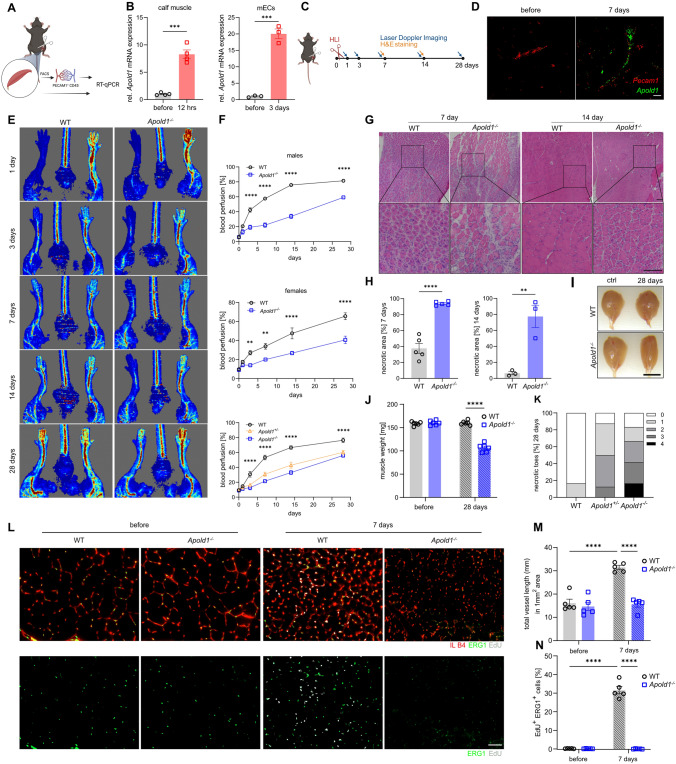
Fig. 4.
Impaired revascularization, angiogenesis, and EC proliferation after hindlimb ischemia in Apold1−/− mice. A Experimental design. B Apold1 expression in qRT-PCR in whole calf muscle tissue 12 h after hindlimb ischemia (left) and in muscle ECs (right) 3 days after hindlimb ischemia in WT mice (n = 3–4 per group). C Experimental design. D Representative image of in situ hybridization for Apold1 7 days after ischemia in the ischemic muscle (ipsilateral) and the contralateral control muscle. Scale bar, 20 μm. E Representative images of blood perfusion measured by laser Doppler imaging (LDI) 1, 3, 7, 14, and 28 days after hindlimb ischemia in Apold1−/− and WT mice. F Time course quantification of blood perfusion across 28 days after hindlimb ischemia comparing recovery in Apold1−/− vs. WT males (n (WT/Apold1−/−) = 6/6), females (n (WT/Apold1−/−) = 6/6), and in a separate experiment in Apold1−/−, Apold1±, and WT males (n (WT/Apold1±/Apold1−/−) = 6/6/4). G Representative hematoxylin–eosin (H&E) staining images of the triceps surae muscles at 7 and 14 days after hindlimb ischemia. Scale bar, 100 μm. H Quantification of necrotic area 7 and 14 days after hindlimb ischemia in WT and Apold1−/− mice (n (WT/Apold1−/−) = 6/6). I Photographs of whole calf muscle isolated from control and ischemic leg of WT and Apold1−/− mice. Scale bar, 7 mm. J Whole calf muscle weight 28 days after hindlimb ischemia (n = 6 per group). K Measurement of number of necrotic toes 28 days after hindlimb ischemia (n = 8–12 per group). L Representative images of isolectin B4 (IL B4, red), Erg1 (green), and EdU (white) immunofluorescent images on gastrocnemius muscle cross-sections of control and ischemic leg 7 days after hindlimb ischemia in WT and Apold1−/− mice. Scale bar, 50 μm. M Total vessel length in 1 mm2 area of muscle cross-sections before and 7 days after hindlimb ischemia in WT and Apold1−/− mice (n = 5 per group). N Percentage of EdU+ Erg1+ proliferating mECs at 7 days after induction of hindlimb ischemia (n = 5 per group). Student’s t test in B, H, and J; Two-way ANOVA with Sidak’s multiple comparison test in F; Two-way ANOVA with Tukey’s multiple comparison test in M and N (**p < 0.01; ***p < 0.001; and ****p < 0.0001). The data shown are mean ± SEM

