Fig. 5.
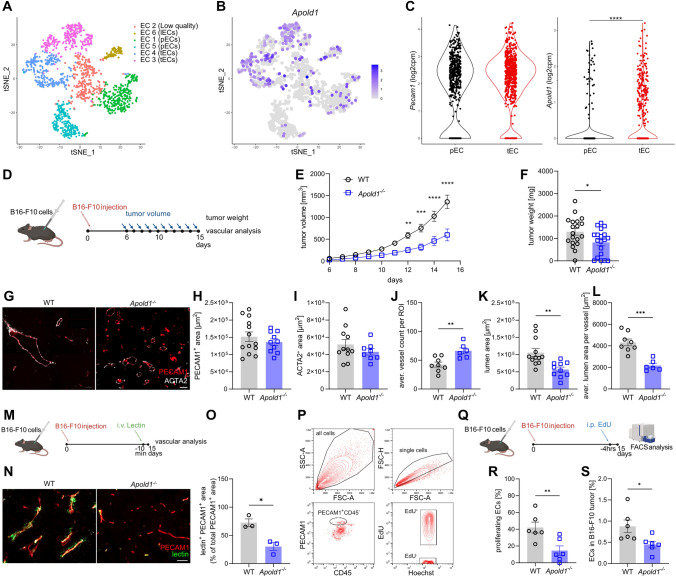
Apold1 is enriched in tumor ECs and loss of Apold1 slows tumor growth. A t-Stochastic neighbor embedding (tSNE) plots of distribution of ECs in lung tissue resected from 5 patients with untreated, non-metastatic lung tumors reanalyzed [67]. B t-Stochastic neighbor embedding (tSNE) plots of distribution of Apold1 in ECs in lung tissue reanalyzed [67]. C Apold1 expression in tumor ECs (tECs) compared to pulmonary ECs (pECs) reanalyzed [67]. D Experimental design. E In vivo measurement of tumor volume in Apold1−/− and WT mice after injection of B16-F10 melanoma cells (n (WT/Apold1−/−) = 11/11). F Weight of isolated tumors 15 days after injection (n (WT/Apold1−/−) = 19/19). G Representative images of the vasculature in tumors isolated from WT and Apold1−/− mice stained for PECAM1 (red) and ACTA2 (white). Scale bar, 100 µm. H Quantification of PECAM1+ area (n (WT/Apold1−/−) = 13/10) and I ACTA2+ area (n (WT/Apold1−/−) = 13/10). Scale bar, 100 µm. (J) Quantification of average vessel count per region of interest (ROI) (n (WT/Apold1−/−) = 8/6), K lumen size (n (WT/Apold1−/−) = 12/10), and L average lumen area per vessel (n (WT/Apold1−/−) = 8/6). M Experimental design. N Representative image of perfusion stained by injected fluorescein-labeled Lycopersicon esculentum (tomato) lectin (green) in PECAM1+ (red) in tumors isolated from WT and Apold1−/− mice. O Percentage of lectin+PECAM1+ area of total PECAM1+ area (n (WT/Apold1−/−) = 3/3). P Representative flow cytometric analysis of ECs (PECAM1+CD45−) and proliferating ECs (EdU+) in B16-F10 melanoma. Q Experimental design. R Percentage of proliferating ECs (EdU+) (n (WT/Apold1−/−) = 6/6) and S percentage of ECs (PECAM1+CD45+) in B16-F10 melanoma (n (WT/Apold1−/−) = 6/6). Student’s t test in C, F, H, I, J, K, L, O, R, and S. Two-way ANOVA with Sidak’s multiple comparison test in E (*p < 0.05; **p < 0.01; and ***p < 0.001). The data shown are mean ± SEM

