

Abstract
Objective
To evaluate the predictive value of monocyte (M) to high-density lipoprotein cholesterol (HDL-C) ratio (MHR) and tumor markers in colorectal cancer (CRC) and their correlation with clinicopathological characteristics.
Methods
Hematology test data and medical records of 202 CRC patients and 201 healthy subjects were collected retrospectively. The diagnostic efficacy of MHR was evaluated using receiver operating characteristic (ROC) curves and risk factors for CRC were analyzed by multivariate logistic regression.
Results
CRC patients had significantly higher M, MHR, carcinoembryonic antigen (CEA), and carbohydrate antigen 199 (CA199) levels, but significantly lower HDL-C levels than healthy controls (all P < 0.05). Additionally, MHR was positively correlated with tumor differentiation in CRC patients (P = 0.049); CEA and CA199 levels in CRC patients increased with increased stage, lymph node metastasis and tumor size ≥ 5 cm (all P < 0.05). Furthermore, high levels of MHR, CA199 and CEA were independent risk factors for CRC. The area under ROC curve of MHR combined with CEA and CA199 was 0.882/0.869 for the diagnosis of CRC, respectively.
Conclusion
This is the first study to explore the predictive value of MHR in CRC, and its continuous increase is an independent risk factor for CRC. MHR is a promising predictor for CRC progression along with CA199 and CEA.
Keywords: Monocytes to high-density lipoprotein cholesterol ratio, Colorectal cancer, Carcinoembryonic antigen, Carbohydrate antigen 199, Tumor markers
Introduction
Colorectal cancer (CRC) refers to cancers that arise from the colorectal epithelium, including colon cancer and rectal cancer. According to statistics, CRC mortality in the United States ranked second among all malignancies in 2020 [1, 2]. Similarly, CRC is the most common malignancy in China [3]. Due to changes in lifestyle, dietary structure, aging population, and lack of regular physical examination in recent years, the number of CRC cases has increased annually, seriously affecting people's quality of life. The 5-year survival rate of CRC patients decreases with increased diagnosis time, late tumor stage (WHO classification), and significant symptoms [4]. Improvement in the prognosis of CRC patients largely depends on the early diagnosis of CRC, tumor size, pathological differentiation, and WHO classification of tumor. Therefore, finding hematological markers for early CRC diagnosis is vital for the survival and prognosis of patients [5, 6].
Monocyte count (M; a hematology indicator) to high-density lipoprotein cholesterol (HDL-C; a blood lipid indicator) ratio (MHR) is a new prognostic marker for inflammation associated with cardiovascular diseases. MHR has been used in studies of diabetic retinopathy, nonalcoholic hepatitis and atherosclerosis [7–9]. Carcinoembryonic antigen (CEA), carbohydrate antigen 199 (CA199) are tumor markers that are easily measured during clinical work and have high detection efficiency. Therefore, this study aims to explore the predictive value of MHR combined with tumor markers in CRC and to analyze the relationship between these parameters and the clinicopathological characteristics of CRC patients in order to provide insights to the detection and treatment of CRC.
Patients and methods
Patients
A total of 202 CRC patients (CRC group) diagnosed by histopathology who were hospitalized in our hospital from March 2018 to June 2022 were enrolled (mean age, 62.09 ± 12.30 years). 201 healthy individuals (mean age, 59.37 ± 7.67 years; control group) who underwent physical examination at our hospital during the same period were also included. This study was approved by the Ethics Committee of The First Affiliated Hospital of Guangxi Medical University (Approval Number: 2022-E366-01). All the participants were orally informed and agreed to participate. There was no significant difference in age between the two groups. Inclusion criteria for the CRC group: (1) CRC confirmed by histopathology; (2) Hematology, blood biochemistry, blood lipid and tumor marker tests before surgery. Exclusion criteria: (1) After undergoing surgery or treatment; (2) other tumors or malignancies; (3) serious infection and chronic disease.
Methods
Fasting venous blood was collected from all patients, and monocytes were counted using the LH780 analyzer within 2 h. Aspartate aminotransferase, alanine aminotransferase (ALT), and other parameters were measured using a biochemical analyzer, and CEA, CA199 and carbohydrate antigen 125 (CA125) levels were measured using the Roche immunology analyzer. According to the clinicopathological data of CRC patients, the clinical stage of each patient (stage I to IV) was determined based on the 8th edition of the TNM Classification of Malignant Tumors published by the American Joint Commission on Cancer (AJCC).
Statistical analysis
Data were analyzed using SPSS 20.0 (IBM Corp, Armonk, NY). Count data were expressed as frequency and percentage, and measured data were expressed as mean ± standard (X ± SD) or mean (quartile). Data were compared between groups using the independent sample T-test or Mann–Whitney U-test, and correlation was analyzed using Spearman correlation analysis. Risk factors for CRC were identified by multivariate logistic regression. A P < 0.05 was considered statistically significant.
Results
Pathological characteristics of CRC patients
As shown in Table 1, 133 of the 202 CRC were males (65.80%), with a mean age of 62.09 ± 12.30 years. There were 40(19.80%) and 52(25.74%) patients with smoking and drinking history, respectively. Moreover, 34(16.80%), 75(37.10%), 71(35.10%) and 22(10.90%) patients were of pathological stage I, II, III and IV CRC, respectively. A total of 100 (49.50%) patients had lymph node metastasis, 117(57.80%) had rectal tumors, and 85(42.10%) had colon tumors. The tumor size was < 5 cm in 116 cases (57.40%). In addition, 34(16.80%) and 12(5.90%) patients had well-differentiated and poorly differentiated tumors, respectively. A total of 62(30.70%) and 46(22.80%) patients had mass tumors and ulcerating tumors, respectively. 167(82.7%) patients were tested positive for the occult blood test.
Table 1.
Pathological characteristics of 202 CRC patients
| Indicators | Value |
|---|---|
| Sex, Male, n (%) | 133 (65.80) |
| Age, Male, M ± SD | 62.09 ± 12.30 |
| Smoking, n (%) | |
| Yes | 40 (19.80) |
| No | 162 (80.20) |
| Drinking, n (%) | |
| Yes | 52 (25.74) |
| No | 150 (74.26) |
| Tumor stage, n (%) | |
| I | 34 (16.80) |
| II | 75 (37.10) |
| III | 71 (35.10) |
| IV | 22 (10.90) |
| Lymph node metastasis, n (%) | |
| No | 102 (50.50) |
| Yes | 100 (49.50) |
| Tumor location, n (%) | |
| Rectum | 117 (57.80) |
| Colon | 85 (42.10) |
| Tumor size, n (%) | |
| < 5 | 116 (57.40) |
| ≥ 5 | 86 (42.60) |
| Tumor differentiation, n (%) | |
| Senior | 34 (16.80) |
| Middle + | 156 (77.20) |
| low | 12 (5.90) |
| Tumor type, n (%) | |
| Mass | 62 (30.70) |
| Infiltration | 94 (46.50) |
| Ulcers | 46 (22.80) |
| Occult blood test, n (%) | |
| Negative | 35 (17.30) |
| Positive | 167 (82.7) |
Comparison of MHR, hematology parameters and tumor markers between CRC and controls
The ALT (P = 0.014), total protein (P < 0.001), total cholesterol (P < 0.001), Triglyceride (P < 0.001), M (P < 0.001), HDL-C (P < 0.001), MHR (P < 0.001), CEA (P < 0.001), CA199 (P < 0.001) levels were significantly different between CRC patients and healthy controls (Table 2). HDL-C was significantly lower in CRC patients than in healthy controls. However, MHR, CEA, and CA199 were significantly higher in CRC patients than in healthy controls (Fig. 1).
Table 2.
Comparison of MHR, hematology parameters and tumor markers between CRC patients and healthy controls
| Indicators | Colorectal cancer | Controls | F | P |
|---|---|---|---|---|
| N | 202 | 201 | ||
| Age | 60.65 ± 12.23 | 59.37 ± 7.67 | 45.57 | 0.210 |
| ALT | 20.20 ± 15.47 | 23.72 ± 12.98 | 0.23 | 0.014 |
| AST | 26.83 ± 15.24 | 24.86 ± 8.12 | 10.12 | 0.106 |
| Total protein | 68.22 ± 8.41 | 72.87 ± 4.88 | 29.14 | < 0.001 |
| Total cholesterol | 4.81 ± 1.04 | 4.44 ± 0.69 | 1053 | < 0.001 |
| Triglyceride | 1.56 ± 1.25 | 1.13 ± 0.36 | 44.53 | < 0.001 |
| Monocyte count | 0.64 ± 0.30 | 0.42 ± 0.10 | 28.50 | < 0.001 |
| HDL-C | 1.17 ± 0.31 | 1.32 ± 0.20 | 29.87 | < 0.001 |
| LDL-C | 3.01 ± 0.86 | 2.91 ± 0.17 | 147.74 | 0.081 |
| CA153 | 10.79 ± 6.64 | 11.08 ± 5.77 | 43.58 | 0.637 |
| MHR | 0.58 ± 0.29 | 0.33 ± 0.10 | 61.48 | < 0.001 |
| CEA | 3.78 (0.50–160.25) | 2.12 (0.50–12.39) | 65.27 | < 0.001 |
| CA199 | 10.85 (0.00–693.55) | 6.60 (2.00–38.46) | 77.29 | < 0.001 |
| CA125 | 10.05 (2.90–203.50) | 10.50 (2.50–41.50) | 43.58 | 0.502 |
The P value was calculated by Independent-Samples T-test/ Mann–Whitney U-test
ALT alanine aminotransferase, AST aspartate aminotransferase, CA125 carbohydrate antigen 125, CA153 carbohydrate antigen 153, CA199 carbohydrate antigen 199, CEA carcinoembryonic antigen, HDL-C high-density lipoprotein cholesterol, LDL-C low-density lipoprotein cholesterol, MHR monocytes to high-density lipoprotein cholesterol ratio
Fig. 1.

Differences in MHR (A), CA199 (B), and CEA (C) between CRC patients and healthy controls. CA199, carbohydrate antigen 199; CEA, carcinoembryonic antigen; MHR, monocytes to high-density lipoprotein cholesterol ratio
Analysis of the difference between MHR and tumor markers and pathological features of colorectal cancer
As shown in Table 3, there was significant difference between MHR and differentiation degree in 202 CRC patients (P = 0.049). CEA was significantly different from tumor stage (P < 0.001), lymph node metastasis (P = 0.004), tumor size (P = 0.013) and tumor type (P = 0.017). Meanwhile, there were significant differences between CA199 and tumor stage (P = 0.001), lymph node metastasis (P < 0.001), and tumor size (P = 0.013). Of note, MHR of CRC patients increased with the low degree of tumor differentiation (Fig. 2A). CA199 (Fig. 2B) and CEA (Fig. 2C) levels in CRC patients increased with the increase of late stage, lymph node metastasis and tumor size ≥ 5 cm. Moreover, the CEA levels of CRC patients with ulcerative and infiltrative tumor types are higher than those with mass types (Fig. 2C).
Table 3.
Relationship among MHR, tumor markers and pathological features of CRC
| Indicators | MHR | P | CEA | P | CA199 | P |
|---|---|---|---|---|---|---|
| Tumor stage | ||||||
| I | 0.60 (0.22–3.12) | 0.941 | 2.68 (0.55–114.6) | < 0.001 | 6.45 (2.00–183.31) | 0.001 |
| II | 0.29 (0.06–1.68) | 3.39 (0.5–125.08) | 12.75 (0.00–430.00) | |||
| III | 0.62 (0.22–1.09) | 4.43 (0.75–64.07) | 9.80 (0.03–460.00) | |||
| IV | 0.59 (0.18–2.25) | 18.28 (1.22–160.25) | 143.19 (0.20–693.55) | |||
| Lymph node metastasis | ||||||
| Absence | 0.53 (0.08–2.46) | 0.593 | 3.03 (0.50–114.60) | 0.004 | 9.73 (0.00–430.00) | < 0.001 |
| Presence | 0.52 (0.16–1.79) | 5.68 (0.75–160.25) | 11.27 (0.03–693.55) | |||
| Tumor location | ||||||
| Rectum | 0.55 (0.08–1.76) | 0.166 | 3.73 (0.50–143.46) | 0.890 | 11.6 (0.00–693.55) | 0.233 |
| Colon | 0.50 (0.15–2.46) | 3.79 (0.91–160.25) | 9.49 (2.00–655.22) | |||
| Tumor size | ||||||
| < 5 cm | 0.52 (0.08–2.46) | 0.850 | 3.33 (0.55–143.46) | 0.013 | 8.76 (0.00–693.55) | 0.013 |
| ≥ 5 cm | 0.54 (0.18–1.46) | 4.77 (0.50–160.25) | 17.13 (0.03–525.72) | |||
| Tumor differentiation | ||||||
| Senior | 0.51 (0.08–1.79) | 0.049 | 3.36 (0.55–143.46) | 0.149 | 9.28 (2.00–411.51) | 0.368 |
| Middle + Low | 0.57 (0.18–2.46) | 3.92 (0.50–160.25) | 11.02 (0.00–693.55) | |||
| Tumor type | ||||||
| Mass | 0.50 (0.18–2.46) | 0.407 | 3.24 (0.75–77.70) | 0.017 | 11.51 (2.00–161.30) | 0.685 |
| Infiltration + Ulcers | 0.54 (0.08–1.56) | 4.12 (0.50–160.25) | 10.33 (0.00–693.55) | |||
| Occult blood test | ||||||
| Negative | 0.54 (0.20–1.56) | 0.683 | 3.73 (0.55–77.7) | 0.811 | 9.88 (2.00–525.72) | 0.651 |
| Positive | 0.53 (0.08–2.46) | 3.79 (0.50–160.25) | 10.93 (0.00–693.55) | |||
The P value was calculated by Kruskal–Wallis test/Mann–Whitney U test
CA199 carbohydrate antigen 199, CEA carcinoembryonic antigen, MHR monocytes to high-density lipoprotein cholesterol ratio
Fig. 2.

Differences between MHR (A), CA199 (B), CEA (C) and clinicopathological features of CRC. A, MHR Vs. Tumor differentiation. B1, CA199 Vs. Tumor stage; B2, CA199, Vs. Lymph node metastasis; B3, CA199 Vs. Tumor size. C1, CEA Vs. Tumor stage; C2, CEA Vs. Lymph node metastasis; C3, CEA Vs. Tumor size. C4, CEA Vs. Tumor type. CA199, carbohydrate antigen 199; CEA, carcinoembryonic antigen; MHR, monocytes to high-density lipoprotein cholesterol ratio
Correlation between various indexes and pathological characteristics in the CRC group
As shown in Table 4, MHR level was positively correlated with the degree of tumor differentiation (P/r = 0.049/0.139, Fig. 3A). CA199 (Fig. 3B) was positively correlated with tumor stage (P/r = 0.004/0.202), lymph node metastasis (P/r = < 0.001/0.251), tumor size (P/r = 0.012/0.176), and negatively correlated with body mass index (P/r = 0.041/-0.144). Similarly, CEA (Fig. 3C) was positively correlated with tumor differentiation (P/r = < 0.001/0.325), lymph node metastasis (P/r = 0.004/0.203), tumor size (P/r = 0.012/0.176), and tumor type (P/r = 0.016/0.169) in CRC patients.
Table 4.
Correlation between various indexes and pathological characteristics of CRC patients
| Indicators | MHR | CEA | CA199 |
|---|---|---|---|
| P/r | P/r | P/r | |
| Tumor stage | 0.824/0.016 | < 0.001/0.325 | 0.004/0.202 |
| Lymph node metastasis | 0.593/-0.038 | 0.004/0.203 | < 0.001/0.251 |
| Tumor location | 0.166/-0.098 | 0.891/-0.010 | 0.234/-0.084 |
| Tumor size | 0.851/-0.013 | 0.012/0.176 | 0.012/0.176 |
| Tumor differentiation | 0.049/0.139 | 0.150/0.102 | 0.369/-0.045 |
| Tumor type | 0.409/0.058 | 0.016/0.169 | 0.686/-0.029 |
| Occult blood test | 0.684/-0.029 | 0.812/0.017 | 0.652/0.032 |
| Body mass index | 0.107/0.114 | 0.296/-0.074 | 0.041/-0.144 |
The P value was calculated by Spearman correlation analysis
CA199 carbohydrate antigen 199, CEA carcinoembryonic antigen, MHR monocytes to high-density lipoprotein cholesterol ratio
Fig. 3.

Correlation analysis of MHR (A), CA199 (B), and CEA (C) with clinicopathological features of CRC. A, MHR Vs. Tumor differentiation. B1, CA199 Vs. Tumor stage; B2, CA199 Vs. Lymph node metastasis; B3, CA199 Vs. Tumor size; B4, CA199 Vs. BMI. C1, CEA Vs. Tumor stage; C2, CEA Vs. Lymph node metastasis; C3, CEA Vs. Tumor size; C4, CEA Vs. Tumor type. CA199, carbohydrate antigen 199; CEA, carcinoembryonic antigen; MHR, monocytes to high-density lipoprotein cholesterol ratio
CRC risk factors
As shown in Table 5, high levels of MHR (P < 0.001) CA199 (P = 0.040) and CEA (P < 0.001) were independent risk factors for CRC. Especially, individuals with a high MHR level were 14.79 times more likely to suffer from CRC than those with a low MHR level.
Table 5.
Univariate and multivariate logistic regression analyses of risk factors
| Univariate analysis | Multivariate analysis | |||||||
|---|---|---|---|---|---|---|---|---|
| Indicators | B | Exp(B) | P | 95%Cl | B | Exp(B) | P | 95%Cl |
| MHR | 2.760 | 15.81 | < .001 | 9.71–25.73 | 2.69 | 14.79 | < .001 | 8.57–25.55 |
| CEA | 0.32 | 1.38 | < .001 | 1.24–1.53 | 0.25 | 1.29 | < .001 | 1.17–1.54 |
| CA199 | 0.03 | 1.026 | 0.001 | 1.01–1.04 | 0.03 | 1.03 | 0.040 | 1.00–1.05 |
CA199 carbohydrate antigen 199, CEA carcinoembryonic antigen, MHR monocytes to high-density lipoprotein cholesterol ratio
Comparison of 202 CRC patient’s clinicopathological features stratified by MHR, CEA, CA199
As shown in Table 6, the cutoff values for MHR, CEA, and CA199 are 0.387, 3.61, and 12.95, respectively. According to their cutoff values, the clinical and pathological characteristics of 202 CRC patients were stratified and compared. The results showed that low and high levels of CEA were most closely related to the staging, lymph node metastasis, tumor size, and other factors of CRC patients (P < 0.05).
Table 6.
Comparison of 202 CRC patient’s clinicopathological features stratified by MHR, CEA, CA199
| Indicators | MHR | P | CEA | P | CA199 | P | |||
|---|---|---|---|---|---|---|---|---|---|
| ≤ 0.387 | > 0.387 | ≤ 3.61 | > 3.61 | ≤ 12.95 | > 12.95 | ||||
| Tumor stage | |||||||||
| I + II | 21 | 88 | 0.728 | 61 | 47 | 0.004 | 64 | 45 | 0.669 |
| III + IV | 20 | 73 | 33 | 60 | 51 | 42 | |||
| Lymph node metastasis | |||||||||
| Absence | 20 | 82 | 0.862 | 59 | 43 | 0.002 | 60 | 42 | 0.670 |
| Presence | 21 | 79 | 36 | 64 | 55 | 45 | |||
| Tumor size | |||||||||
| < 5 cm | 21 | 95 | 0.382 | 62 | 54 | 0.046 | 75 | 41 | 0.014 |
| ≥ 5 cm | 20 | 66 | 33 | 53 | 40 | 46 | |||
| Tumor differentiation | |||||||||
| Senior | 4 | 30 | 0.243 | 19 | 15 | 0.266 | 20 | 14 | 0.851 |
| Middle + Low | 37 | 131 | 76 | 92 | 95 | 73 | |||
| Tumor type | |||||||||
| Mass | 15 | 47 | 0.448 | 36 | 26 | 0.047 | 32 | 30 | 0.356 |
|
Infiltration + Ulcers |
26 | 114 | 59 | 81 | 83 | 57 | |||
The P value was calculated by chi square test. The numbers in the table represent the number of samples
CA199 carbohydrate antigen 199, CEA carcinoembryonic antigen, MHR monocytes to high-density lipoprotein cholesterol ratio
Diagnostic efficacy of MHR and tumor markers in CRC
The area under ROC curve (AUC) of MHR, CEA, CA199 for the diagnosis of CRC was 0.842, 0.723, 0.604, respectively. However, the AUC of MHR combined with CEA, and CA199 for the diagnosis of CRC was 0.882, and 0.869, respectively, which were higher than those of CEA, and CA199 alone (Table 7, Fig. 4).
Table 7.
Diagnostic efficacy of MHR combined with tumor markers for CRC
| Indicators | AUC (95%Cl) | Youden | SENS | SPE | z-statistic | P |
|---|---|---|---|---|---|---|
| MHR | 0.842 (0.802–0.876) | 0.60 | 79.70 | 80.10 | 16.67 | < 0.001 |
| CEA | 0.723 (0.676–0.766) | 0.37 | 52.97 | 84.08 | 8.78 | < 0.001 |
| CA199 | 0.604 (0.554–0.652) | 0.20 | 43.07 | 76.62 | 3.665 | < 0.001 |
| MHR + CEA | 0.882 (0.846–0.944) | 0.67 | 73.27 | 93.53 | 21.49 | < 0.001 |
| MHR + CA199 | 0.869 (0.832–0.901) | 0.87 | 71.78 | 90.05 | 19.97 | < 0.001 |
CA199 carbohydrate antigen 199, CEA carcinoembryonic antigen, MHR monocytes to high-density lipoprotein cholesterol ratio, SENS Sensitivity; SPE, Specificity
Fig. 4.
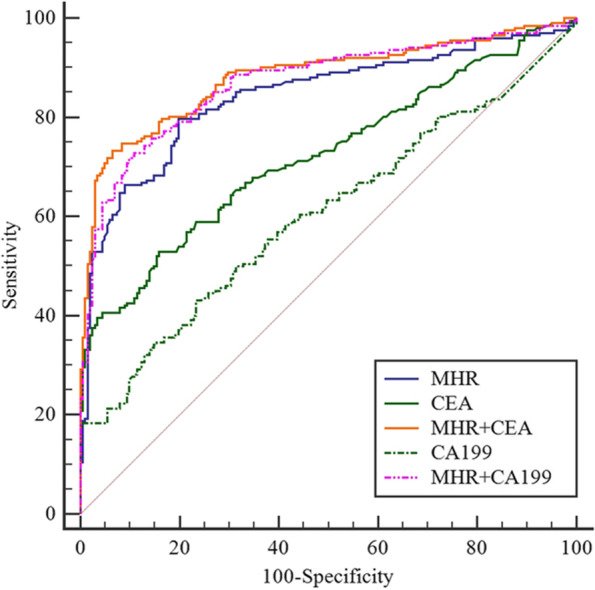
Diagnostic efficiency (ROC curve). CA199, carbohydrate antigen 199; CEA, carcinoembryonic antigen; MHR, monocytes to high-density lipoprotein cholesterol ratio
Discussion
Malignant tumors are associated with the occurrence and development of chronic inflammation. The basic pathological processes of chronic inflammation include endothelial damage, lipid deposition, and oxidative stress [10]. MHR, which relies on a combination of M count and HDL-C, has recently become a new and convenient inflammatory marker. In our study, the hematological data of the 202 CRC patients and 201 healthy controls showed that M count and MHR were higher whereas HDL-C was lower in CRC patients than in the healthy controls. This was consistent with the higher MHR level observed in patients with papillary thyroid cancer and diabetic retinopathy [7, 11]. In addition, a high MHR level has also been used to evaluate disease prognosis. For example, MHR is an independent predictor for long-term hospitalization and mortality in patients with acute coronary syndrome or a post-PCI status, as well as for adverse prognosis related to heart disease [12]. Furthermore, recent studies have found that increased MHR is a new predictor for metabolic disorders, including metabolic syndrome and polycystic ovary syndrome [13, 14].
MHR can reflect both inflammation and lipid accumulation since monocytes are an inflammatory marker and HDL-C is a blood lipid indicator. Hyperlipidemia has been shown to impair the functions of the arterial intima. Low-density lipoprotein (LDL) enters the intima, followed by oxidative modification, which damages the intima. Damaged vascular endothelial cells express adhesion molecules which allow monocytes to bind and migrate to the lower endothelium and mature into macrophages. Oxidized LDL-C promotes the release of pro-inflammatory cytokines and induces chronic inflammation, thereby facilitating the occurrence and development of CRC. HDL is involved in cholesterol reverse transport and has antioxidative and anti-inflammatory effects [15]. Low Cholesterol efflux mediated by low or damaged HDL can lead to the increased monocytes, thus promoting the progression of chronic inflammation [16]. HDL can inhibit the expression of tissue factor in monocytes by preventing the activation of p38c and phosphoinositol 3 kinase [17], downregulate F-actin to prevent monocytes from gathering and adhering to the surface of the vascular endothelium, regulate the activation, proliferation and differentiation of monocytes [18], and thereby effectively inhibit the progression of oxidative stress and inflammatory response [19]. Since monocytes and HDL play significant roles in promoting or inhibiting inflammation and antioxidation [20], respectively, the ratio of these two indicators (MHR) can be used to assess the inflammatory state of the patients and the occurrence and development of chronic inflammation-related diseases, which is more advantageous than a single indicator. Therefore, a high plasma MHR level can serve as an indicator for tumor-related inflammation.
When the relationship between MHR level and the clinicopathological characteristics of CRC patients was analyzed, it was found that MHR level was positively correlated the degree of tumor differentiation in CRC patients. The degree of tumor differentiation is defined as the closeness between tumor cells and normal cells. The lower the degree of tumor differentiation, the higher the malignancy of the tumor. Tumor tissues are similar to the immature morphology of the source tissue, which are greatly different from the corresponding normal source tissue, and grow faster and metastasize more easily. In this study, the MHR increased as the degree of tumor differentiation decreased, indicating that the tumors in patients with high MHR tend to be poorly differentiated, and the degree of malignancy is higher in patients with high MHR than in those with low MHR. Therefore, a continuous increase of MHR serves as a promising marker for CRC progression.
It is well known that serum tumor markers are closely associated with tumor occurrence and development, including CEA, CA199. CEA is a glycoprotein produced by CRC tissues which can be used to assess the existence, development and prognosis of various tumors clinically. CA199 has been used for the diagnosis of adenocarcinoma since its discovery in 1979, and is expressed in various malignant tumors. It is commonly used for disease detection and efficacy evaluation, and is particularly detected in CRC. Some studies have shown that simultaneous detection of various tumor markers can improve the detection rate of malignant tumors [21, 22]. In this study, the level of CEA, CA199 were higher in CRC patients than in healthy controls, which is similar to the findings of Bjorkman et al. [23], Lakemeyer et al. [24] and Luo et al. [25].
TNM staging developed by the AJCC is the most widely used CRC staging system and has demonstrated remarkable value in early evaluation, surgical selection, treatment scheme selection and prognosis evaluation [26]. Therefore, we used the TNM system to classify the pathological characteristics of CRC patients, and it was found that CA199 and CEA were positively correlated with cancer stage, lymph node metastasis, tumor size. Moreover, CEA was also significantly correlated with tumor type. Our results showed that CEA and CA199 levels in CRC patients increased with increased stage, lymph node metastasis and tumor size ≥ 5 cm, which suggested that CEA and CA199 are closely associated with the clinicopathological characteristics of CRC. In particular, high levels of CEA and CA199 can guide the clinicopathological staging of CRC, which is similar to the results of Björkman K et al. [23]. It was also found that high levels of CA199 and CEA were closely associated with lymph node metastasis. Consistent with previous studies [27, 28], we found no correlation between CEA and CA199 levels and tumor differentiation. Interestingly, CA199 was also negatively correlated with body mass index, which may be attributed to the more severe the condition of cancer patients, the more pronounced the cachexia of the body.
The AUC of the ROC curves indicated that MHR has the highest diagnostic efficacy for CRC compared with CEA and CA199. However, combination of MHR with CEA and CA199 showed better diagnostic efficacy and was closely associated with the clinical features of CRC.
Several limitations of this study include the retrospective nature of the study, small sample size, and the same region of origin of the patients, which may introduce selection bias in the data. Therefore, a large-cohort multicenter study will be warranted to further confirm these findings.
Conclusion
In summary, this is the first study to show that a continuous increase of MHR is an independent risk factor for CRC. MHR is a promising new indicator, and its combination with CEA and CA199 has great predictive value for CRC progression.
Acknowledgements
We would like to thank Department of Nuclear medicine, The First Affiliated Hospital of Guangxi Medical University, China.
Ethical disclosure
The authors have no conflicts of interests to disclose.
Abbreviations
- ALT
Alanine aminotransferase
- AST
Aspartate aminotransferase
- CA125
Carbohydrate antigen 125
- CA153
Carbohydrate antigen 153
- CA199
Carbohydrate antigen 199
- CEA
Carcinoembryonic antigen
- CRC
Colorectal cancer
- HDL-C
High-density lipoprotein cholesterol
- LDL-C
Low-density lipoprotein cholesterol
- MHR
Monocytes to high-density lipoprotein cholesterol ratio
Authors’ contributions
1. Concept or design: ZX and WZX. 2. Acquisition of data: ZX, QHY, TXD. 3. Analysis or interpretation of data: QHY, MYC, LZY, HGF. 4. Draft, revise and approve the manuscript: All authors. All authors read and approved the final manuscript.
Funding
Not applicable.
Availability of data and materials
The data generated in the present study are included in the figures and/or tables of this article.
Declarations
Ethics approval and consent to participate
The Ethics Committee of The First Affiliated Hospital of Guangxi Medical University approved the study (Approval Number: 2022-E366-01). All the participants were orally informed and agreed to participate.
Consent for publication
The manuscript did not contain the patient's identity information (including individual details, images or videos), and all participants agreed to publish.
Competing interests
The authors declare no competing interests.
Footnotes
Publisher’s Note
Springer Nature remains neutral with regard to jurisdictional claims in published maps and institutional affiliations.
Xuan Zhang and Hongyan Qin contributed equally to this work.
References
- 1.Siegel RL, Miller KD, Goding Sauer A, et al. Colorectal cancer statistics, 2020. CA Cancer J Clin. 2020;70(3):145–164. doi: 10.3322/caac.21601. [DOI] [PubMed] [Google Scholar]
- 2.Siegel RL, Miller KD, Jemal A. Cancer statistics, 2020. CA Cancer J Clin. 2020;70(1):7–30. doi: 10.3322/caac.21590. [DOI] [PubMed] [Google Scholar]
- 3.Cao M, Li H, Sun D, et al. Cancer burden of major cancers in China: A need for sustainable actions. Cancer Commun (Lond) 2020;40(5):205–210. doi: 10.1002/cac2.12025. [DOI] [PMC free article] [PubMed] [Google Scholar]
- 4.Haggar FA, Boushey RP. Colorectal cancer epidemiology: incidence, mortality, survival, and risk factors. Clin Colon Rectal Surg. 2009;22(4):191–197. doi: 10.1055/s-0029-1242458. [DOI] [PMC free article] [PubMed] [Google Scholar]
- 5.Luo H, Shen K, Li B, et al. Clinical significance and diagnostic value of serum NSE, CEA, CA19-9, CA125 and CA242 levels in colorectal cancer. Oncol Lett. 2020;20(1):742–750. doi: 10.3892/ol.2020.11633. [DOI] [PMC free article] [PubMed] [Google Scholar]
- 6.Yamano T, Yamauchi S, Igeta M, et al. Combination of preoperative tumour markers and lymphovascular invasion with TNM staging as a cost and labour efficient subtyping of colorectal cancer. Sci Rep. 2020;10(1):10238. doi: 10.1038/s41598-020-66652-z. [DOI] [PMC free article] [PubMed] [Google Scholar]
- 7.Tang X, Tan Y, Yang Y, et al. Association of the Monocyte-to-High-Density Lipoprotein Cholesterol Ratio With Diabetic Retinopathy. Front Cardiovasc Med. 2021;8:707008. doi: 10.3389/fcvm.2021.707008. [DOI] [PMC free article] [PubMed] [Google Scholar]
- 8.Huang H, Wang Q, Shi X, et al. Association between Monocyte to High-Density Lipoprotein Cholesterol Ratio and Nonalcoholic Fatty Liver Disease: A Cross-Sectional Study. Mediators Inflamm. 2021;2021:6642246. doi: 10.1155/2021/6642246. [DOI] [PMC free article] [PubMed] [Google Scholar]
- 9.Zhou Y, Wang L, Jia L, et al. The Monocyte to High-Density Lipoprotein Cholesterol Ratio in the Prediction for Atherosclerosis: A Retrospective Study in Adult Chinese Participants. Lipids. 2021;56(1):69–80. doi: 10.1002/lipd.12276. [DOI] [PubMed] [Google Scholar]
- 10.Singh N, Baby D, Rajguru JP, et al. Inflammation and cancer. Ann Afr Med. 2019;18(3):121–126. doi: 10.4103/aam.aam_56_18. [DOI] [PMC free article] [PubMed] [Google Scholar]
- 11.Xu H, Pang Y, Li X, et al. Monocyte to high-density lipoprotein cholesterol ratio as an independent risk factor for papillary thyroid carcinoma. J Clin Lab Anal. 2021;35(11):e24014. doi: 10.1002/jcla.24014. [DOI] [PMC free article] [PubMed] [Google Scholar]
- 12.Zhang DP, Baituola G, Wu TT, et al. An elevated monocyte-to-high-density lipoprotein-cholesterol ratio is associated with mortality in patients with coronary artery disease who have undergone PCI. Biosci Rep. 2020;40(8):BSR20201108. [DOI] [PMC free article] [PubMed]
- 13.Vahit D, Akboga MK, Samet Y, et al. Assessment of monocyte to high density lipoprotein cholesterol ratio and lymphocyte-to-monocyte ratio in patients with metabolic syndrome. Biomark Med. 2017;11(7):535–540. doi: 10.2217/bmm-2016-0380. [DOI] [PubMed] [Google Scholar]
- 14.Usta A, Avci E, Bulbul CB, et al. The monocyte counts to HDL cholesterol ratio in obese and lean patients with polycystic ovary syndrome. Reprod Biol Endocrinol. 2018;16(1):34. doi: 10.1186/s12958-018-0351-0. [DOI] [PMC free article] [PubMed] [Google Scholar]
- 15.Jia C, Anderson JLC, Gruppen EG, et al. High-Density Lipoprotein Anti-Inflammatory Capacity and Incident Cardiovascular Events. Circulation. 2021;143(20):1935–1945. doi: 10.1161/CIRCULATIONAHA.120.050808. [DOI] [PubMed] [Google Scholar]
- 16.Nazir S, Jankowski V, Bender G, et al. Interaction between high-density lipoproteins and inflammation: Function matters more than concentration! Adv Drug Deliv Rev. 2020;159:94–119. doi: 10.1016/j.addr.2020.10.006. [DOI] [PubMed] [Google Scholar]
- 17.Ossoli A, Remaley AT, Vaisman B, et al. Plasma-derived and synthetic high-density lipoprotein inhibit tissue factor in endothelial cells and monocytes. Biochem J. 2016;473(2):211–219. doi: 10.1042/BJ20151000. [DOI] [PubMed] [Google Scholar]
- 18.Açıkgöz SK, Açıkgöz E, Şensoy B, et al. Monocyte to high-density lipoprotein cholesterol ratio is predictive of in-hospital and five-year mortality in ST-segment elevation myocardial infarction. Cardiol J. 2016;23(5):505–512. doi: 10.5603/CJ.a2016.0026. [DOI] [PubMed] [Google Scholar]
- 19.Ganjali S, Ricciuti B, Pirro M, et al. High-Density Lipoprotein Components and Functionality in Cancer: State-of-the-Art. Trends Endocrinol Metab. 2019;30(1):12–24. doi: 10.1016/j.tem.2018.10.004. [DOI] [PubMed] [Google Scholar]
- 20.Säemann MD, Poglitsch M, Kopecky C, et al. The versatility of HDL: a crucial anti-inflammatory regulator. Eur J Clin Invest. 2010;40(12):1131–1143. doi: 10.1111/j.1365-2362.2010.02361.x. [DOI] [PubMed] [Google Scholar]
- 21.Tokunaga R, Sakamoto Y, Nakagawa S, et al. The utility of tumor marker combination, including serum P53 antibody, in colorectal cancer treatment. Surg Today. 2017;47(5):636–642. doi: 10.1007/s00595-016-1464-8. [DOI] [PubMed] [Google Scholar]
- 22.Kazama S, Watanabe T. Diagnosis of colorectal cancer by measurement of tumor markers. Nihon Rinsho. 2014;72(1):71–76. [PubMed] [Google Scholar]
- 23.Björkman K, Mustonen H, Kaprio T, et al. CA125: A superior prognostic biomarker for colorectal cancer compared to CEA, CA19-9 or CA242. Tumour Biol. 2021;43(1):57–70. doi: 10.3233/TUB-200069. [DOI] [PubMed] [Google Scholar]
- 24.Lakemeyer L, Sander S, Wittau M, et al. Diagnostic and prognostic value of CEA and CA19-9 in colorectal cancer. Diseases. 2021;9(1):21. [DOI] [PMC free article] [PubMed]
- 25.Luo S, Ou Y, Zheng T, et al. Optimal Strategy for Colorectal Cancer Patients' Diagnosis Based on Circulating Tumor Cells and Circulating Tumor Endothelial Cells by Subtraction Enrichment and Immunostaining-Fluorescence In Situ Hybridization Combining with CEA and CA19-9. J Oncol. 2021;2021:1517488. doi: 10.1155/2021/1517488. [DOI] [PMC free article] [PubMed] [Google Scholar]
- 26.Dawson H, Kirsch R, Messenger D, et al. A Review of Current Challenges in Colorectal Cancer Reporting. Arch Pathol Lab Med. 2019;143(7):869–882. doi: 10.5858/arpa.2017-0475-RA. [DOI] [PubMed] [Google Scholar]
- 27.Wang J, Wang X, Yu F, et al. Combined detection of preoperative serum CEA, CA19-9 and CA242 improve prognostic prediction of surgically treated colorectal cancer patients. Int J Clin Exp Pathol. 2015;8(11):14853–14863. [PMC free article] [PubMed] [Google Scholar]
- 28.Ning S, Wei W, Li J, et al. Clinical significance and diagnostic capacity of serum TK1, CEA, CA 19–9 and CA 72–4 levels in gastric and colorectal cancer patients. J Cancer. 2018;9(3):494–501. doi: 10.7150/jca.21562. [DOI] [PMC free article] [PubMed] [Google Scholar]
Associated Data
This section collects any data citations, data availability statements, or supplementary materials included in this article.
Data Availability Statement
The data generated in the present study are included in the figures and/or tables of this article.