


Abstract
We have made a systematic study of how the activity of an Escherichia coli promoter is affected by the base sequence immediately upstream of the –10 hexamer. Starting with an activator-independent promoter, with a 17 bp spacing between the –10 and –35 hexamer elements, we constructed derivatives with all possible combinations of bases at positions –15 and –14. Promoter activity is greatest when the ‘non-template’ strand carries T and G at positions –15 and –14, respectively. Promoter activity can be further enhanced by a second T and G at positions –17 and –16, respectively, immediately upstream of the first ‘TG motif’. Our results show that the base sequence of the DNA segment upstream of the –10 hexamer can make a significant contribution to promoter strength. Using published collections of characterised E.coli promoters, we have studied the frequency of occurrence of ‘TG motifs’ upstream of the promoters’ –10 elements. We conclude that correctly placed ‘TG motifs’ are found at over 20% of E.coli promoters.
INTRODUCTION
It is well known that Escherichia coli RNA polymerase holoenzyme (RNAP) containing the σ70 subunit is able to recognise promoters and to initiate transcription (reviewed in 1–3). The specificity of these processes is primarily dependent on two hexamer DNA elements, found around 10 and 35 bp upstream of the transcription start point (4). These elements, known as the –10 and –35 elements, are directly recognised by Region 2.4 and Region 4.2 of the RNAP σ subunit (reviewed in 5,6). Additionally, an ∼20 bp element, found upstream of the –35 element in many promoters, is recognised by the C-terminal domain of the RNAP α subunit, thus providing a third important element that contributes to promoter recognition (7).
A further critical determinant of promoter activity is the spacer region between the –10 and –35 elements. The results of many different studies have indicated that the primary roles of this spacer are to ensure the appropriate spacing between the –10 and –35 elements and to provide a degree of conformational flexibility. This flexibility is needed so that RNAP can ‘serve’ promoter DNA with differing topologies and also to ensure that RNAP:promoter contacts are maintained as the topology of promoter DNA alters throughout the transcription initiation process (see for example 8–12). Early studies supposed that E.coli RNAP makes no direct sequence-specific interactions with promoter DNA between the –10 and –35 hexamer elements. However, there is now a body of experimental evidence to argue that base pairs just upstream of the –10 hexamer provide a supplementary element that is recognised by RNAP (reviewed in 13). At a small number of E.coli promoters, substitutions in the bases located 2 and 3 bp upstream of the –10 hexamer cause severe defects in transcription initiation (see for example 14). It was noted that these promoters carried the sequence TGN on the ‘non-template’ strand immediately upstream of the –10 hexamer and it was suggested that the TG motif might provide a supplementary contact site for RNAP (15–17). Subsequent genetic studies indicated that the segment of the RNAP σ70 subunit immediately adjacent to Region 2.4 (known as Region 2.5) plays a direct role in recognition of the TG motif (18), and this was corroborated by biochemical studies (19).
In the work described here, we have investigated the effects of base changes immediately upstream of the –10 hexamer in an E.coli promoter. Previous results (reviewed in 13) had shown that promoter activity could be reduced by mutations that changed this upstream sequence away from TGN or increased by mutations that changed the sequence to TGN, but no systematic study has been made. Thus, in this work, starting with a promoter known to depend on the TG motif, we created derivatives carrying all 15 alternatives to the TG motif and derivatives carrying the TG motif at different locations. Our studies show that, as expected, optimal promoter activity results when the promoter –10 sequence is preceded by TGN. In complementary experiments, we made a systematic study of the two base pairs immediately upstream of the TG motif. Our results show that promoter activity can be further enhanced by a second TG, located just upstream of the first TG. Finally, we performed a statistical analysis of the base sequence immediately upstream of the –10 element of known E.coli promoters.
MATERIALS AND METHODS
The E.coli Δlac host strain DH5α was used throughout this work (20). Different promoters were cloned on fragments flanked with EcoRI and HindIII sites, which were located, respectively, upstream and downstream of the transcript start point. For propagation, purification or further manipulation, these fragments were inserted into the unique EcoRI and HindIII sites of plasmid pAA121, a simple cloning vector derived from pBR322 (21). For measuring promoter activities, the different EcoRI–HindIII fragments carrying promoters were cloned into the low copy number lac expression vector pRW50, to give promoter::lac operon fusions (22). DH5α cells carrying the different pRW50 derivatives were grown aerobically in L-broth supplemented with 35 µg/ml tetracycline and β-galactosidase activities were measured by the Miller method (23).
The promoters used in this study are illustrated in Figure 1. By convention, promoter sequences are numbered with the transcript start as +1, with upstream and downstream sequences denoted by – and + prefixes, respectively. All the promoters are derivatives of the KAB-TG promoter, a factor-independent derivative of the galP1 promoter carrying a unique SphI site between the –35 and –10 hexamer elements (24). The –10 hexamer of KAB-TG, TATGGT from positions –12 to –7, is preceded by a TG motif at positions –15 and –14. Because, in this work, we have focused on alterations from positions –17 to –14, we renamed this promoter KAB-TTTG and derivatives are referred to as KAB-WXYZ, where W, X, Y and Z are the bases on the non-template strand at positions –17, –16, –15 and –14. To make the KAB-TTYZ series of promoters, SphI–HindIII fragments were generated by PCR using pAA121 containing the KAB-TTTG promoter as template. The primers were D4600 (5′-GTAGTCGGTGTGTTCAC-3′) and D16031 (5′-GCTGCATGCATCTTYZTTATGGTTATTTCATACC-3′). D4600 hybridises to vector sequence just downstream of the HindIII site and D16031 overlaps the SphI site of KAB-TTTG and carries random bases at the positions denoted Y and Z. The PCR product was cleaved with SphI and HindIII and the resulting fragment was cloned between the SphI and HindIII sites of the KAB-TTTG promoter cloned in pAA121. Recombinants were screened by sequencing, using primer D5431 (5′-ACCTGACGTCTAAGAAACC-3′) that hybridises just upstream of the EcoRI site of pAA121. By sequencing 100 candidates, we identified fragments encoding all 16 KAB-TTYZ derivatives. The KAB-WXTG series of promoters was made by a similar protocol, using PCR with pAA121 containing the KAB-TTTG promoter as the template and primers D4600 and D18076 (5′-GCT-GCATGCATCWXTGTTATGGTTATTTCATACC-3′). The –35 hexamer of each of the KAB-WXTG derivatives was altered from TAGACA to TAGATA to give the KAC-WXTG series of promoters. To do this, the short EcoRI–SphI fragment from each KAB-WXTG derivative was replaced with a similar fragment carrying the altered –35 element (as described in fig. 4 of 24). The KAB-TGTT promoter was made by PCR using defined primers. The complete base sequence of all the promoters constructed in this work was checked using either the D4600 or D5431 primers.
Figure 1.

Base sequence of promoters used in this study. The promoters are named by the KAB-WXYZ nomenclature, explained in the text, and the base sequence of the non-coding strand is shown. Sequences are numbered with the transcript start site as +1 and the –35 and –10 hexamers are written in bold. The promoters are grouped according to the experiments described in the text. The first block of sequences shows the KAB-TTYZ set of promoters with the variable bases at positions –15 and –14 highlighted. The second block of sequences shows derivatives of KAB-TTTG where the location of the TG motif (highlighted) was varied. The third block of sequences shows the KAB-XYTG set of promoters with the variable bases at positions –17 and –16 highlighted. The fourth block of sequences shows the related KAC-XYTG set of promoters with the –35 hexamer altered to TAGATA.
For in vitro transcription initiation assays, EcoRI–HindIII fragments carrying the different promoters were cloned into the plasmid pSR (25). Each promoter was thus placed upstream of the bacteriophage λ oop terminator so that transcripts made by purified RNAP resulted in discrete sized RNA molecules that were easily detected and quantified by gel electrophoresis. Transcription assays were performed using the protocols described by Savery et al. (26). Purified RNAP was made by adding a 5-fold excess of σ70, purified as in Bown et al. (19), to core RNAP obtained from Epicentre Technology (Cambridge, UK). Incubations were performed in 12.5 µl containing 6.4 nM DNA template and 20 nM RNAP. Abortive initiation assays were performed and used to determine the kinetic constants for open complex formation as described by Busby et al. (27). Assays used CpA and [α-32P]UTP and the formation of labelled CpApU was monitored. Band shift assays to quantify complex formation between RNAP and different promoters were performed as described by Kolb et al. (28).
RESULTS AND DISCUSSION
Systematic alteration of bases at positions –15 and –14 of the KAB-TG promoter
The starting point of this work was the semi-synthetic activator-independent KAB-TG promoter, which had previously been constructed by genetic manipulation of the E.coli galP1 promoter, that replaced the base sequences upstream of the –10 hexamer and inserted a near consensus –35 hexamer (TAGACA on the non-coding strand) (24). In KAB-TG, the –10 hexamer (TATGGT on the non-coding strand) from positions –12 to –7 is preceded by a TG motif at positions –15 and –14. In previous work, we showed that the activity of the KAB-TG promoter was greatly decreased by altering the TG motif to TT or TC (18,24). In order to make a systematic study of the effects of different bases at positions –15 and –14, we constructed derivatives of KAB-TG carrying every combination of bases at these positions (Fig. 1). To aid comprehension here, we refer to these derivatives as KAB-WXYZ, where W, X, Y and Z are the bases on the non-template strand at positions –17, –16, –15 and –14, respectively (we include positions –17 and –16, as our work extends to these bases: see below). Thus the starting promoter, KAB-TG, was renamed KAB-TTTG and the 16 derivatives, with every combination of bases at positions –15 and –14, are referred to as the KAB-TTYZ promoters. To measure the activity of these promoters in vivo, each promoter was cloned into the low copy number, broad host range lac expression vector pRW50 and β-galactosidase levels were measured in E.coli DH5α cells carrying the different recombinant plasmids. The results in Figure 2 show that, as expected, promoter activity is critically dependent on the bases at positions –15 and –14. Activity is clearly highest with a TG motif at positions –15 and –14 and the next most active promoter is ∼5-fold less active. Substitution of the T at –15 has a lesser effect than substitution of the G at –14. The hierarchy of promoter activities as the base at –14 is altered is independent of the base at –15: whatever the base at –15, the greatest promoter activity is found with G at –14. However, the hierarchy of promoter activities as the base at –15 is altered is dependent on the base at –14. When the base at –14 is G, the greatest promoter activity is found with T at –15. When the base at –14 is not G, although the promoter activities are low, the greatest activity is found with G at –15.
Figure 2.

Activity in vivo of the KAB-TTYZ set of promoters. Each of the 16 KAB-TTYZ promoters was cloned into the lac expression vector pRW50. The activity of each promoter was deduced from measured β-galactosidase activities and is shown in the bar chart relative to the activity of the starting KAB-TTTG promoter (together with one standard deviation). Data shown are the average of at least three independent measurements.
In vitro analysis of RNAP:promoter interactions
In order to investigate whether the hierarchy of promoter activities shown in Figure 2 is a direct consequence of interactions with RNAP, we performed several in vitro experiments to monitor the binding of purified RNAP to the different KAB-TTYZ promoters. First, we measured the ability of RNAP to initiate transcript formation at the different promoters. To do this, the 16 KAB-TTYZ promoters were cloned into the vector pSR such that each promoter was located upstream of the bacteriophage λ oop terminator. Each plasmid was purified and incubated together with RNAP and a mixture of nucleoside triphosphates containing labelled UTP. Transcripts initiating at each promoter run to the oop terminator, thus creating a discrete-sized piece of labelled RNA that is easily detectable by gel electrophoresis. A typical autoradiograph is shown in Figure 3A: each incubation also results in the formation of RNA I transcripts (from the plasmid vector) that can be used as a convenient internal control. By normalising the ratio of the quantity of transcript starting at each test promoter to the quantity of RNA I, it was possible to make a simple estimate of the in vitro activity of each promoter. The results, illustrated in Figure 3B, show that, as in vivo, activity is clearly highest with a TG motif at positions –15 and –14. Also, the hierarchy of apparent strengths is very similar to that found in vivo (compare Figs 2 and 3B; the only exception is the KAB-TTGT promoter, whose relative activity in vitro is a little greater than in vivo). In a second set of in vitro experiments, we used band shift assays to measure the binding of RNAP to each of the 16 KAB-TTYZ promoters in the absence of RNA product formation. Figure 4A shows a typical result and Figure 4B shows a summary of the data. Although our results clearly show that binding of RNAP is optimal with the promoter carrying a TG motif at positions –15 and –14, the inherent inaccuracies of the method preclude the establishment of reliable hierarchies for the other promoters. Additionally, since any individual DNA molecule is either occupied by RNAP or not occupied, this method tends to exaggerate RNAP binding to the weaker promoters. However, notwithstanding these limitations, this experiment argues that the differences in transcription initiation at the 16 KAB-TTYZ promoters both in vivo and in vitro are, in large part, due to simple differences in RNAP binding: optimal binding requires a TG motif at positions –15 and –14.
Figure 3.
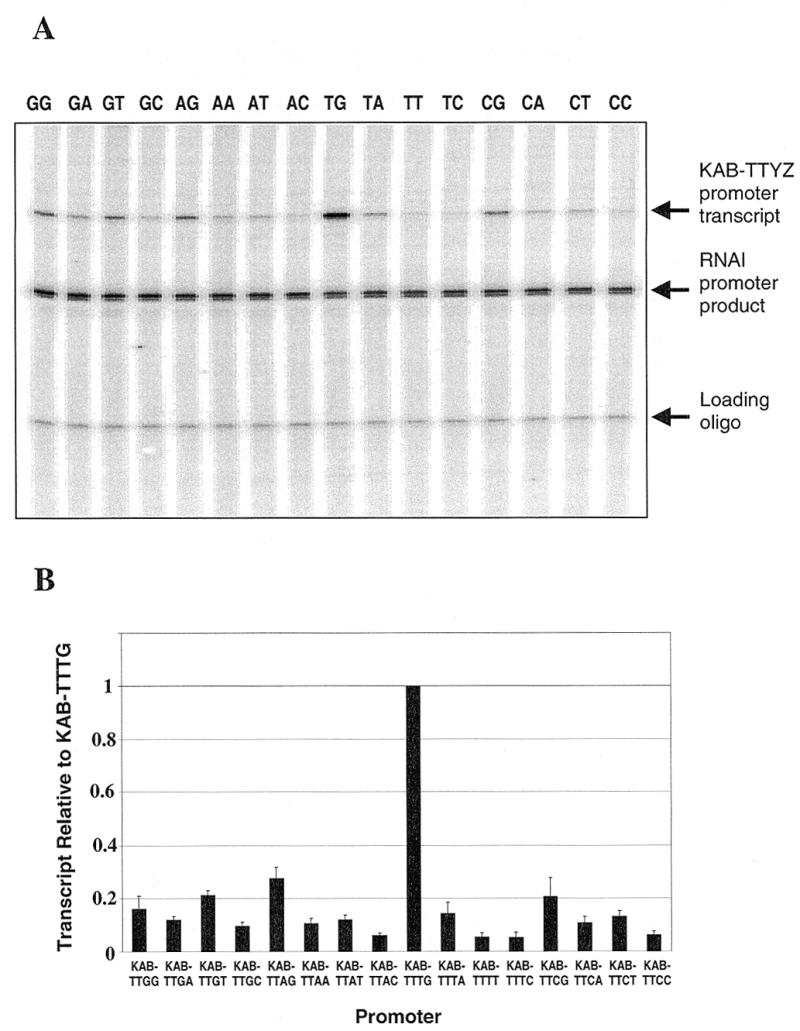
Transcription initiation in vitro at the KAB-TTYZ set of promoters. Each of the 16 KAB-TTYZ promoters was cloned into vector pSR and the recombinant was purified. (A) Gel analysis of transcripts formed when purified RNAP was incubated with each recombinant together with nucleoside triphosphates. Transcription initiation at each of the KAB-TTYZ promoters (the identity of YZ is shown above each lane) gives rise to the discrete transcripts shown. (B) The relative amount of each transcript initiating at the KAB-TTYZ promoter, which was quantified after normalisation to the invariant RNA I transcript made from the pSR vector. An internally labelled calibration oligo was also added to each reaction to control for variation in product recovery. Data shown are the average of three independent experiments.
Figure 4.
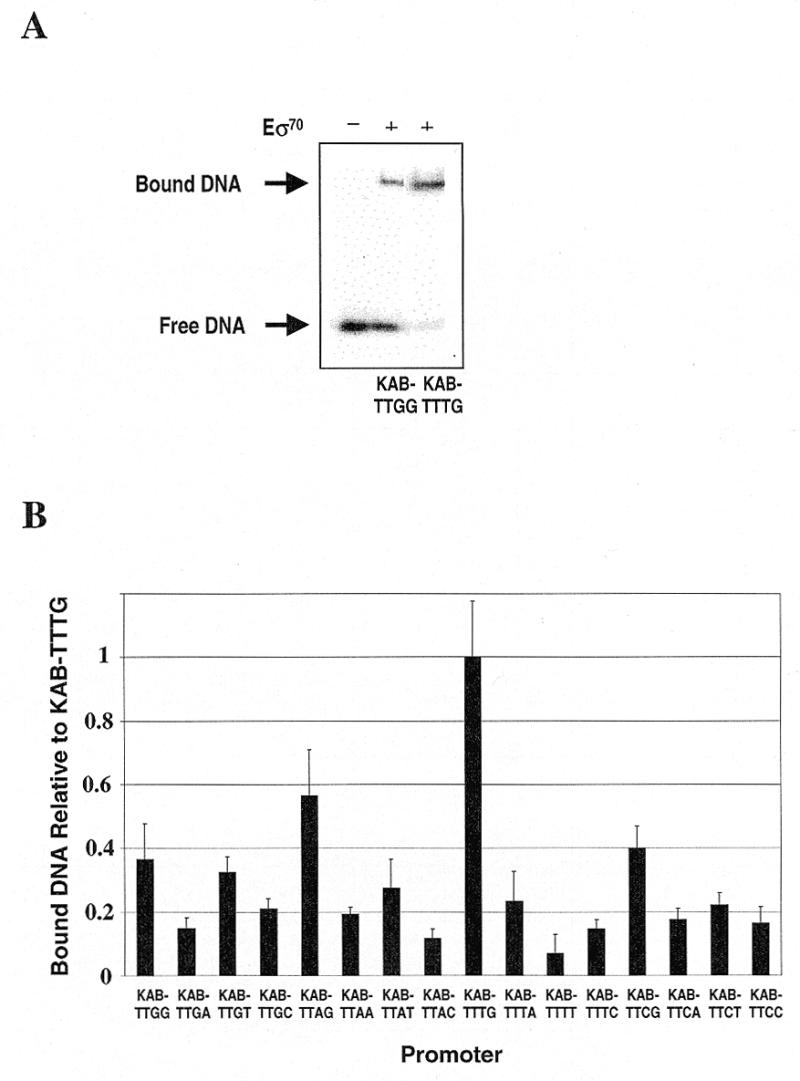
Band shift analysis of RNAP binding to the KAB-TTYZ set of promoters. Fragments carrying each of the 16 KAB-TTYZ promoters were purified, labelled and used in band shift assays with purified RNAP. (A) A typical result, comparing the binding of RNAP to the KAB-TTGG and KAB-TTTG promoters. The locations of the free and bound DNA fragments are indicated. (B) The relative amount of retardation of each fragment relative to retardation of the fragment carrying the KAB-TTTG promoter. Data shown are the average of three independent experiments.
In order to quantify precisely the contribution of the TG motif to transcription initiation at the KAB-TTTG promoter, we used abortive initiation assays. By measuring the time course of synthesis of abortive products at a promoter with different RNAP concentrations, it is possible to determine both the affinity of RNAP binding to the closed complex (KB) and the rate constant for interconversion from the closed to open complex (kf) (see 27 for a review and 14 for an example). Thus, we performed several series of measurements on the KAB-TTTG and KAB-TTGA promoters, measuring the rate of synthesis of the abortive product, CpApU. Figure 5 shows τ plots of the measured lag time of CpApU production as a function of the reciprocal of the RNAP concentrations at the two promoters. From the plots it is clear that the principal defect in the KAB-TTGA promoter (compared to the KAB-TTTG promoter) is at the level of interconversion from the closed to open complex. Thus, for KAB-TTTG the value of kf is 0.49 min–1, whilst for KAB-TTGA the value of kf is 0.034 min–1: removal of the TG motif reduces kf by over 10-fold. For KAB-TTTG the value of KB is 0.015 nM–1 but, in contrast to the situation with kf, the value of KB with the KAB-TTGA promoter is not significantly different.
Figure 5.

τ plot analysis of abortive initiation. The figure shows plots of the measured lag time for the production of CpApU as a function of the reciprocal of the RNAP concentration at the KAB-TTGA and KAB-TTTG promoters. Values of kf are calculated from the intercept with the y-axis.
Relocation of the TG motif in the KAB-TTTG promoter
The above results show that the TG motif at positions –15 and –14 of the KAB-TTTG promoter makes an important contribution to promoter strength. To investigate the dependence of this contribution on the location of the TG motif, we compared the activities of derivatives of KAB-TTTG carrying the TG motif at positions –16 and –15 (KAB-TTGT) and at –17 and –16 (KAB-TGTT) (Fig. 1). The control promoter, KAB-TTTT, carrying no TG motif upstream of the –10 hexamer, was also included in this study. EcoRI–HindIII fragments carrying these promoters were cloned in pRW50 and promoter strength in vivo was measured by determination of β-galactosidase activities in DH5α cells carrying the different recombinant plasmids. The results in Figure 6 show that promoter activity is greatly reduced by moving the TG motif to positions –16 and –15 or positions –17 and –16. However, the promoter with the TG motif at positions –17 and –16 is very slightly more active than the promoter with the TG motif at positions –16 and –15. To investigate this further, we constructed a KAB-TGTG promoter carrying tandem TG motifs at positions –17 and –16 and positions –15 and –14 (Fig. 1). The results in Figure 6 show that the activity of KAB-TTTG is clearly increased by the introduction of a second TG motif at positions –17 and –16. In order to be certain that the differences in promoter activity observed in Figure 6 were significant, we checked the transcription start point in each case using primer extension (as in 29). These experiments showed that, in each case, transcripts initiated at +1 and that base alterations upstream of the promoter –10 hexamers did not alter the transcript start or create new starts (J.Mitchell, unpublished data).
Figure 6.

Activity in vivo of derivatives of the KAB-TTTG set of promoters. Each promoter was cloned into the lac expression vector pRW50. The activity of each promoter was deduced from measured β-galactosidase activities and is shown in the bar chart relative to the activity of the starting KAB-TTTG promoter. Data shown are the average of at least three independent measurements.
Systematic alteration of bases at positions –17 and –16
To make a systematic study of the effects of different bases at positions –17 and –16, we constructed the 16 KAB-XYTG promoters carrying every combination of bases at positions –17 and –16 (Fig. 1). Each promoter was cloned into pRW50 and β-galactosidase levels were measured in DH5α cells carrying the different recombinant plasmids. The results in Figure 7A confirm that the bases at positions –17 and –16 significantly affect promoter activity. Activity is optimal with a pyrimidine on the non-coding strand at position –17 and a purine at position –16. Thus, the most active promoters are KAB-TGTG, KAB-CGTG, KAB-TATG and KAB-CATG and the least active promoters are KAB-GTTG, KAB-ATTG, KAB-GCTG and KAB-ACTG.
Figure 7.

Activity in vivo of the KAB-WXTG and KAC-WXTG sets of promoters. Each of the 16 KAB-WXTG promoters (A) and KAC-WXTG promoters (B) was cloned into the lac expression vector pRW50. The activity of each promoter was deduced from measured β-galactosidase activities and is shown in the bar charts, relative to the activity of the starting KAB-TTTG promoter (A) or KAC-TTTG promoter (B). Data shown are the average of at least three independent measurements.
From our results it is clear that the dependence of promoter activity on the bases at positions –17 and –16 is less than the dependence of promoter activity on the bases at –15 and –14 (compare Fig. 7A with Fig. 2). We reasoned, however, that the bases at positions –17 and –16 might play a relatively more important role at a promoter that was weaker. Thus, the –35 hexamer of each of the 16 KAB-XYTG promoters was altered from TAGACA to TAGATA, to give the KAC-XYTG set of promoters (Fig. 1). Note that, in previous work (24), we had shown that this single base change in the –35 hexamer greatly reduced the activity of the KAB-TTTG promoter. Figure 7B shows the activity of the different KAC-XYTG promoters, as judged by β-galactosidase expression in DH5α cells, after cloning into pRW50. The data show that with the altered –35 hexamer a greater range of promoter activities is observed as the bases at positions –17 and –16 are altered. However, the hierarchy of promoter activities is similar to that found with the KAB-XYTG set of promoters and activity is optimal with a pyrimidine at position –17 and a purine at position –16: thus, the most active promoters are KAC-TGTG, KAC-CGTG, KAC-TATG and KAC-CATG.
Statistical analysis of base sequences upstream of the –10 hexamer in E.coli promoters
Over the past 20 years many authors have performed statistical analyses of different E.coli promoter sequences (4,30–33). Most of these studies have aligned promoter sequences using the transcript start or the –10 hexamer element and have calculated the frequency of appearance of the four bases at different individual positions. These studies have shown that bases are well conserved at each position of the –10 and –35 hexamer elements, but that conservation of the bases in the DNA segment upstream of the –10 element is not strong. Our present experimental results prompted us to investigate the frequency of different dinucleotides in this region. Therefore, we re-examined the promoters collected by Lisser and Margalit (32) and Ozoline et al. (33) and selected those promoters from the E.coli genome where there was clear experimental evidence for either the transcript start or the identity of the –10 hexamer. We thus derived a collection of 300 promoter sequences that we aligned by their –10 hexamers, arbitrarily assigning the upstream T of the –10 hexamer as position –12 (this collection is available from J.Mitchell on request). We then calculated the frequency of appearance of the 16 possible dinucleotides on the non-coding strand at positions –15 and –14, positions –16 and –15 and positions –17 and –16. Figure 8A shows that just over 20% of the promoters in our collection carry the TG motif at positions –15 and –14. Note that if the sequence of this dinucleotide were random, each dinucleotide would appear in 6.25% of the promoter sequences. Thus, there is a strong preference for TG at positions –15 and –14 that was not apparent from previous analyses that focused on base preferences at single positions. Figure 8B shows a similar analysis for positions –16 and –15: the results show that there is no strong preference for any dinucleotide pair at these positions. Finally, Figure 8C shows the analysis for positions –17 and –16. The results show that the most common dinucleotide at these positions is TG, which is present in nearly 12% of the collected promoters. Thus, the preference for TG at positions –17 and –16 is not as marked as the preference for TG at positions –15 and –14.
Figure 8.

Frequency of dinucleotides at different positions of E.coli promoters. Base sequences of 300 E.coli promoters were aligned by their –10 hexamers, arbitrarily assigning the upstream T of the –10 hexamer as position –12 (see text). The figure shows the frequency of appearance of the 16 possible dinucleotides on the non-coding strand at positions –15 and –14 (A), positions –16 and –15 (B) and positions –17 and –16 (C). In each panel the bars represent frequencies derived from all 300 promoters and the heights of all the bars in each panel add up to 100%. The promoters used in this analysis and further details can be found attached to Steve Minchin’s web page publication list at http://www.biosciences.bham.ac.uk/labs/minchin/promoters.html
Conclusions
The relationship between the base sequence and the activity of E.coli promoters has been studied intensively (reviewed in 1–3). Although attention has focused largely on the –35 and –10 hexamers, mutational analysis at a number of promoters has shown that a TG motif located 1 bp upstream of the –10 hexamer can also make a substantial contribution to promoter strength (reviewed in 13). There is some evidence that the TG motif can be directly recognised by a segment of the RNAP σ70 subunit immediately adjacent to Region 2.4 (Region 2.5; 18,19). In this work, we started with a well-characterised activator-independent promoter whose activity was dependent on such a TG motif and made a systematic mutational analysis. Our results show that optimal promoter activity is obtained with a TG motif at positions –15 and –14 and reveal the hierarchy of activities when the motif is replaced by other dinucleotides. Interestingly, we were able to reproduce the in vivo hierarchy of promoter activities in in vitro assays containing only purified RNAP and promoter DNA. Kinetic analysis showed that the principal contribution of the TG motif is to facilitate interconversion of the closed to open complex, in agreement with findings using less sophisticated methods of analysis (34,35).
The stimulatory effect of the TG motif is critically dependent on its location at positions –15 and –14. However, interestingly, we were able to show that promoter strength, at least in vivo, can be improved when a second TG motif is placed at positions –17 and –16. Two arguments strongly suggest that the mechanism by which the TG motif at positions –17 and –16 promotes transcription initiation is different to the mechanism by which the TG motif at positions –15 and –14 promotes transcription. First, the TG motifs at both positions –17 and –16 and positions –15 and –14 can function additively. Second, the hierarchy of activities as the TG motifs at either set of positions are altered differs markedly.
Studies with Bacillus subtilis promoters (and other Gram-positive organisms) have shown that the sequence TGTGN immediately upstream of the –10 hexamer plays an important role (see for example 36,37) and statistical analysis has shown clear base preferences in this region of B.subtilis promoters (38). However, it has been suggested that whilst the TG motif may be very common in promoters of Gram-positive organisms, it is relatively rare in E.coli promoters (13). Our analysis here suggests that, in fact, the TG motif is present at positions –15 and –14 in one in five E.coli promoters and at positions –17 and –16 in one in nine promoters. These preferences had been hidden by previous base-by-base analyses of E.coli promoter sequences. Thus, we argue that the 4–5 bp immediately upstream of the –10 hexamer at E.coli promoters provide a discrete element that makes a substantial contribution to promoter strength. Future studies now must focus on measuring the precise contribution of this element to promoter activity, determining its role at the different steps of transcription initiation and discovering the details of its interactions with RNAP.
Acknowledgments
ACKNOWLEDGEMENTS
We are very grateful to Jon Bown for supplying purified σ70 protein and to Hanah Margalit for providing us with her collection of E.coli promoter sequences. This work was generously funded by project grant 049613 from the Wellcome Trust.
REFERENCES
- 1.McClure W.R. (1985) Annu. Rev. Biochem., 54, 171–204. [DOI] [PubMed] [Google Scholar]
- 2.Record M.T., Reznikoff,W.S., Craig,M.L., McQuade,K.L. and Schlax,P.J. (1996) In Neidhardt,F.C. (ed.), Escherichia coli and Salmonella: Cellular and Molecular Biology. ASM Press, Washington, DC, pp. 792–820.
- 3.Helmann J.D. and deHaseth,P.L. (1999) Biochemistry, 38, 5959–5967. [DOI] [PubMed] [Google Scholar]
- 4.Hawley D.K. and McClure,W.R. (1983) Nucleic Acids Res., 11, 2237–2255. [DOI] [PMC free article] [PubMed] [Google Scholar]
- 5.Gross C.A., Lonetto,M. and Losick,R. (1992) In McKnight,S.L. and Yamamoto,K.R. (eds), Transcriptional Regulation. Cold Spring Harbor Laboratory Press, Cold Spring Harbor, NY, pp. 129–176.
- 6.Gross C.A., Chan,C., Dombroski,A., Gruber,T., Sharp,M., Tupy,J. and Young,B. (1998) Cold Spring Harbor Symp. Quant. Biol., LXIII, 141–155. [DOI] [PubMed] [Google Scholar]
- 7.Ross W., Gosink,K.K., Salamon,J., Igarashi,K., Zou,C., Ishihama,A., Severinov,K. and Gourse,R.L. (1993) Science, 262, 1407–1413. [DOI] [PubMed] [Google Scholar]
- 8.Nussinov R. (1984) J. Biol. Chem., 259, 6798–6805. [PubMed] [Google Scholar]
- 9.Aoyama T. and Takanami,M. (1987) Biochim. Biophys. Acta, 949, 311–317. [DOI] [PubMed] [Google Scholar]
- 10.Auble D.T. and deHaseth,P.L. (1988) J. Mol. Biol., 202, 471–482. [DOI] [PubMed] [Google Scholar]
- 11.Lozinski T., Markiewicz,W.T., Wyrzykiewcz,T.K. and Wierchowski,K.L. (1989) Nucleic Acids Res., 17, 3855–3863. [DOI] [PMC free article] [PubMed] [Google Scholar]
- 12.O’Neill M.C. (1989) J. Biol. Chem., 264, 5522–5530. [PubMed] [Google Scholar]
- 13.Bown J.A., Barne,K.A., Minchin,S.D. and Busby,S.J.W. (1997) In Eckstein,F. and Lilley,D.M.J. (eds), Nucleic Acids and Molecular Biology. Springer-Verlag, Berlin, Germany, Vol. 11, pp. 41–52.
- 14.Ponnambalam S., Chan,B. and Busby,S. (1988) Mol. Microbiol., 2, 165–172. [DOI] [PubMed] [Google Scholar]
- 15.Ponnambalam S., Webster,C., Bingham,A. and Busby,S. (1986) J. Biol. Chem., 261, 16043–16048. [PubMed] [Google Scholar]
- 16.Keilty S. and Rosenberg,M. (1987) J. Biol. Chem., 262, 6389–6395. [PubMed] [Google Scholar]
- 17.Minchin S. and Busby,S. (1993) Biochem. J., 289, 771–775. [DOI] [PMC free article] [PubMed] [Google Scholar]
- 18.Barne K.A., Bown,J.A., Busby,S.J.W. and Minchin,S.D. (1997) EMBO J., 16, 4034–4040. [DOI] [PMC free article] [PubMed] [Google Scholar]
- 19.Bown J.A., Owens,J.T., Meares,C.F., Fujita,N., Ishihama,A., Busby,S.J.W. and Minchin,S.D. (1999) J. Biol. Chem., 274, 2263–2270. [DOI] [PubMed] [Google Scholar]
- 20.Hanahan D. (1983) J. Mol. Biol., 166, 557–580. [DOI] [PubMed] [Google Scholar]
- 21.Kelsall A., Evans,C. and Busby,S. (1985) FEBS Lett., 180, 155–159. [Google Scholar]
- 22.Lodge J., Fear,J., Busby,S., Gunasekaran,P. and Kamini,N.-R. (1992) FEMS Microbiol. Lett., 95, 271–276. [DOI] [PubMed] [Google Scholar]
- 23.Miller J. (1972) Experiments in Molecular Genetics. Cold Spring Harbor Laboratory Press, Cold Spring Harbor, NY.
- 24.Chan B. and Busby,S. (1989) Gene, 84, 227–236. [DOI] [PubMed] [Google Scholar]
- 25.Kolb A., Kotlarz,D., Kusano,S. and Ishihama,A. (1995) Nucleic Acids Res., 23, 819–826. [DOI] [PMC free article] [PubMed] [Google Scholar]
- 26.Savery N.J., Lloyd,G.S., Kainz,M., Gaal,T., Ross,W., Ebright,R.H., Gourse,R.L. and Busby,S.J.W. (1998) EMBO J., 17, 3439–3447. [DOI] [PMC free article] [PubMed] [Google Scholar]
- 27.Busby S., Kolb,A. and Minchin S. (1994) In Neale,G. (ed.), Protein–DNA Interactions: Principles and Protocols. Humana Press, Totowa, NJ, Ch. 31, pp. 397–411.
- 28.Kolb A., Igarashi,K., Ishihama,A., Lavigne,M., Buckle,M. and Buc,H. (1993) Nucleic Acids Res., 21, 319–326. [DOI] [PMC free article] [PubMed] [Google Scholar]
- 29.Wing H., Williams,S. and Busby,S. (1995) J. Bacteriol., 177, 6704–6710. [DOI] [PMC free article] [PubMed] [Google Scholar]
- 30.Rosenberg M. and Court,D. (1979) Annu. Rev. Genet., 13, 319–353. [DOI] [PubMed] [Google Scholar]
- 31.Harley C.B. and Reynolds,R.P. (1987) Nucleic Acids Res., 15, 2343–2361. [DOI] [PMC free article] [PubMed] [Google Scholar]
- 32.Lisser S. and Margalit,H. (1993) Nucleic Acids Res., 21, 1507–1516. [DOI] [PMC free article] [PubMed] [Google Scholar]
- 33.Ozoline O., Deev,A.A. and Arkhipova,M.V. (1997) Nucleic Acids Res., 25, 4703–4709. [DOI] [PMC free article] [PubMed] [Google Scholar]
- 34.Johnston F., Ponnambalam,S. and Busby,S. (1987) J. Mol. Biol., 195, 745–748. [DOI] [PubMed] [Google Scholar]
- 35.Burns H., Ishihama,A. and Minchin,S. (1999) Nucleic Acids Res., 27, 2051–2056. [DOI] [PMC free article] [PubMed] [Google Scholar]
- 36.Voskuil M.I., Voepel,K. and Chambliss,G.H. (1995) Mol. Microbiol., 17, 271–279. [DOI] [PubMed] [Google Scholar]
- 37.Camacho A. and Salas,M. (1999) J. Mol. Biol., 286, 683–693. [DOI] [PubMed] [Google Scholar]
- 38.Helmann J.D. (1995) Nucleic Acids Res., 23, 2351–2360. [DOI] [PMC free article] [PubMed] [Google Scholar]