Abstract
Video-based screening of pooled libraries is a powerful approach for directed evolution of biosensors because it allows selection along multiple dimensions simultaneously from large libraries. Here we develop a screening platform, Photopick, which achieves precise phenotype-activated photoselection over a large field of view (2.3 x 2.3 mm, containing > 103 cells, per shot). We used the Photopick platform to evolve Archaerhodopsin (Arch)-derived genetically encoded voltage indicators (GEVIs) with improved signal-to-noise ratio (QuasAr6a) and kinetics (QuasAr6b). These GEVIs gave improved signals in cultured neurons and in live mouse brains. By combining targeted in vivo optogenetic stimulation with high-precision voltage imaging, we characterized inhibitory synaptic coupling between individual cortical NDNF interneurons, and excitatory electrical synapses between individual hippocampal PV neurons. The QuasAr6 GEVIs are powerful tools for all-optical electrophysiology and the Photopick approach could be adapted to evolve a broad range of biosensors.
Introduction
Genetically encoded biosensors can dramatically advance our understanding of in vivo neural dynamics 1–3, but development of improved biosensors is often laborious 4, 5. Dynamic parameters, including signal-to-noise ratio (SNR), sensitivity, and kinetics, are critical for sensor performance. Generally, there is a tradeoff between the throughput of a screen and the richness of information obtained from each variant. In one limit, pooled screens, such as fluorescence-activated cell sorting (FACS), can readily probe libraries of size > 106, but only assess static parameters and thus are ill-suited for developing dynamic sensors. In the other limit, arrayed screens are compatible with information-rich, video-based readout, but require cloning of individually isolated and sequenced variants. Automated microscopy of pooled libraries, followed by optically targeted selection, has recently emerged as a promising strategy for large-scale screens of complex phenotypes 6–11.
Genetically encoded voltage indicators (GEVIs) can report membrane voltage in vivo 8, 12–24, and there is substantial interest in improving their performance. A screen of GEVIs must overcome several challenges. First, for transmembrane proteins such as GEVIs, trafficking and protein function often differ substantially between bacteria and mammalian cells 25, so it is preferable to screen in mammalian cells. Second, testing of GEVIs requires inducing reliable membrane potential changes, a challenging task in most stable cell lines. For these reasons, GEVIs are a challenging target for screening.
Here we present a video-based pooled screening platform that combines ultra-wide field imaging and a phenotype-activated photoselection scheme (Photopick) in mammalian cells. We used this platform to develop new Archaerhodopsin 3 (Arch)-derived GEVIs which showed improved signal-to-noise ratio (QuasAr6a) and kinetics (QuasAr6b) in cultured neurons and in live mouse brains.
A unique advantage of Arch-derived GEVIs is that they can be combined with blue-shifted channelrhodopsins for simultaneous recording and perturbation of membrane potentials, i.e., all-optical electrophysiology, or Optopatch 26. With QuasAr6a-based Optopatch, we demonstrated in vivo functional connectivity mapping between optically targeted interneurons in neocortical layer 1. With QuasAr6b-based Optopatch, we demonstrated optical detection of electrical synapses between PV neurons. The QuasAr6 GEVIs have also recently been used to map dendritic voltages in acute brain slices 27. The Photopick pooled screening platform is a powerful approach for high-dimensional optimization of biosensors, and the improved Arch-derived GEVIs can be broadly useful for all-optical interrogation of neural circuits.
Results
Video-based screen and photoselection in mammalian cells
We developed a video-based pooled screening platform for directed evolution of biosensors in mammalian cells. Fig. 1a shows the workflow. A phototaggable (photo-convertible, activable, or switchable) fluorescent protein (FP) is co-expressed with the mutant library in the host cells. An ultra-widefield imaging system, modified from the Firefly microscope described in 28, records the dynamic responses of >103 cells per 2.3 mm × 2.3 mm field of view with millisecond time resolution. Cells with the desired phenotype are selectively phototagged through patterned Illumination. We calibrated the micromirror-based optical targeting system to achieve high fidelity and efficiency at cellular resolution (Fig. 1b–d, Extended Data Fig. 1a, d, Supplementary Methods) and found mEOS4a29, a green-to-red photoconvertible FP, showed high photoconversion efficiency (Extended Data Fig. 1b, c). The phototagged cells are then sorted and recovered with fluorescence activated cell sorting (FACS). The phototagged population is expanded to create a sub-library. The phototagged FP degrades during culture expansion while fresh FP is synthesized, thus resetting the fluorescent marker to its initial state. The screening, tagging, and selection process can be iterated to further enrich for the desired phenotype. The shift of the prevalence of candidate reporter genes is quantified with high-throughput (Illumina) sequencing. Our approach is distinguished from earlier image-based screens6–11 by the ultrawide field of view, high-speed imaging, and integration with an engineered electrically excitable cell line.
Figure 1. Photopick enables video-based pooled screening in mammalian cells.
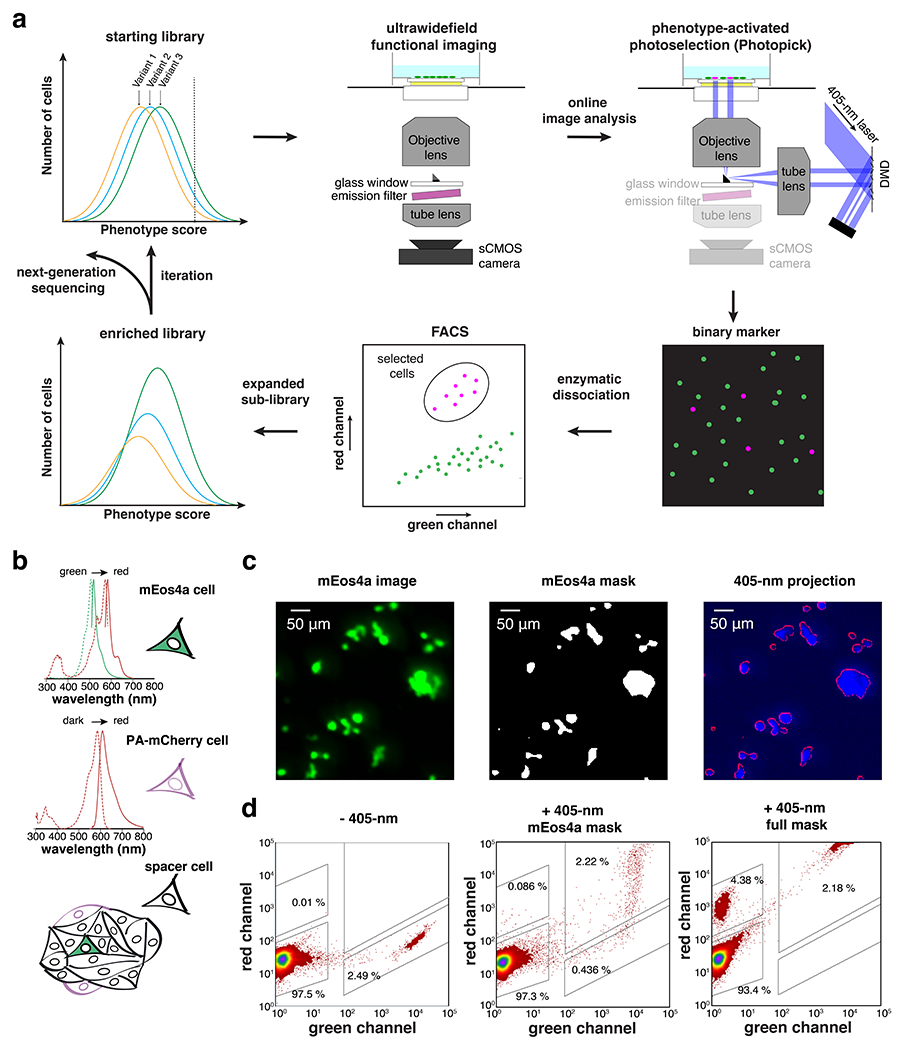
a. Photopick comprises a video-based pooled screening pipeline for enrichment of sensor variants with improved performance. b. Spectra of photo-taggable fluorescent proteins, mEos4a and PA-mCherry, used to validate the optical targeting system. Spectra from FPbase 61. c. Selective phototagging of mEos4a+ cells in a hybrid monolayer of mEos4a+, PAmCherry+ and non-fluorescent HEK cells. d. FACS analyses on the efficiency and fidelity of photoselection (Green channel: exc. 488 nm; Red channel: exc. 561 nm; n = 2 trials).
Directed evolution of Arch-derived GEVIs
High-throughput GEVI screening requires a means to induce spikes in membrane potential (see e.g. 19, 30 ). We used spiking HEK cells that co-expressed a voltage-gated sodium channel (NaV1.5) and an inward-rectifier potassium channel (Kir2.1). In contrast to previous spiking HEK lines31, 32 the Kir2.1 was under control of a doxycycline-inducible promoter to prevent loss of expression upon multiple passages. We also stably expressed a blue-shifted channelrhodopsin, CheRiff, to optogenetically evoke the spikes. The spiking HEK cells produced collective action potential-like spikes when grown in a confluent monolayer and optically stimulated (Methods). Whole-cell patch clamp (Fig. 2b and Extended Data Fig. 2a) and voltage imaging with a red voltage-sensitive dye BeRST133 (Fig. 2c) validated the all-or-none spikes in response to increasing levels of optogenetic stimulation. Conveniently, endogenous gap junction proteins equalized changes of membrane potential across connected cells34. Spikes had a narrow distribution of BeRST1 fluorescence changes (ΔF/F0 = 0.25 ± 0.02, mean ± S.D., Extended Data Fig. 2c). Thus, optogenetically triggered and gap junction-coupled spiking HEK cells provided a substrate with uniform action potentials.
Figure 2. Directed evolution of an archaerhodopsin-derived genetically encoded voltage indicator.
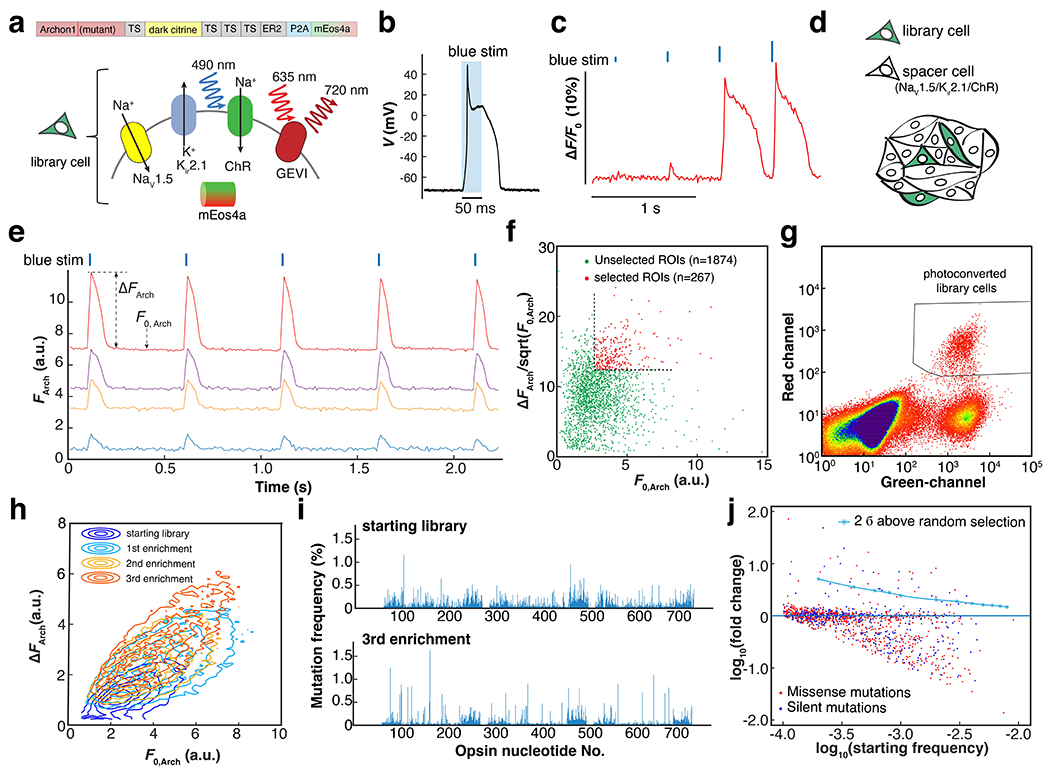
a. Genetic composition of the library cells. Spiking HEK cells containing a candidate GEVI mutant, channelrhodopsin actuator, mEos4a phototag, and NaV1.5 and Kir2.1 to imbue electrical excitability. Here TS is the Trafficking Sequence from Kir2.162, ER2 is the endoplasmic reticulum export motif from Kir2.0 63, 64, and P2A is a self-cleaving peptide. B. Optogenetically triggered spike of the spiking HEK cell, recorded via whole-cell patch clamp (exc. At 488 nm, 4.4 mW/mm2, see also Extended Data Fig. 2a). c. Threshold response of spiking HEK cells to 10-ms increasing optogenetic stimulus strengths, visualized with the voltage-sensitive dye BeRST1 (exc. 635 nm). D. Sample preparation for pooled screening. Library cells were mixed with electrically excitable but non-fluorescent and optically inert spacer cells in approximately a 1:10 ratio. E. Examples of fluorescence traces extracted from individual sources in a pooled library screen (Arch fluorescence channel). Precisely timed spikes were evoked by blue light stimulation (blue ticks, exc. 490 nm, 10 ms). ΔFArch is calculated as the average baseline-to-peak difference in Arch-channel fluorescence and F0, Arch is the average baseline fluorescence. For the details of image segmentation, see Extended Data Fig. 3c. f. Scatter plot of vs. F0, Arch for all the automatically segmented ROIs in a 2.3-mm × 2.3-mm FOV. The quantity was used as a measure of shot-noise-limited SNR. Selection threshold: 50th percentile for F0, Arch; 75th percentile for . g. Representative FACS data showing three distinct populations: photoconverted library cells; unselected library cells; spacer cells (Green channel: exc. 488 nm; Red channel: exc. 561 nm). h. Three rounds of iterative enrichment shifted the population phenotype. i. Manhattan plot showing the mutation frequency at each nucleotide in starting and post-screening libraries. j. Logarithmic plot of the starting mutation frequency vs. the fold of change. In this library, there were 970 missense mutations and 405 silent mutations.
As the starting template, we chose the GEVI Archon1 35, which has been well validated in vivo18, 20, 21. To test the baseline variability across cells expressing Archon1, we made a monoclonal Archon1-Citrine spiking HEK cell line. Compared to BeRST1, the GEVI showed substantially larger cell-to-cell variability in response to optogenetically induced spikes (ΔF/F0 = 0.23 ± 0.10, mean ± S.D., n = 20,900 cells, Extended Data Fig. 2d), including outliers (the top 1% of cells had ΔF/F0 > 0.54), likely due to variations in trafficking. Due to the long positive tail in baseline single-cell sensitivity, we concluded that a pooled screen should select for population-level enrichment in genotype frequency, rather than picking individual high-performing cells. To implement an enrichment (as opposed to outlier) screen requires many-fold coverage of the genetic diversity of the library, and selecting enough cells so that shifts in genotype frequency reflect mean genotype performance.
Since the voltage-sensing mechanism of rhodopsin-derived GEVIs is not fully understood 36–38, a structure-guided approach might miss functionally important mutations. Beneficial mutations were previously found throughout the scaffold (Supplementary Figure 1) 26, 35. For these reasons, we introduced random mutations throughout the opsin using error-prone PCR (Fig. 2a, Extended Data Fig. 2e, Methods). The library included >103 variants (Fig. 2j), though non-uniform mutation rates led to variable mutation frequency.
We developed a bicistronic vector to co-express single copies of GEVI mutants and mEos4a, and introduced these into spiking HEK cells via low-titer lentiviral transduction (multiplicity of infection ~ 0.01; Fig. 2a, Extended Data Fig. 3e, Methods). Expressing cells were enriched by FACS and mixed with CheRiff-expressing spiking HEK cells lacking a GEVI (“spacer” cells) at a ratio of ~1:10 (Fig. 2d). The spacer cells homogenized the membrane potential via gap-junction coupling and created gaps between the library cells to facilitate image segmentation and photoselection.
From each round of selection, 60,000 to 100,000 cells (30,000 - 50,000 cells per dish, 2 dishes per round) were scanned, corresponding to 40 - 100 copies/variant. For each cell, we calculated baseline brightness, F0, and fluorescence change, ΔF, induced by an optogenetically triggered action potential (Fig. 2e). We used the quantity as a measure of the shot noise-limited signal-to-noise ratio (SNR). To select mutants that were both sensitive and bright, we set thresholds at ΔF > 50th percentile and > 75th percentile. Approximately 12.5% of cells were selected for photoconversion (Fig. 2f, Extended Data Fig. 2f, g). We avoided over-stringent selection so that the outcome was not dominated by outliers.
The cells were then dissociated and sorted based on their fluorescent markers. Three populations were observed in FACS (Fig. 2g): spacer cells (green−, red−), unconverted library cells (green+, red−), and photoconverted library cells (green+, red+). The converted library cells were recovered and then expanded for more screening. After three rounds of enrichment, we observed that the population had shifted towards higher F0 and higher ΔF (Fig. 2h). We sequenced the opsin mutations and analyzed the fractional changes in single nucleotide polymorphism (SNP) prevalence relative to the starting library (to control for variations in initial mutation frequency; Fig. 2i,j). While the majority of SNPs were either unaffected or depleted, some missense mutations were positively selected above the 2σ threshold determined from a stochastic stimulation (Methods).
Engineering of QuasAr6a and QuasAr6b
The sequencing results (Fig. 2i, j) provided a short list of candidate mutations. We first created a panel of single missense mutants and screened them in HEK cells for total expression and ratio of brightness of the GEVI to the attached fluorescent protein tag, as a measure of per-molecule GEVI brightness (Extended Data Fig. 4c, d). We prioritized mutations that enhanced per-molecule brightness as we hypothesized that this photophysical property is more likely to conserve between cell types, whereas trafficking or total expression may be more context dependent.
When we sought to combine these mutations, we found that combining two mutations that were close in three-dimensional space often resulted in detrimental effects on trafficking. Therefore, we combined distant mutations based on the Archaerhodopsin 3 structure (PDB 6GUY) and tested different combinations of mutations that enhanced per-molecule brightness (W42G, V124G, R237I, A238S) and expression level in HEK cells (M85I, F98L, W148C). To our knowledge, most of these sites have not been previously explored in Arch-based GEVIs (Extended Data Fig. 3b). We arrived at two new GEVIs (Fig. 3a, Supplementary Figure 2): QuasAr6a (Archon1 + W42G/M85I/F98L/V124G/W148C/A238S) and QuasAr6b (Archon1 + W42G/M85I/F98L/V124G/W148C/R237I). These two constructs differed in A238S vs. R237I. We found that R237I improved activation and deactivation kinetics.
Figure 3. Characterization of QuasAr6a and QuasAr6b in neurons in culture and slice.
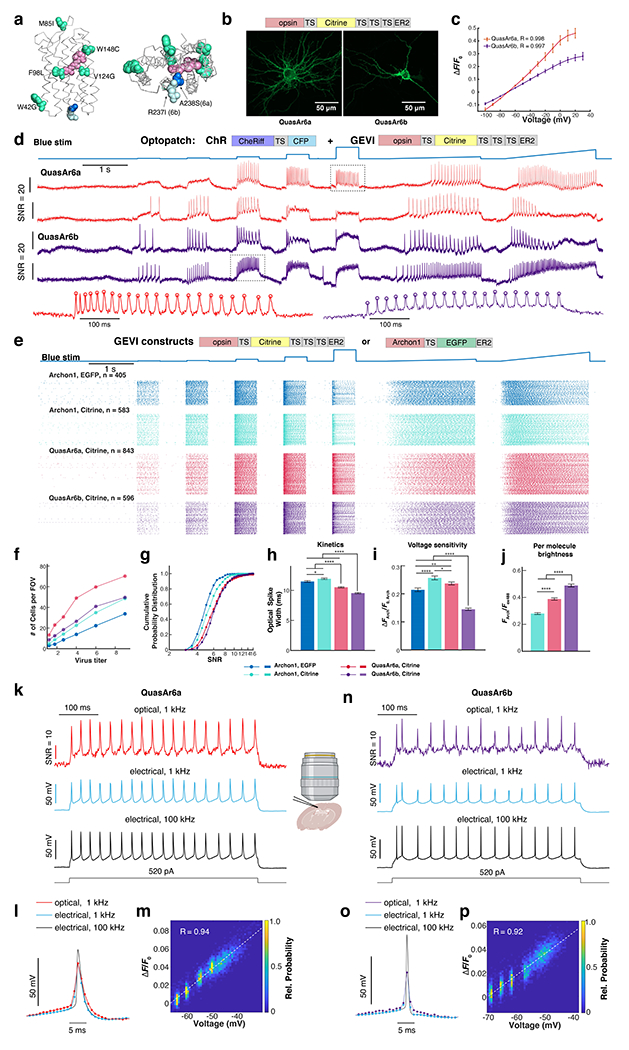
a. Homology model of QuasAr6a and QuasAr6b on the Archaerhodopsin 3 crystal structure (PDB: 6GUY), with the retinal chromophore (pink) and mutated residues for creating QuasAr6a and QuasAr6 from Archon1 highlighted (lime-green: mutations shared by QuasAr6a and 6b; blue: A238S for QuasAr6a; pale cyan: R237I for QuasAr6b). b. Confocal image of Citrine fluorescence (z-projection) from QuasAr6a-Citrine (n = 5 cells) and QuasAr6b-Citrine (n = 5 cells) expressed in cultured rat hippocampal neurons. c. Fluorescence vs. voltage curves for QuasAr6a (n = 3 cells) and QuasAr6b (n = 4 cells) measured under voltage clamp in cultured neurons. Fluorescence is measured relative to F0 at the holding potential −70 mV. Error bars: S.D. d. Example traces from high-throughput Optopatch measurements using QuasAr6a or QuasAr6b combined with CheRiff-CFP in cultured rat hippocampal neurons. In the magnified views below, the circles indicate the automatically detected spike peaks. e. Spike raster of the Optopatch measurements for five Archaerhodopsin-derived GEVIs at the highest titers tested. The GEVIs carried either TS-EGFP-ER2 or TS-Citrine-TS×3-ER2 tags. f. Average number of neurons with SNR > 3 per FOV with different GEVIs, as a function of virus titer. g. Cumulative probability distribution of SNR for different GEVIs at the highest virus titer. The fraction of cells with borderline SNR (between 3 and 4) was: 6% QuasAr6a-Citrine, 3% QuasAr6b-Citrine, 21% Archon1-EGFP, and 13% Archon1-Citrine. h-j. Comparison of optical spike widths (full width measured at 80% below the action potential peak), voltage sensitivity, and per-molecule brightness at the highest lentivirus titer (n = 405, 583, 843, 596 cells for Archon1-EGFP, Archon1-Citrine, QuasAr6a-Citrine, QuasAr6b-Citrine. Error bars: S.E.M.). *p: 0.01 - 0.05; **p: 0.001 - 0.01; ****p < 0.0001 (two-sided student’s t-test without correction for multiple comparisons). k. Concurrent fluorescence (frame rate = 1 kHz) and current-clamp recordings (acquisition rate = 100 kHz) in acute brain slice of mouse Layer2/3 cortical neurons expressing somQuasAr6a-EGFP. The spikes were evoked via steady current injection. The 100 kHz-electrical trace was downsampled to reveal the low-pass filtering effect of the 1-kHz acquisition rate. l. Overlay of spike-triggered average waveform for the optical and electrical traces. m. Raw fluorescence vs. the subthreshold voltage. n-p. Similar to k-m, but for somQuasAr6b-EGFP.
The original Archon1 construct consists of the opsin, a trafficking sequence (TS), followed by an EGFP tag and an endoplasmic reticulum export signal (ER2) (TS-EGFP-ER2). We previously found that a combination of Citrine and multiple repeats of trafficking sequence (TS-Citrine-TS×3-ER2) improved the voltage imaging SNRs in cultured neurons 16. Thus, for subsequent characterization in cultured cells, the QuasAr6a and QuasAr6b opsins carried this optimized Citrine tag.
Characterization of QuasAr6a and QuasAr6b in HEK293T cells
We performed biophysical characterization of QuasAr6a-Citrine and QuasAr6b-Citrine expressed in HEK293T cells (Extended Data Fig. 4). Both showed excellent membrane localization (Extended Data Fig. 4a). Compared with the template Archon1, QuasAr6a exhibited enhanced per molecule brightness (1.7-fold, Extended Data Fig. 4b), similar voltage sensitivity (73 ± 8% over 100 mV for QuasAr6a, n = 5 cells; 70 ± 13% over 100 mV for Archon1, n = 4 cells; mean ± S.D., Extended Data Fig. 4c) and similar kinetics at 30 °C (QuasAr6a: τ(on, fast) = 1.8 ± 0.5 ms, τ(off, fast) = 1.3 ± 0.5 ms; n = 7 cells; Archon1: τ(on, fast) = 2.2 ± 0.3 ms, τ(off, fast) = 1.6 ± 0.3 ms, n = 6 cells; Extended Data Fig. 4d,e). QuasAr6b showed enhanced per molecule brightness (2.0-fold) and smaller fractional voltage sensitivity (24 ± 4% over 100 mV, n = 4 cells; mean ± S.D., Extended Data Fig. 4c), but faster on and off-kinetics at 30 °C (τ(on, fast) = 0.8 ± 0.2 ms, τ(off, fast) = 0.8 ± 0.3 ms; n = 7 cells Extended Data Fig. 4d,e). Both QuasAr6a and QuasAr6b showed linear fluorescence-voltage (F-V) relations from −70 mV to 30 mV (Extended Data Fig. 4c) and excellent photostability (Extended Data Fig. 6f). We also found negligible photocurrent under blue or red illumination for QuasAr6a or QuasAr6b (Extended Data Fig. 4g,h).
Characterization of QuasAr6a and QuasAr6b in neurons
In cultured rat hippocampal neurons, both QuasAr6a and QuasAr6b showed efficient membrane localization (Fig. 3b). QuasAr6a and QuasAr6b showed a fractional voltage sensitivity of 43 ± 4% and 27 ± 3% (mean ± S.D), respectively, from −70 mV to +20 mV (Fig. 3c). To obtain robust statistics on the sensor performance, we used a high-throughput all-optical electrophysiology platform that could perform voltage imaging of > 100 cultured neurons in parallel at a 1 kHz frame rate 39. We compared four Arch-derived GEVIs: Archon1-Citrine, QuasAr6a-Citrine, QuasAr6b-Citrine, and Archon1-EGFP that carried a TS-EGFP-ER2 tag as described in the original report 35. Each of these GEVIs was paired with CheRiff via a bicistronic lentiviral expression vector to enable Optopatch measurement of neuronal excitability (Fig. 3d, e). We tested each construct at 6 viral titers, 4 replicate wells for each condition. At the highest titer we measured between 405 and 843 cells for each construct, for a total of 2427 single-cell voltage imaging recordings.
Neurons were automatically segmented using an activity-based segmentation 40. Cells were kept if the single-trial, single-spike SNR (spike height:standard deviation of baseline noise) exceeded 3 (Methods). Since neurons in all wells were plated at the same density, the number of recorded cells per field of view (FOV) was an indicator of sensor performance (Fig. 3f). Across the titers, QuasAr6a consistently gave 2.1 to 4-fold more neurons with SNR above threshold per FOV (average 70 neurons per FOV at highest titer, n = 12 FOVs) compared to Archon1-EGFP (average 34 neurons per FOV at highest titer), and at least 1.5-fold more above-threshold neurons per FOV compared to Archon1-Citrine (average 49 neurons per FOV at highest titer). QuasAr6b also outperformed Archon1-EGFP by 1.5 - 2.2-fold (average 50 neurons per FOV at highest titer) and yielded comparable numbers of above-threshold neurons per FOV as Archon1-Citrine.
Of the neurons above threshold, QuasAr6a and 6b both produced significantly higher average SNR compared to either Archon1-Citrine or Archon1-EGFP (Fig. 3g, Extended Data Fig. 5a). For Archon1, substituting the TS-EGFP-ER2 tag with the TS-Citrine-TS×3-ER2 tag improved voltage sensitivity by ~20% across the titers and hence gave higher SNR (Fig. 3g, Extended Data Fig. 5c), likely due to improved trafficking (see 16, Extended Data Fig. 1). Within each GEVI type, expression level did not affect measured spike width (Extended Data Fig. 5g–j), suggesting that GEVI expression did not affect basic biophysical properties of the cells. The optical spike widths (full width at 80% below the action potential peak) reported by both QuasAr6a (10.4 ± 0.1 ms; mean ± SEM, n = 843 neurons) and QuasAr6b (9.5 ± 0.1 ms, n = 596 neurons) were smaller than the spike widths reported by Archon1-Citrine (11.9 ± 0.1 ms, n = 583 neurons) or Archon1-EGFP (11.4 ± 0.1 ms, n = 583 neurons; Fig. 3h, Extended Data Fig. 5b). We attribute the spike broadening relative to typical in vivo measurements to the fact that the cultured neuron data were acquired at room temperature.
Despite having slightly lower sensitivity at the highest titer tested, at most titers the voltage sensitivity of QuasAr6a-Citrine was comparable to that of Archon1-Citrine and outperformed Archon1-EGFP (Fig. 3i, Extended Data Fig. 5c). The voltage sensitivity of QuasAr6b was lower than Archon1-Citrine or QuasAr6a-Citrine by 40~45% (Fig. 3i, Extended Data Fig. 5c). Nonetheless, the superior brightness and 1.5-fold greater expression of QuasAr6b compensated for its lower voltage sensitivity, to give a higher SNR. QuasAr6a and QuasAr6b showed enhanced per-molecule brightness (FArch/Fex488) compared with Archon1 (1.4-fold and 1.7-fold, respectively; Fig. 3j, Extended Data Fig. 5d).
We then tested QuasAr6a and QuasAr6b in acute mouse brain slices. To resolve individual neurons, we designed soma-targeted versions of QuasAr6a and QuasAr6b by appending a KV2.1 trafficking motif to the C-terminus 16, 18, 41, 42. For the soma-targeted Arch-derived GEVIs, we have not systematically evaluated whether the choice of FP tag makes a difference for their in vivo performance. To stay consistent with the recent reports 18, 20, the somQuasAr6a and somQuasAr6b constructs carried an EGFP tag as an expression marker. For optogenetic activation in tissue, we used a soma-localized version of CheRiff, somCheRiff 16. We made Cre-dependent AAV2/9 vectors for somQuasAr6a and somQuasAr6b and the corresponding bicistronic Optopatch constructs. We sparsely expressed the Optopatch constructs in mouse cortex and hippocampus. Confocal imaging confirmed that somQuasAr6a/b and somCheRiff trafficked well in vivo and were largely restricted to soma and proximal dendrites (Extended Data Fig. 6).
Patch clamp recordings of somQuasAr6a- or somQuasAr6b-expressing cortical neurons in brain slices showed that these GEVIs did not detectably affect membrane electrical properties or excitability (Extended Data Fig. 7). Concurrent fluorescence imaging and current clamp recordings showed that somQuasAr6a and someQuasAr6b reported the membrane potential with high fidelity (Fig. 3k–p). The spike-triggered average optical and electrical spike waveforms showed high correlation when both were sampled at 1 kHz (QuasAr6a: R = 0.97 ± 0.02, n = 6 cells; QuasAr6b: R = 0.984 ± 0.004, n = 7 cells; Fig. 3i,p). The fluorescence correlated linearly with the subthreshold membrane potentials (QuasAr6a: R = 0.94; QuasAr6b, R = 0.92, Fig. 3m, p).
The fluorescence of several Arch-based GEVIs is modulated by blue light 8, 16, so we assessed this effect in QuasAr6a and QuasAr6b (Extended Data Fig. 10). Under blue light intensity used for optogenetic stimulation (488 nm, 60 mW/cm2), blue light modulation of the fluorescence was < 3% (Extended Data Fig. 10a–f). Illumination with 6-fold stronger blue light (370 mW/cm2) led to small fluorescence enhancement of QuasAr6a and QuasAr6b (QuasAr6a: 7 ± 2%, QuasAr6b: 12 ± 2%, Extended Data Fig. 10g). Overall, QuasAr6a and QuasAr6b can be combined with optogenetic stimulation with negligible crosstalk under most circumstances. For strong stimuli time-locked to a subthreshold voltage response, corrections for crosstalk may be necessary.
Validation of QuasAr6a and QuasAr6b in vivo
Next, we compared the in vivo performance of the QuasAr6 GEVIs. For one-photon voltage imaging in tissue, structured illumination partially overcomes the effects of background autofluorescence and light scattering. We previously characterized different structured illumination schemes in detail (see Fig. 5 of 8). To achieve the highest SNR, we used a holographic structured illumination microscope that patterned the 635-nm light for voltage imaging (Extended Data Fig. 8a,b) and the 488-nm light for targeted optogenetic stimulation (see Figs. 1, S1, S2 of Ref. 20). Cells were recorded one at a time in head-fixed, anesthetized mice (Fig. 4, Extended Data Fig. 8).
Figure 5. Optical dissection of inhibitory connections between NDNF interneurons in visual cortex.
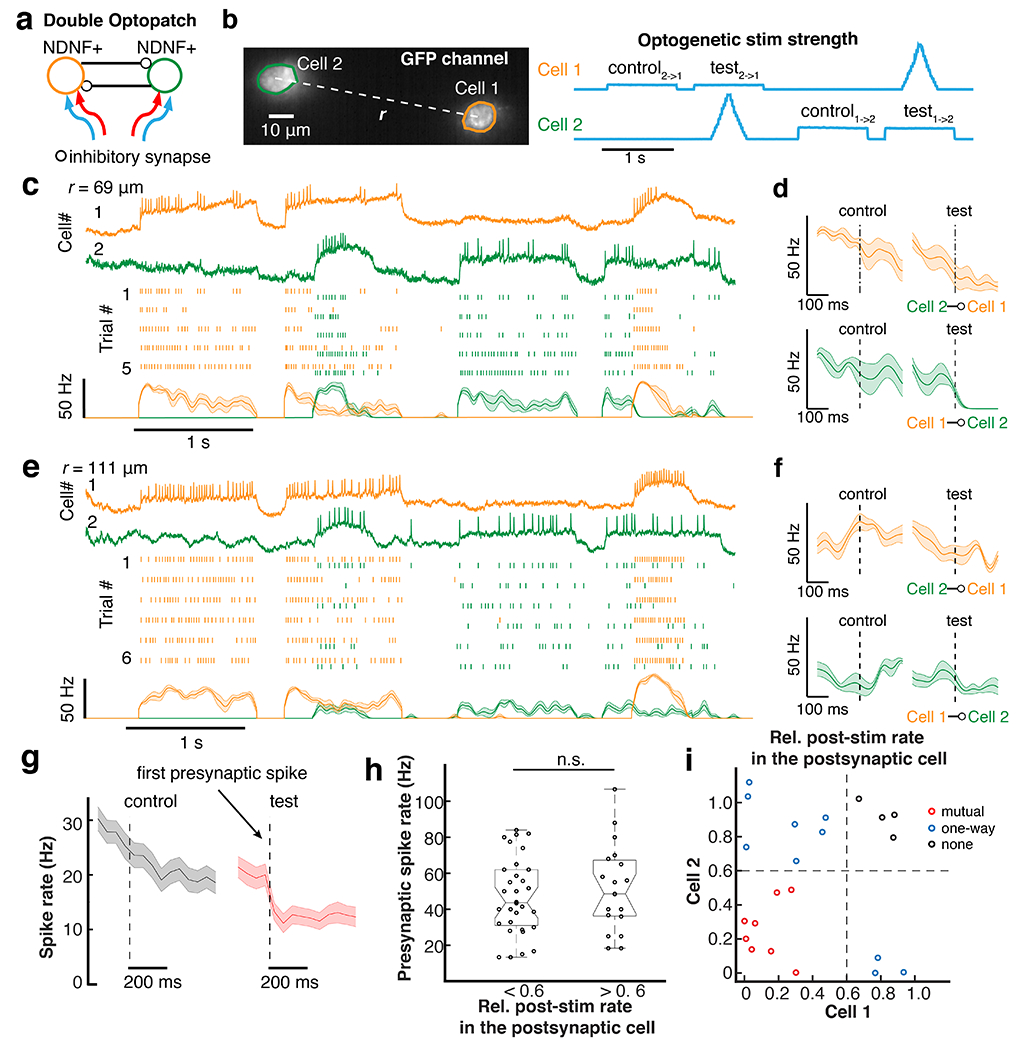
a. Scheme of two-cell Optopatch in NDNF interneurons. b. Optogenetic stimulation waveform for probing inhibitory connections in a pair of optically targeted NDNF cells. The presynaptic cell was activated by ramp stimulation. The postsynaptic cell was depolarized with a constant step stimulation to increase the driving force for inhibitory currents. c. Optopatch revealed strong mutual inhibition between a pair of NDNF neurons (inter-soma distance r = 69 μm). Top to bottom: representative traces, raster plots for 5 consecutive trials; spike rate estimated by Bayesian Adaptive Kernel Smoother. d. For the cell pair in c, change of spike rate after the onset of the first presynaptic spike (dashed line) or at the corresponding time in the control epoch. e, f. Similar to c,d, for a pair of NDNF cells with weaker inhibitory connections (inter-soma distance r = 111 μm). g. Average of all the postsynaptic cells (n = 51 cells). Shading in c - g: SEM. h. The strong inhibitory connections and the weak inhibitory connections had similar presynaptic spike rates. The postsynaptic inhibition strength was quantified by the relative post-stimulation rate in the postsynaptic cell, defined as the ratio of the minimal spike rate in the postsynaptic cell within the window 0 to 100 ms after the first presynaptic spike, to the average spike rate during the window −100 ms to −10 ms before the first presynaptic spike. A cutoff of 0.6 was chosen to separate strong (n = 32) and weak (n = 19) inhibitory connections. Presynaptic spike rate was defined as the average spike rate within the 0-100 ms window after the first presynaptic spike. n.s., not significant, two-sided Wilcoxon rank-sum test. i. Two-way Inhibition strength for 22 pairs of cells. The inhibition strength was quantified by the relative post-stimulation rate.
Figure 4. Characterization of somQuasAr6a- and somQuasAr6b-based Optopatch in vivo.
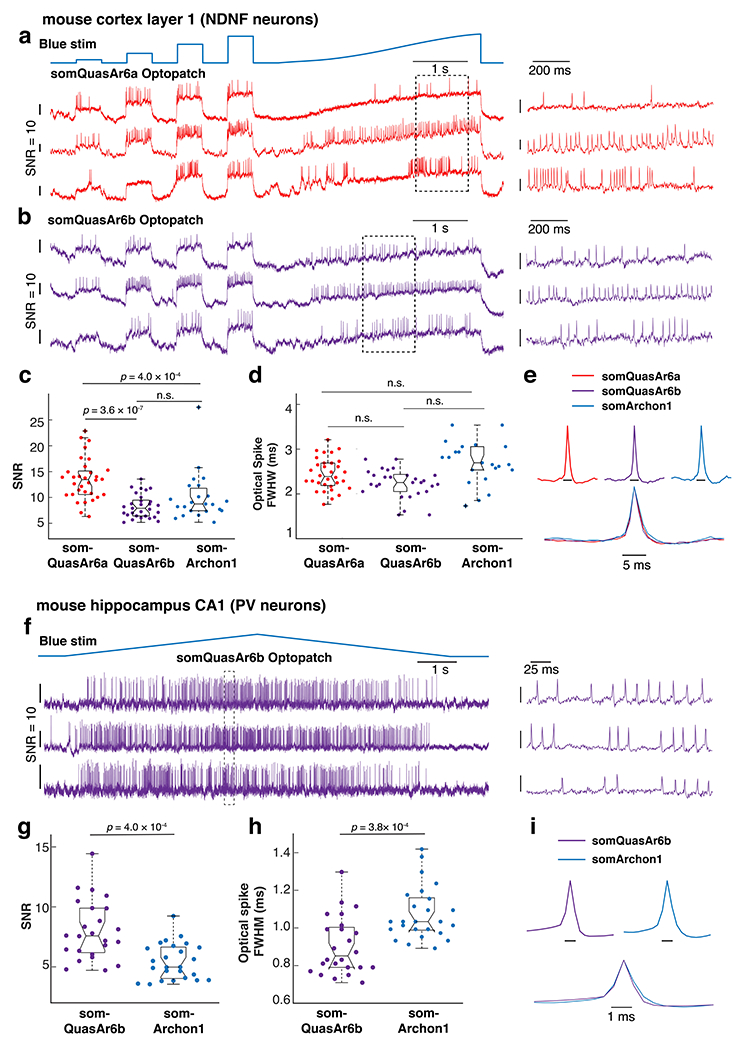
Recordings were performed with a 25x objective (NA = 1.05). a, b. Simultaneous optogenetic stimulation and voltage imaging (996 Hz) in L1 NDNF cells (visual cortex) expressing somQuasAr6a- or somQuasAr6b-based Optopatch in anesthetized mice. Magnified view of the boxed regions is shown on the right. c. Comparison of in vivo SNR of somQuasAr6a (n = 32 cells, 2 animals), somQuasAr6b (n = 29 cells, 2 animals), and somArchon1 (n = 23 cells, 2 animals) in NDNF cells. n.s. not significant, two-sided Wilcoxon rank-sum test. d. Comparison of optical spike full-width at half-maximum (FWHM) of optogenetically triggered spikes in NDNF cells, imaged with somQuasAr6a (n = 32 cells, 2 animals), somQuasAr6b (n = 29 cells, 2 animals), and somArchon1 (n = 23 cells, 2 animals) at a 1 kHz frame rate. n.s., not significant, two-sided Wilcoxon rank-sum test. e. Spike-triggered average fluorescence waveforms of the optogenetically triggered spikes in NDNF cells measured by somQuasAr6a, somQuasAr6b, and somArchon1. f. Double-ramp Optopatch measurements in hippocampal PV cells (voltage imaging at 1973 Hz) in anesthetized mice. Magnified view of the boxed regions is shown on the right. g. Comparison of the in vivo SNR of QuasAr6b (n = 24 cells, 3 animals) and Archon1 in PV cells (n = 25 cells, 2 animals), two-sided Wilcoxon rank-sum test. h. Comparison of optical spike full-width at half-maximum (FWHM) of optogenetically triggered spikes in PV cells, imaged with somQuasAr6b and somArchon1 at a 2 kHz frame rate, two-sided Wilcoxon rank-sum test. i. Spike-triggered average fluorescence waveforms of the optogenetically triggered spikes in PV cells measured by somQuasAr6b, and somArchon1. Box plots: central mark indicates median, bottom edge 25th percentile, top edge 75th percentile, whiskers most extreme data points excluding outliers, ‘+’ symbol outliers.
We first compared somQuasAr6a, somQuasAr6b and somArchon1 in cortical neuron-derived neurotrophic factor (NDNF) cells. In cortex, NDNF marks GABAergic neurogliaform cells mostly restricted to the topmost 100 μm of layer 1 (L1) 43–45. We expressed Optopatch constructs based on somQuasAr6a, somQuasAr6b, or somArchon1 in the visual cortex of NDNF-Cre+/− mice (Fig. 4a–e). . Optopatch constructs gave single-spike SNR values of: somQuasAr6a: 13.5 ± 4.0 (mean ± S.D., n = 32 cells, 2 animals), somQuasAr6b: 8.3 ± 2.3 (mean ± S.D., n = 29 cells, 2 animals) and somArchon1: 9.3 ± 2.8 (mean ± S.D., n = 22 cells, 2 animals, Fig. 4c). In the samples expressing somQuasAr6b and somArchon1, many cells were near the analysis cutoff of SNR = 4, suggesting that the underlying distributions of SNR values may have had lower mean than reported above. All three GEVIs reported spike waveforms with similar optical spike widths (Fig. 4d, e; somQuasAr6a: 2.4 ± 0.4 ms; somQuasAr6b: 2.3 ± 0.3 ms; somArchon1: 2.7 ± 0.5 ms; mean ± S.D.). SomQuasAr6a reliably detected spikes in NDNF cells after 200 seconds of continuous illumination (Extended Data Fig. 9a).
We next compared somQuasAr6b and somArchon1 in fast-spiking hippocampal PV neurons. These interneurons provide strong perisomatic inhibition of nearby pyramidal cells 46 but have been difficult to target via patch clamp in the live mouse hippocampus 47. PV neurons’ narrow spikes (FWHM < 0.5 ms) 48 impose an additional challenge for optical detection. We explored whether the fast variant QuasAr6b could enable accurate detection of these spikes. We injected AAV2/9 for Cre-dependent somQuasAr6b-Optopatch and somArchon1-Optopatch into the hippocampal CA1 of PV-Cre+/− transgenic mice (Extended Data Fig. 6c). The overlying cortical tissue was removed and replaced with a cannula window 16, 49.
We performed voltage imaging at 2 kHz framerate for PV+ neurons expressing the Optopatch constructs in Stratum Oriens (Fig. 4f–I, Extended Data Fig. 8c). somQuasAr6b showed higher SNR (25x: 8.0 ± 2.5, n = 24 cells, 3 animals; 10x: 7.9 ± 2.2, n = 20 cells, 3 animals; mean ± S.D.) and narrower optical FWHM (0.87 ± 0.11 ms, mean ± S.D.) than Archon1 (25x, SNR, 5.4 ± 1.5, n = 23 cells, 2 animals; 10x, SNR, 5.5 ± 1.0; optical FWHM, 1.1 ± 0.15 ms, n = 24 cells, 2 animals).
We also imaged the optogenetically triggered spikes with somQuasAr6b at a framerate of 4 kHz (n = 13 cells, 2 animals, Extended Data Fig. 8d). The mean spike half-width reduced from 0.91 ms at 2 kHz to 0.71 ms at 4 kHz (Extended Data Fig. 8e,f), approaching the spike width measured by patch clamp (0.49 ± 0.04 ms) 48. QuasAr6b reported the PV spikes for up to 200 seconds of imaging (Extended Data Fig. 9b). Thus, somQuasAr6b is a fast and high-SNR sensor suited for reporting sub-millisecond voltage dynamics.
Mapping functional connections between NDNF cells
An optical method that probes cell-to-cell functional connectivity in vivo would be a powerful tool for systems neuroscience. The laterally projecting axon arbors of NDNF cells form a short-range, mutually inhibitory network 20, 43, 45. The role of this lateral inhibition is not well understood. We previously showed that transient optogenetic activation of a population of L1 interneurons suppressed the spiking of a nearby cell 20. However, it was unclear how much effect activation of a single L1 interneuron would have on its neighbors, or how cell-to-cell connection strengths were distributed.
The improved SNR of somQuasAr6a cells permitted us to record from multiple L1 NDNF cells simultaneously, and thereby to correlate activity of putative pre- and post-synaptic cells. In pairs of L1 NDNF cells, we arbitrarily designated one “presynaptic” and one “postsynaptic” (Fig. 5a,b). The postsynaptic cell was optogenetically stimulated with a 1-second step of blue light to depolarize the cell and thereby increase the driving force for inhibitory currents. The presynaptic cell was simultaneously stimulated with a blue light ramp to evoke spiking when the stimulus crossed an optical rheobase threshold. This protocol allowed us to distinguish effects of presynaptic spiking from blue light crosstalk.
We optically monitored the voltage in both cells to observe whether there was a change in the spike-rate of the postsynaptic cell following the first spike in the presynaptic cell. As control measurements, we included epochs without presynaptic stimulation. We then swapped the blue light waveforms between the pair to test connectivity in the other direction (Fig. 5b). For each pair of cells, we performed 2-7 trials. We used a Bayesian Adaptive Kernel Smoother (BAKS) 50 to estimate the instantaneous spike rate. We performed these measurements in anesthetized mice to minimize background voltage fluctuations
We performed double Optopatch experiments on 30 pairs of cells from 4 animals, where the inter-soma distance ranged from 46 μm to 216 μm. Figs. 5c,d show a pair with strong reciprocal inhibition, while Figs. 5e,f show a pair exhibiting weaker, one-way inhibition. To accurately test for a synaptically driven decrease in spike rate, we restricted analysis to postsynaptic cells in which direct optogenetic stimulation evoked a spike rate above 5 Hz (n = 51 cells, 22 pairs where both cells spiked above 5 Hz). Activation of a putative presynaptic cell reduced the mean spike rate of its neighbor from 20 ± 2 Hz to 11 ± 1.7 Hz (mean ± SEM, Fig. 5g). The connections that showed strong inhibition had comparable presynaptic spike rate (n = 32 connections, 47 ± 21 Hz, mean ± S.D.) to the connections that showed weak inhibition (n = 19 connections, 52 ± 24 Hz, mean ± S.D., Fig. 5h). There was no correlation between presynaptic spike rate and strength of postsynaptic inhibition (R = 0.07), confirming that absence of inhibition was not due to absence of presynaptic activity.
We found that 36% of the pairs (8/22) showed reciprocal mutual inhibition, 45% (10/22) showed one-way inhibition, and the rest showed no inhibition (4/22, Fig. 5i). A combinatorial calculation (Methods) indicated that existence of a connection from cell A to B did not affect the probability of connection from B to A. Thus, while inhibitory connections between NDNF cells were strong (~45% spike rate suppression), consistent with results in acute slice 44, this inhibitory effect was not always reciprocal. A key next step will be to relate the functional connectivity maps to the responses of the network to naturalistic sensory and modulatory inputs.
Mapping gap junction-mediated spikelets in PV cells
Voltage imaging provided a unique opportunity to analyze the correlated voltage dynamics between PV cells. We recorded pairs of hippocampal PV neurons (Fig. 6a) and calculated the mean self- and cross spike-triggered voltage waveform (STVW). For the cross STVW, we restricted analysis to events where only one cell spiked (spike peaks in the two cells separated by > 10 ms), to avoid spurious contributions from near-coincident spikes. For the Cell 1 → 2 cross-STVW, the Cell 2 voltage showed little depolarization for τ < 0, had a sharp jump near τ = 0, and then relaxed closely following the waveform of Cell 1 for τ > 0 (Fig. 6c). Control experiments using a non-cell region 2 confirmed that the signals were not due to scattered fluorescence from Cell 1 (Fig. 6b, c).
Figure 6. Detection of electric coupling between hippocampal PV cells.
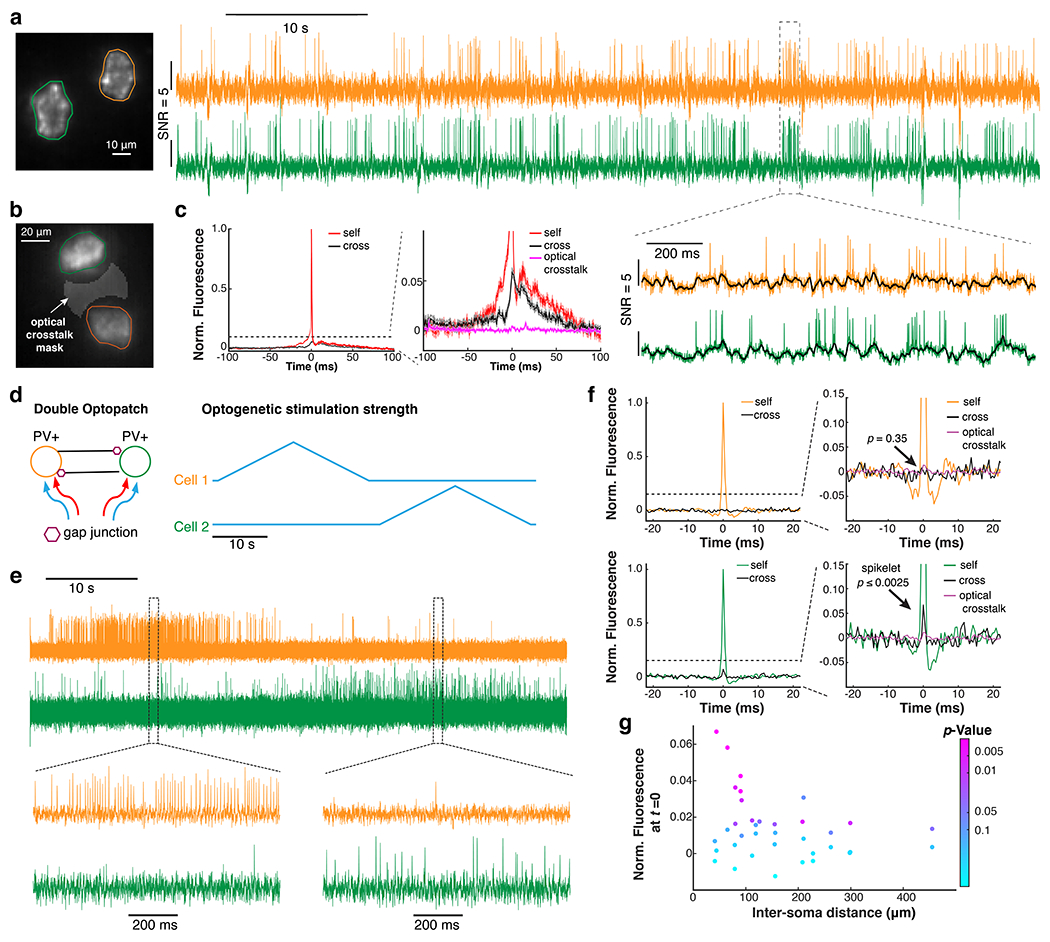
a. Simultaneous recording of spontaneous dynamics in two PV neurons in a lightly anesthetized mouse. To accommodate two PV neurons in the 2-kHz recording zone of the sCMOS camera, the recording was performed with a 10x objective (NA = 0.6; n = 31 pairs from 2 animals). b. Fluorescence traces were extracted from cell masks and from an intervening mask to characterize optical crosstalk. c. Self- and cross spike-triggered voltage waveform for events where the spike maxima in each cell were separated by > 10 ms (n = 31 pairs from 2 animals). d. Double Optopatch experiment to probe gap junction connections between PV cells. e. Example fluorescence traces of the double Optopatch experiment. f. In a pair of PV cells 44 μm apart, a gap-junction-mediated spikelet was observed in the cross-STVW in one cell but not the other. See Methods for definition of p-value. g. Cross-STVW fluorescence at t = 0 (normalized to the post-synaptic spike height) vs. inter-soma distance (n = 19 pairs from 5 animals). The color coding indicates the p-value.
The appearance of a low-pass-filtered copy of the Cell 1 waveform in Cell 2, even when Cell 2 did not spike, suggested gap junction-mediated coupling. However, there remained a possibility that the cross-STVW waveform had a contribution from shared synaptic inputs. We therefore used optogenetic stimulation to trigger spikes alternately in each cell, and recorded the spiking and subthreshold dynamics in both (Fig. 6d–g, Extended Data Fig. 10). Since the presynaptic spike times were independent of subthreshold dynamics, this approach eliminated any possible contribution of shared synaptic inputs to the cross-STVWs.
We calculated the self- and cross-STVWs in both directions for 19 PV pairs with inter-soma distances from 41 to 455 μm (164 ± 108 μm, mean ± S.D., Fig. 6g). Among the pairs separated by < 100 μm we observed a subset (5 of 7 pairs) with statistically significant spikelets (p < 0.05; amplitudes greater than 2% of the action potential amplitude), with an average amplitude of 4.0 ± 1.7% (mean ± S.D., Methods). Of these five pairs, two pairs had reciprocal connections and three pairs were unidirectional. We did not observe any such spikelets for pairs separated by > 100 μm. These results are consistent with in vivo dual patch clamp recordings of gap junction-coupled cerebellar Golgi cells 51 and support the interpretation that short-range gap junctional coupling was present among a subset of the hippocampal PV cells.
Discussion
Pooled screens offer the practical advantages of lower cost and higher throughput compared to arrayed screens 6–11, 35, 52, and are robust to artifacts from well-to-well variability 53. However, pooled screens can be sensitive to spurious outliers if only a small number of cells are selected. We previously developed a phototagging technique (“Photostick”) 54, in which a small number of cells in the pooled library were photocrosslinked to the dish and later retrieved with pipette aspiration. This approach was suitable for screening for qualitatively distinct phenotypes, such a nonlinear photoactivation 8. In contrast, to screen for quantitative improvements in a continuously variable phenotype, much larger-scale selections were needed. Several photoselection-based pooled screening strategies have been demonstrated 6, 7, 9, 10. Our work demonstrated the feasibility of pooled screening in directed evolution of biosensors along multiple dimensions. Here the wide-field optics of the Photopick system enabled multi-fold coverage of the mutant library, while targeted photoconversion achieved a high photoselection efficiency and fidelity. High-throughput sequencing was a key tool for genotype enrichment analysis. In this application, a practical challenge was that the screened cells needed to be embedded in a confluent monolayer to support collective action potentials, which precluded aspiration-based mechanical separation 8, 35, 55.
Similar photoselection methodology could be used to optimize fluorescent sensors of other modalities or enable cell tagging in vivo 56. To achieve spectral compatibility with blue or green reporters, one could mark target cells with a dark-to-green (e.g., PA-GFP) or dark-to-red (e.g., PA-mCherry) FP instead of the green-to-red mEos4a FP we used here. The Photopick platform is in principle compatible with any imaging-based assay of cellular structure or dynamics. Potential applications include forward genetic screens, e.g., for genes that affect cell migration, chemotaxis or responses to mechanical or metabolic perturbations.
In prior GEVI engineering efforts, mutations were introduced randomly into the scaffold 26, 35, or targeted to specific regions 5, 19, 22, 30 or “hotspots” 24. To our surprise, most of the newly identified mutations in QuasAr6 were located on the protein surface, likely indicative of the critical importance of membrane trafficking. This observation may be relevant to the engineering of other sensors based on transmembrane scaffolds. An internal mutation arose at R237, which is homologous to bacteriorhodopsin (BR) R227. BR R227 is a key component of the intramolecular proton uptake pathway 57, 58. This role in connecting the titratable Schiff base to the cytoplasm could potentially explain why mutation of this residue to neutral isoleucine accelerated voltage-sensing kinetics in QuasAr6b.
Our data highlight the interdependence of SNR and sensor kinetics as well as the importance of cell type- and system-specific characterization. In the fast-spiking PV neurons, the faster sensor QuasAr6b exhibited better SNR, despite its lower steady-state voltage sensitivity, compared to Archon1. In NDNF cells and cultured neurons, QuasAr6a with its larger voltage sensitivity and slower kinetics outperformed QuasAr6b. Both GEVIs remain substantially dimmer than other far-red fluorescent indicators, limiting the total number of neurons that can be recorded simultaneously in vivo. Development of brighter far-red GEVIs, based either on Arch or on other mechanisms remains an important goal.
For functional connectivity mapping in mammalian brain, targeted perturbations can distinguish genuine connections from effects of shared inputs. Multi-cell patch clamp measurements in vivo are technically demanding 47, 51, 59, 60. All-optical electrophysiology provides an alternate approach, but requires voltage imaging and optogenetic manipulation to be crosstalk-free. Since all known channelrhodopsins have substantial photocurrents in the blue part of the spectrum, crosstalk is minimized by combining a blue-shifted channelrhodopsin with a voltage indicator excited at 590 nm or longer. Thus far, only the combination of far-red Arch-derived GEVIs with blue-shifted channelrhodopsins has demonstrated sufficient spectral orthogonality to meet this standard. In our proof-of-concept all-optical connectivity mapping experiments, both voltage imaging and optogenetic stimulation were integral for probing chemical and electric synapses. For studies of spontaneous network dynamics it will be important to extend the measurements to awake animals. Together, QuasAr6a and QuasAr6b, with their improved in vivo performance and spectral compatibility with blue-shifted channelrhodopsins, open many possibilities for understanding the relation between neural circuitry and network dynamics.
METHODS
DNA constructs
Constructs (Supplementary Table 1) were generated using the standard molecular cloning techniques. All the new constructs and their sequences are available from Addgene.
Virus packaging
All the lentivirus preparations were made in house using the second-generation lentivirus packaging system (Supplementary Methods). The high-titer QuasAr6a and Optopatch AAV2/9 viruses were obtained from the Janelia Vector Core or packaged in house (Supplementary Table 1). AAV2/9.hSyn::Cre.WPRE was obtained from UPenn Vector Core.
Engineering monoclonal spiking HEKs
The CheRiff-CFP+ tet-on spiking HEK cells express NaV1.5, rtTA3, CheRiff-CFP constitutively, as well as Kir2.1-CFP under a tetracycline-inducible promoter CMVtight (Supplementary Methods). After monoclonal selection, the CheRiff-CFP+ spiking HEK clones were optically screened for spiking behavior. The spikes were evoked with optogenetic stimulation (exc. 490 nm) and visualized using a voltage-sensitive dye (BeRST, exc. 635 nm) 33. To obtain consistent experimental results, we only used low passage-number cells and kept a master plate free of doxycycline.
Photopick screening of Arch-based GEVIs
The Photopick system was upgraded from a previously reported optical system 28 (Supplementary Methods). Before each screening experiment, the DMD projection of 405-nm laser was recalibrated (Supplementary Methods).
Random mutations were introduced into the Archon1 opsin sequence through error-prone PCR. Single copies of the mutant GEVI were stably integrated into the CheRiff-CFP+ tet-on spiking HEK cells via low-titer lentivirus infection (Supplementary Methods). The library cells were mixed with CheRiff-CFP+ spiking HEK cells (spacer cells) at a ratio of 1:10. The mixed cells were plated in glass-bottomed dishes (Cellvis) homogenously (500k cells in a 14-mm well). The cells were allowed to grow for 40-50 hours in Dox+ medium to form a monolayer. Before imaging, the medium was replaced with the extracellular (XC) buffer containing 125 mM NaCl, 2.5 mM KCl, 3 mM CaCl2, 1 mM MgCl2, 15 mM HEPES, 30 mM glucose (pH 7.3).
In the 2.3 mm × 2.3 mm FOV (500×500-pixel), first, an mEos4a-channel image was taken (exc. 490-nm LED, Thorlabs, M490L3; em. GFP-emission filter, 540/50 Semrock FF01-540/50). Next, the spiking HEK cell monolayer was broadly stimulated with the 490-nm pulses (2 mW/mm2, 10 ms) from the top, and the voltage responses to optogenetic stimulations was recorded under the pseudo-TIRF configuration (index-matching immersion oil Olympus, Z-81114; exc. 635-nm laser, 100 W/cm2; em. Arch-emission filter, long-pass 700 nm; sampling rate:100 Hz). Each experiment run consisted of 8 repeats (5 blue light pulses with the red laser was on, followed by with 5 blue light pulses with red laser off).
The 500 × 500-pixel FOV was segmented based on the mEOS-channel (exc. 490-nm LED) image using standard Matlab image processing steps (Supplementary Methods). The Arch-channel movie (8 consecutive repeats) was first averaged over time, and then corrected for blue-light crosstalk (via the time-average of the red laser-off epoch) and red-light excitation profile, and corrected for background fluorescence via spatial filtering (Matlab imtophat). The average intensity traces were extracted from each ROI and corrected for photobleaching. The baseline fluorescence intensity was assigned as F0. The averaged baseline-to-peak difference was assigned as ΔF. We used as a proxy of shot-noise limited SNR.
A DMD mask was generated to illuminate the selected ROIs for phototagging (exc 405 nm, 40 mW/cm2, 10 min). Then the dish was moved to screen the next FOV. In a typical experimental run, the spiking HEK cells responded robustly to optogenetic stimulation throughout a time course over 6 hours. 20 - 25 FOVs were scanned to achieve good coverage of the entire dish, and each FOV contained 2,000 - 4,000 ROIs. From a single dish, 30,000 to 50,000 cells were scanned.
The cells were then trypsinized (1% trypsin, 5 min at 37 °C) to lift them from the dish and carefully transferred into a 15 mL Falcon tube. The cells were gently centrifuged to remove the trypsin and washed once with XC buffer. Then the cells were resuspended in the XC buffer and subjected to FACS (Supplementary Figure 1 and Methods) within one hour. The photoconverted cells were collected into fresh DMEM10 medium and cultured under the standard HEK cell culture condition to expand the population.
In each round of enrichment, 2 dishes (approx. 90k library cells) were screened. 7 - 10 days later, the enriched library from the 2 dishes were combined at a proportion corresponding to the number of originally collected cells and subjected to the next round of enrichment. The remaining library cells were preserved in liquid nitrogen for sequencing. The frequencies of mutations were analyzed with Illumina sequencing (Supplementary Methods).
Characterization of single mutants in HEK293T cells
The HEK293T cells expressing WT Archon1 or the single mutants were characterized on the ultra-widefield microscope (FCitrine: exc: 490 nm; GFP emission filter; FArch: exc: 635 nm; Cy5 emission filter). The cells whose brightness were outliers (more than three standard deviations from the mean) in the Citrine channel or in the Arch channel were removed in the violin plot.
Concurrent imaging and electrophysiology of HEK293T cells
The GEVIs (Archon1, QuasAr6a, QuasAr6b) were cloned into the lentiviral FCMV vector (HT63, HT103, HT110). HEK cells we infected at a low-titer (MOI < 0.1) and purified by FACS.
All imaging and electrophysiology experiments were performed in XC buffer. Concurrent whole-cell patch-clamp and high-magnification fluorescence recordings were acquired on a custom-built, dual-view, inverted epifluorescence microscope equipped with the electrophysiology module described before 16. Filamented glass micropipettes were pulled to a tip resistance of 5 - 8 MΩ, and filled with internal solution containing (in mM): 125 potassium gluconate, 8 NaCl, 0.6 MgCl2, 0.1 CaCl2, 1 EGTA, 10 HEPES, 4 Mg-ATP and 0.4 Na-GTP (pH 7.3); adjusted to 295 mOsm with sucrose. Whole-cell patch clamp recordings were performed with a MultiClamp 700B amplifier (Molecular Devices), filtered at 2 kHz with the internal Bessel filter and digitized with a National Instruments PCIE-6323 acquisition board at 10 kHz.
The GEVI fluorescence was excited by a 635-nm laser (420 W/cm2 unless otherwise indicated) filtered with a dichroic (Semrock; FF640-FDi01-25×36) and a Cy5-longpass filter (708/75, and imaged with a sCMOS camera (Hamamatsu, ORCA-Flash 4.0). The citrine fluorescence was excited with 488 nm laser (100 - 200 mW/cm2 unless otherwise indicated), filtered with a GFP filter (Semrock 525/30), and imaged with an EMCCD camera (Andor iXonEM+ DU-897E). All the fluorescence recordings in Extended Data Fig. 4 except for Panel d,e, were performed at room temperature with a high-magnification water-immersion objective (Olympus, 60×, NA 1.2). For photocurrent measurement, higher intensities at 635 nm (1500 W/cm2) and 488 nm (124 W/cm2) were used to enhance any potential photocurrents. For the kinetics measurements (Extended Data Fig. 4d,e), the glass-bottomed culture dish was maintained at 30 °C with a temperature controller (Warner Instruments, TC-344B). An air objective (Olympus, 20×, NA 0.8; excitation intensity of 635-nm laser: 330 W/cm2) was used instead to reduce heat dissipation to the objective.
The Arch fluorescence recordings for voltage sensitivity measurements and for kinetics measurements were acquired at a frame rate of 996 Hz and 2,443 Hz, respectively. In the kinetics measurement, the fluorescence responses from 50 pulses of 100-ms voltage steps (−70 mV to +30 mV, 5 Hz, 50% duty cycle) was averaged for each cell and fitted with a biexponential model to calculate the fast and slow components of the activation and deactivation kinetics.
High-throughput imaging of hippocampal neurons
Primary E18 rat hippocampal neurons (21k/cm2; dissociated from fresh, never frozen, BrainBits #SDEHP) were cocultured with primary rat glia (27k/cm2) in custom 96-well plates (ibidi GmbH; low-absorption, low-autofluorescence cyclic olefin copolymer (COC) foil substrate and clear COC walls). To minimize variations between samples, neurons were seeded from a single pool of cells. Lentivirus for Archon1-EGFP, Archon1-Citrine (HT075), QuasAr6b-Citrine (HT111), QuasAr6b-Citrine (HT114) was packaged in parallel under identical conditions. Neurons were transduced after 6 days in culture with 1) 0.33 μL lentivirus encoding CheRiff-EBFP2 driven by the synapsin promoter and 2) varying doses (1.19 μL, 1.78 μL, 2.67 μL, 4 μL, 6 μL, 9 μL) of the voltage sensor variants, also driven by the synapsin promoter. Each condition was replicated in four wells. Three FOVs were measured for each well.
Functional Optopatch imaging was performed after 14 days in culture on the Firefly microscope 65 (see the Supplementary Methods for the detailed imaging and optogenetic stimulation protocol). The imaging system was fully automated and ran with no human intervention. The whole plate was scanned automatically with motorized stages so that the three FOVs within each well were evenly spaced. Focus was also automatically adjusted for each FOV.
Spiking neurons were automatically detected and segmented using a principal component analysis/independent component analysis (PCA/ICA)-based Matlab code described in 39. The algorithm identifies spatially compact sets of pixels (neuron masks) that co-vary in time with action potential positive-going voltage transients. Sources whose action potential height did not exceed the baseline noise by at least a factor of 3 were discarded.
Characterization of QuasAr6a and QuasAr6b in brain slice
For the acute slice experiment (Fig. 3k–p, Extended Data Fig. 7, Supplementary Fig.3), expression was achieved through intracranial injection of QuasAr6a/b AAVs (2~3×10¹² GC/mL Optopatch + 1011 GC/mL hSyn-Cre, diluted in PBS) in P0 wild-type CD1 pups. For intracranial injection, cryo-anaesthetized pups were injected in the left hemisphere, 1.0 mm lateral and 1.0 mm anterior to lambda, starting from a −1.0 mm depth. Diluted virus (40 nL, 60 nL/min) was injected at 0.1 mm increment as the pipette was withdrawn.
Coronal brain slices (350 μm) were prepared from CD1 mice of either sex between postnatal days of P14-P25. Standard whole-cell recording was performed at 34 °C during continuous perfusion at 2 mL/min with ACSF. Cortical L2/3 neurons were visualized using a custom-built microscope described below. The whole-cell internal solution comprised (in mM): 8 NaCl, 130 KMeSO3, 10 HEPES, 5 KCl, 0.5 EGTA, 4 Mg-ATP, 0.3 Na3-GTP. The pH was adjusted to 7.2-7.3 with KOH and osmolarity was set to 290-295 mOsm/L. Borosilicate glass pipettes were used with a resistance of 3-5 MΩ (1B150F-4; WPI). Patch clamp recordings were acquired and filtered at 10 kHz with the internal Bessel filter using a Multiclamp 700B (Molecular Devices) and digitized with DAQ PCIe-6323 (National Instruments) at 100 kHz. During the recording, the perfusion buffer was maintained at 33 - 34 °C with an in-line heater. Following the whole-cell configuration, membrane capacitance, and membrane resistance were estimated under voltage-clamp mode. Measurements of resting membrane potential, rheobase, and spike rates were made under current-clamp mode. Rheobase was defined as the minimum current step (in 500 ms duration) required to elicit at least one spike. Whole-cell recordings were monitored and analyzed in Matlab.
The voltage imaging optical system was originally described in 16 with a few modifications (Supplementary Methods). The Arch-channel fluorescence were acquired with a 25× water immersion objective (Olympus XLPLN25XSVMP2), at 996.3 Hz (1 kHz) with a sCMOS camera (Hamamatsu ORCA-Flash 4.0). The control software generated a metadata output for precise mapping between the amplifier readout and the camera frame counts. In the analysis where the 100-kHz current clamp recordings were downsampled to 1 kHz, the membrane potential readouts within the same camera frame were averaged and aligned with the camera frame timing.
Immunostaining of the slice and confocal imaging
Expression was achieved through intracranial injection of AAVs (5×10¹² GC/mL Optopatch + 1011 GC/mL hSyn-Cre) in P0 - P2 wild-type C57BL/6J pups. Coronal slices were prepared with the injected pups 21 days after virus injection. The slices were fixed in 1% paraformaldehyde for 3 - 4 hours and immunostained to visualize the HA tag (primary antibody: HA Tag recombinant rabbit monoclonal antibody, ThermoFisher, RM305, 2,000× dilution; second antibody: goat anti-Rabbit IgG (H+L) cross-adsorbed secondary antibody conjugated with Cyanine5, ThermoFisher, A10523, 500× dilution). The mounted slices (VECTASHIELD® Antifade Mounting Medium H-1000, Vectorlabs, H-1000-10) were imaged on LSM880 Airyscan (exc. 488 nm for EGFP; exc. 635 nm for Cy5).
In vivo voltage imaging
The cranial window surgery for imaging L1 cortex and hippocampus CA1 was based on previously published protocols 16, 49, 66 (Supplementary Methods). The imaging set-up was originally described in 20 with a few modifications (Supplementary Methods).
Head-fixed animals were imaged in various degrees of anesthesia or full wakefulness. For imaging experiments under deep anesthesia, 1 - 1.5% isoflurane was supplied, and the dose was adjusted throughout the imaging session to maintain a stable breathing rate. For imaging experiments under light anesthesia, animals were first administrated with chlorprothixene (0.2 mg/ml, 5 μL/g weight mouse). In the imaging session, 0.4 - 0.7% isoflurane was supplied to keep the animal in a state of semi-wakefulness, with occasional body movements. In all experiments involving anesthesia, the animal was kept on a heating pad (WPI, ATC2000) to maintain stable body temperature at 37 °C, and their eyes were kept moist using ophthalmic eye ointment. A typical imaging session lasted 1 - 2 h, after which the animal generally recovered within 5 min. For imaging experiments under full wakefulness, the animal was first habituated to head restraint in a body tube prior to the imaging sessions, and no extra heating was necessary.
Imaging was performed with a 25× water immersion objective (Olympus XLPLN25XWMP2, 2-mm working distance, NA = 1.05), or a 10× water immersion objective (Olympus XLPLN10XSVMP, 8-mm working distance, NA = 0.6). To ensure stable water interface between the window and the 10× objective, a 3D-printed adapter hat was attached to the headplate temporarily with vacuum grease during the imaging session.
For voltage imaging, red laser excitation was targeted to the cell membrane or whole soma with holographic optics (see Supplementary Table 3 for the light intensity, patterning method and frame rate). In our experiences, membrane-focal illumination gives better SNR when a high-NA objective (e.g., 25x, NA=1.05) was used and the cells show little motion. When the cells were experiencing stronger movement, soma-targeted illumination helped to reduce motion artifacts.
Optogenetic stimulation with patterned blue light
For optogenetic stimulation, the DMD patterned the blue light to target the soma. The structural image in the GFP channel was excited with a low level of blue light (< 1 mW/mm2) and imaged with a GFP emission filter. The pixel bitmap containing the ROI masks was created based on the GFP channel image. When the experiments required the blue light intensity to change globally for all the ROIs, the blue intensity was modulated with an AOTF upstream of the DMD, with a range from 0 to 25 mW/mm2. When the experiments involved different blue light waveforms for different ROIs (e.g., experiments in Fig. 5), the intensity was controlled by randomly switching on a fraction of pixels within the ROI. The pre-defined sequence of pixel bitmaps was loaded into the on-board RAM on the DMD and timed with digital pulses sent from DAQ to the DMD.
Double Optopatch in NDNF+ cells
For the double Optopatch experiments on NDNF+ neurons, the blue light intensity was modulated by randomly switching on a fraction of DMD pixels within each cell mask. For each ramp stimulation, a series of DMD masks were generated and displayed on the DMD as a movie. By varying the fractions of “on” pixels independently for each cell mask, different optogenetic stimulation waveforms and strengths could be achieved for each cell.
Before the two-way inhibitory connection test, the two optically targeted cells were sequentially stimulated with varying blue light intensities (upward linear ramp followed by downward linear ramp, maximal intensity 25 mW/mm2) to ensure both cells responded to the optogenetic activation, and the stimulation was specific to the intended cell. Due to possible light scatter from one-photon optogenetic activation, we avoided closely spaced cell pairs (< 40 μm). Because both the intrinsic firing pattern and the maximal firing rate of NDNF+ cells, as well as the expression level of somCheRiff could be variable from one cell to another, we typically adjusted the strength of optogenetic stimulation to achieve a maximal spiking rate in the “presynaptic” cell of up to 50 Hz at the maximum of the ramp stimulation. The strength of optogenetic stimulation for the “postsynaptic” cell was set to be approximately half of its maximal spike rate.
Data analysis
Data were analyzed and plotted with homemade code written in MATLAB. The detailed methods are described in the Supplementary Information, which includes the following sections: 1. Extracting the voltage-sensitive fluorescence from in vitro and ex vivo imaging; 2. Extracting the voltage-sensitive fluorescence from in vivo imaging; 3. Spike detection and trace normalization; 4. Calculation of spike SNRs and waveforms; 5. Estimation of spike rate with Bayesian Adaptive Kernel Smoother; 5. Test for bias for or against reciprocal connections among NDNF cells; 6. Estimate of optical crosstalk between PV pairs; 7. Quantifying the gap junction-induced spikelet among PV cells.
Statistics
Statistical tests were performed in MATLAB (MathWorks). For two-sample comparisons of a single variable, a two-tailed Student’s t-test was used when the sample size was > 50 (high-throughput Optopatch in cultured neurons). For datasets where the sample size was small (n < 40) or showed non-Gaussian distribution, Two-sided Wilcoxon rank-sum test was used. When calculating the in vivo GEVI metrics (Fig. 4, Extended Data Fig. 8), outliers (value that is more than three scaled median absolute deviations) were excluded. For the hippocampal PV recordings, the SNR were calculated separately for cells imaged with the 25x or the 10x objectives, while for the optical spike widths, the two sets of data were pooled together. The in vivo experiments were not randomized, and the investigators were not blinded to the experimental conditions. Sample size was as large as practical. Recordings of non-spiking neurons were excluded from analysis.
Extended Data
Extended Data Fig. 1. Calibration of Photopick, an imaging-based method for isolating mammalian cells from pooled culture (Related to Fig. 1).
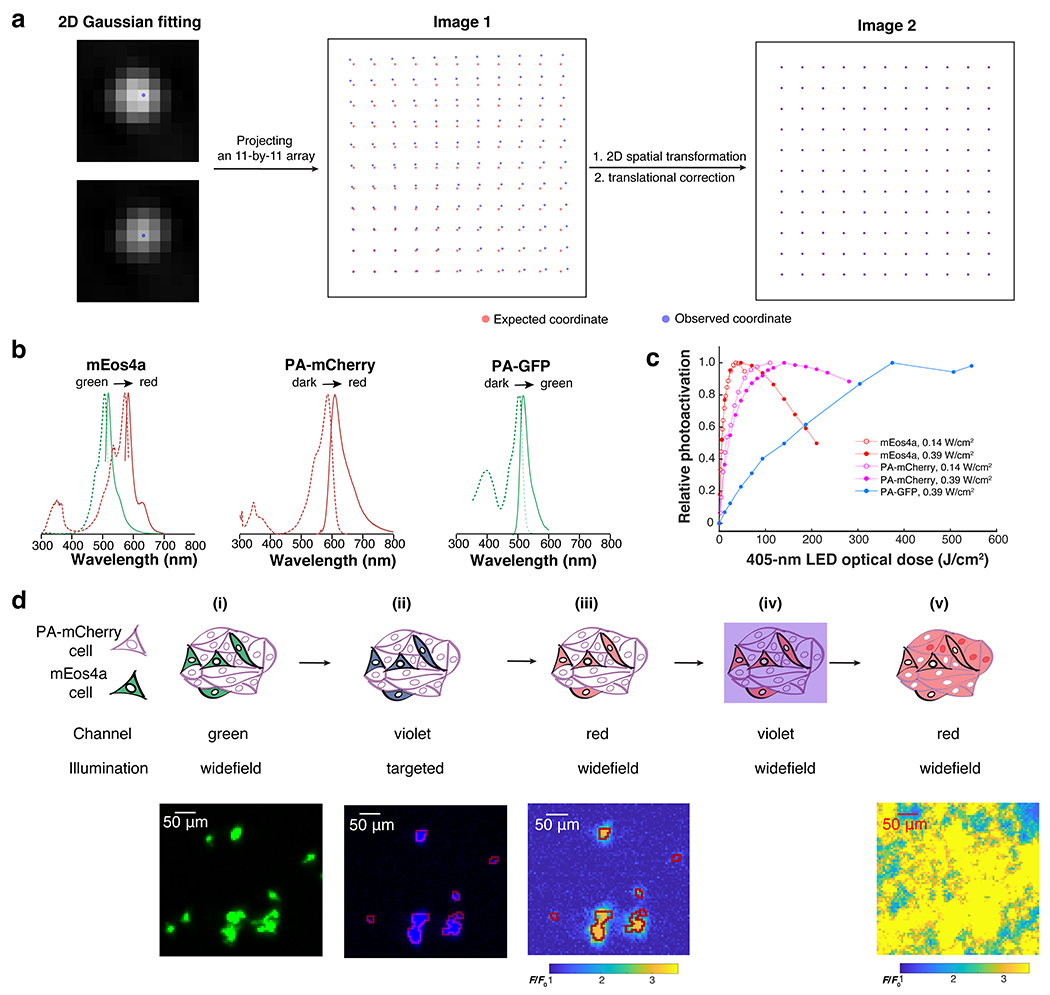
a. Procedure for registering the DMD and camera pixels. An 11 x 11 grid of spots was projected onto a homogeneous exposure target. The observed locations in the camera were used to develop a piecewise-linear transformation to map DMD pixels onto camera pixels. In this example, the registration reduced the average projection error from 11.6 pixels to 0.22 pixels. b. Fluorescence excitation and emission spectra of three phototaggable FPs, PA-GFP, PA-mCherry, and mEos4a. For mEos4a, the spectra are given in the pre-activation state (green) and post-activation state (red). For the other FPs, the activated spectra are shown. c. Phototransformation efficiency vs. optical dose of 405-nm LED light. The decreased signal under prolonged illumination is due to photobleaching. d. Selective phototagging of mEos4a+ cells embedded in PA-mCherry+ cells (mEos4a+:PA-mCherry+ = 1:20; n = 1 trial). Based on the green channel image (i), a mEOS4a mask was created for targeted photoconversion of mEos4a with violet (ii). The red channel image shows that the phototagging was highly specific (iii). The monolayer of cells was then broadly illuminated with violet light (iv) to drive the photoactivation of PA-mCherry+ cells (v). Targeted violet illumination of the mEos4+ cells resulted in selective phototagging of mEos4a+ cells but not surrounding PA-mCherry+ cells.
Extended Data Fig. 2. Video-based pooled screen for mutations that enhance the performance of Arch-derived GEVIs (Related to Fig. 2).
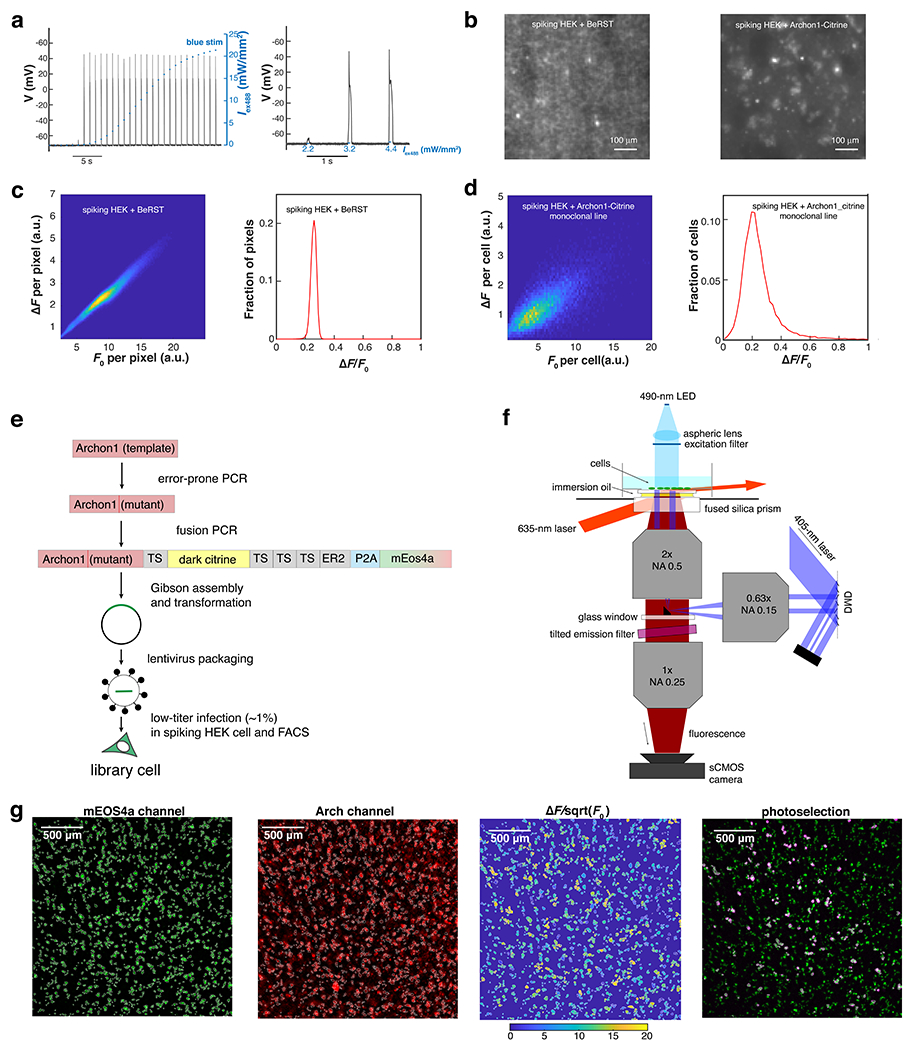
a. Current clamp measurement of membrane potential in spiking HEK cells reveals “all-or-none” spiking in response to increasing optogenetic stimulation (n = 2 trials; exc. 488 nm). Left: membrane potential in response to optical stimuli of increasing strength (0 - 22 mW/mm2). Right: enlarged view showing the threshold transition. b. Fluorescence image (exc. 635 nm) of spiking HEK cell monolayer stained with BeRST1 (left) or expressing Archon1-Citrine (right). In the Archon1-Citrine image, the presence of the spacer cells (spiking HEK cells that did not express Archon1-Citrine) enabled individual cells to be resolved. c. Distribution of membrane potential changes in a spiking HEK cell monolayer, reported via imaging of a voltage-sensitive dye BeRST1, plotted for each pixel. Left: heatmap of ΔF vs. F0 for all pixels in a 2.3×2.3 mm FOV (500×500 pixels). Right: histogram of ΔF/F0. The distribution had a fractional width (S.D./mean) of 8% (mean 0.25, S.D. 0.02; 99th percentile: 0.29). d. Distribution of Archon1 baseline brightness (F0) and voltage sensitivity (ΔF/F0) in a monoclonal Archon1-expressing spiking HEK cell monolayer, plotted for each cell (n = 20900 cells). Left: heatmap of ΔF vs. F0 for all cells in a 2.3 × 2.3 mm FOV (500×500-pixels). Right: histogram of ΔF/F0. The distribution had a fractional width (S.D./mean) of 43% (mean 0.23, S.D. 0.10; 99th percentile: 0.54), substantially broader than the distribution for BeRST1. e. Work-flow for the generation of the library cells. f. Optical system for video-based pooled screening. g. Image analysis for a representative FOV (the same as shown in Fig. 2e,f). The example was, from left to right: 1) ROIs generated by “Watershed” image segmentation in the mEos4a channel (exc: 490 nm; EGFP emission filter). 2) Baseline fluorescence (F0) image in the Arch channel (exc: 635 nm; Arch emission filter). 3) Heatmap of for individual ROIs. Here is used as a proxy for shot noise-limited for SNR. 4) Overlay of the patterned violet light (pseudo-color red; exc. 405 nm; CFP emission filter) and mEos4a image (exc: 490 nm; EGFP emission filter).
Extended Data Fig. 3. Engineering QuasAr6a and QuasAr6b (Related to Fig. 2).
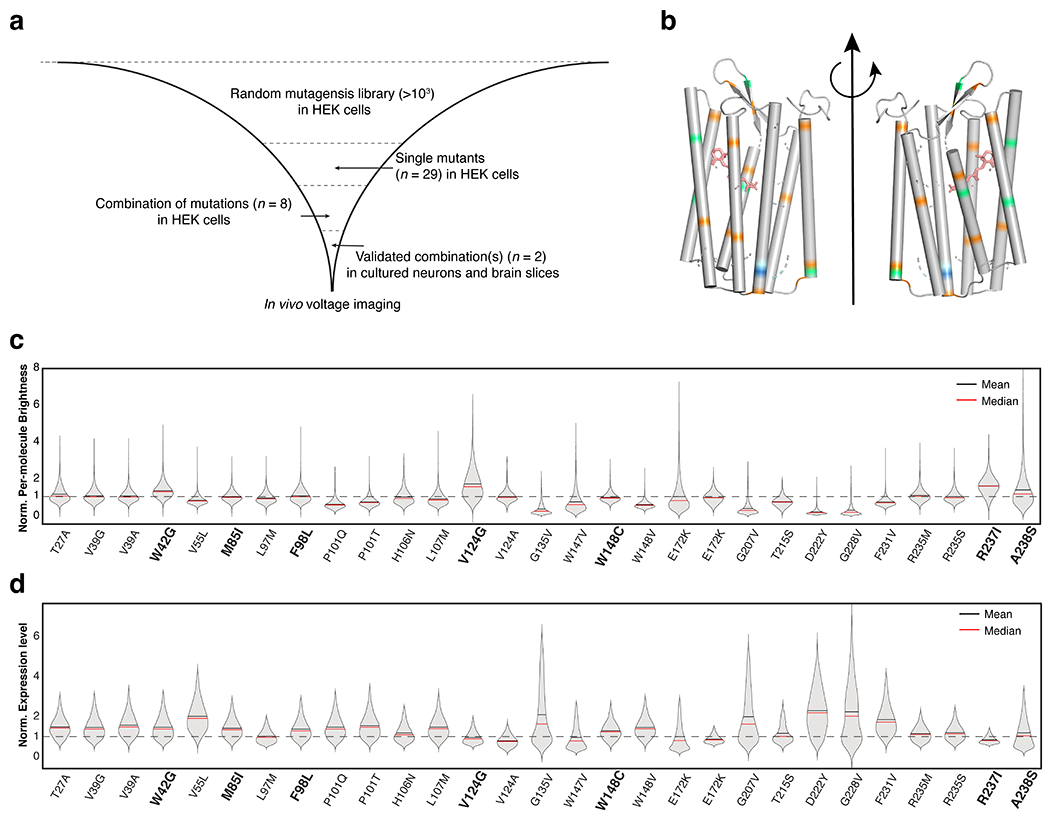
a. Pipeline for engineering improved GEVIs. b. Comparison of the previously reported mutations (orange),26,34 and newly identified mutations in this study (lime-green, pale cyan and blue assigned in accordance with Fig. 3a). c. Violin plot for the per-molecule brightness (FArch/FCitrine) of single mutants expressed in HEK cells. The per-molecule brightness was normalized by the average per-molecule brightness of Archon1-Citrine in HEK cells. The residues selected for engineering QuasAr6a/b are shown in bold. d. Violin plot for the expression level (FCitrine) of single mutants expressed in in HEK cells. The values were normalized to the average expression level of Archon1-Citrine in HEK cells.
Extended Data Fig. 4. Characterization of QuasAr6a-Citrine and QuasAr6b-Citrine in HEK293T cells (Related to Fig. 3).
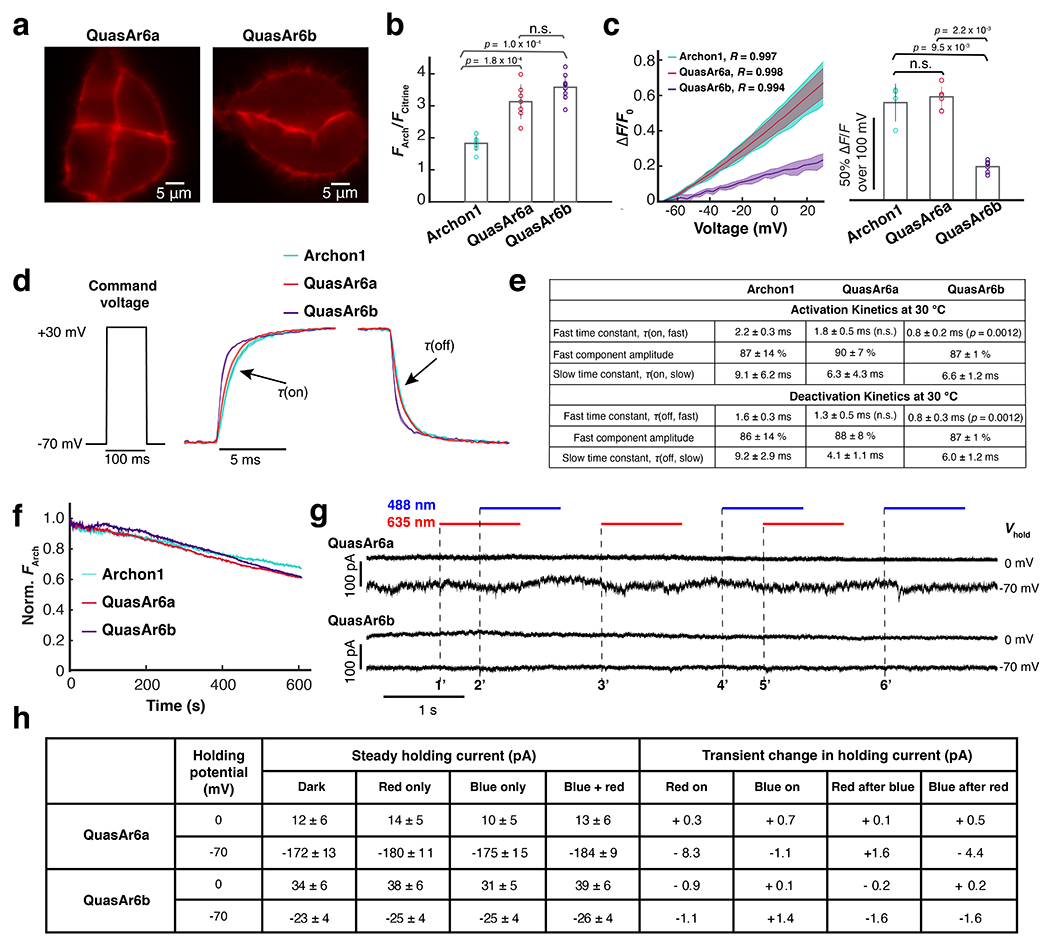
a. Arch-channel (exc: 635 nm, em: 670 – 746 nm) fluorescence images of QuasAr6a-Citrine and QuasAr6b-Citrine expressed in HEK cells (n > 20 cells for each construct). b. Relative brightness per molecule of Archon1-Citrine (n = 10 cells), QuasAr6a-Citrine (n = 7 cells), and QuasAr6b-Citrine (n = 10 cells) measured as a ratio of whole-cell FArch to FCitrine. n.s. not significant, p > 0.05; ***p : 0.0001~ 0.001 (two-sided Wilcoxon rank-sum test). The brightness per molecule was calculated as the ratio of Arch-channel fluorescence (exc. 635 nm; 420 W/cm2) to Citrine-channel fluorescence (exc. 488 nm; 0.1 W/cm2). c. Voltage sensitivity measured by concurrent voltage clamp and fluorescence in HEK cells. Left: Fractional fluorescence change vs. membrane voltage; shading: S.D.. Right: Voltage sensitivity (ΔF/F per 100 mV: Archon1-Citrine, n = 4 cells; QuasAr6a-Citrine, n = 5 cells; QuasAr6b-Citrine, n = 6 cells). n.s. not significant, p > 0.05; **p: 0.01 ~ 0.05 (two-sided Wilcoxon rank-sum test). Error bars mean ± S.D.. d. Voltage step-response kinetics measured by recording the average fluorescence change during a 100-ms voltage step from −70 mV to +30 mV (Archon1-Citrine, n = 6 cells; QuasAr6a-Citrine, n = 7 cells; QuasAr6b-Citrine, n = 7 cells); shading: SEM. Measurements were performed at 30 °C and a frame rate of 2,443 Hz. e. Summary of the step-response kinetic data at 30 °C, fitted with a biexponential model. Compared with Archon1, QuasAr6b showed significant improvement in both activation and deactivation kinetics. **p: 0.01 ~ 0.05 (two-sided Wilcoxon rank-sum test). f. Photobleaching by 635 nm laser (420 W/cm2) over 10 min (n = 2 cells for each construct). All constructs showed < 40% photobleaching over 10 min. S.D. g. Voltage clamp measurement of HEK cells expressing QuasAr6a or QuasAr6b showed negligible photocurrents under either 488 nm, 635 nm or combined illumination at either −70 mV or 0 mV holding potentials (488 nm: 124 W/cm2; 635 nm: 1500 W/cm2). All photocurrents were less than the variability in baseline holding current and were < 10 pA (in most cases < 2 pA). The onsets of red or blue illumination are indicated with dashed lines and numbered sequentially. h. Summary of the photocurrent measurement in g. All values are mean ± S.D.. Transient changes in the holding current were calculated as the differences of the mean holding currents during the 20-ms epochs before and after the light was turned on. Red-on: average of 1’ and 3’; Blue-on: average of 4’ and 6’; Red after blue: 5’; Blue after red: 2’.
Extended Data Fig. 5. Metrics of GEVI performance in high-throughput Optopatch assay in cultured neurons (Related to Fig. 3).
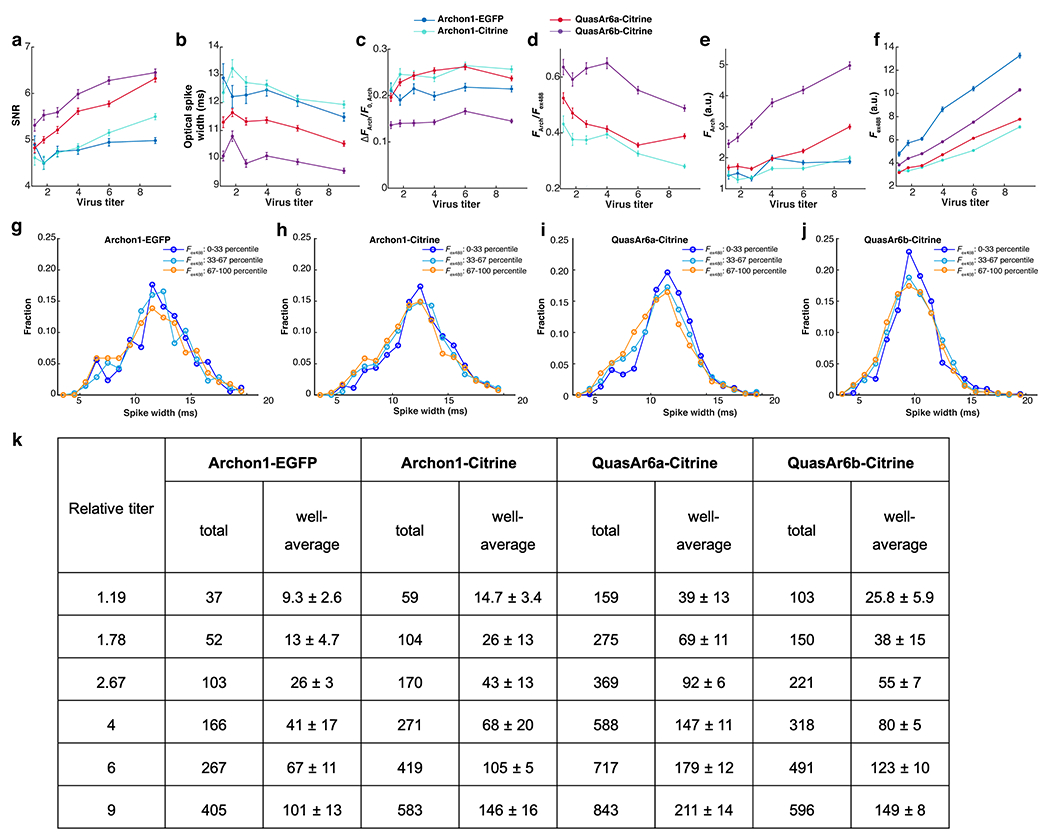
a. SNR: spike height divided by the root mean square (RMS) baseline noise. b. Optical spike width: full width measured at 80% below the action potential peak. Note offset vertical axis. c. ΔFArch/F0, Arch: voltage sensitivity as a ratio of the increase in fluorescence during a spike to the baseline fluorescence. d. FArch/Fex488: per-molecule brightness as a ratio of baseline fluorescence in the Arch channel to the baseline fluorescence in the Citrine channel. The data for Archon1-EGFP were omitted because EGFP and Citrine fluorescence are not directly comparable. e. F0, Arch: baseline fluorescence in the Arch channel (exc: 635 nm). f. Fex488: baseline fluorescence in the Citrine channel (exc: 488 nm). In all measurements, the relative titers (from low to high) were: 1.19, 1.78, 2.67, 4, 6, 9. Each data point represents the average from 4 wells. The intensive properties (b, c, d) are largely insensitive to virus titer while the extensive properties (a, e, f) scale with virus titer. Error bars: SEM. g-j. Distribution of spike widths for neurons with low (0-33 percentile), medium (33-67 percentile) and high (67-100 percentile) expression level (Fex488). The distributions were similar across expression levels, for all GEVIs. k. Cell counts in high-throughput Optopatch assay. The total and well-average (mean ± S.D.) number of optically detected spiking cells, for each combination of GEVI construct and virus titer. At the higher titers, the well-to-well variations in detected cells within a given condition were ~10%, much smaller than the 200 - 300% differences between GEVI variants.
Extended Data Fig. 6. Expression of somQuasAr6a- and somQuasAr6b-based Optopatch in mouse brain (Related to Fig. 3).
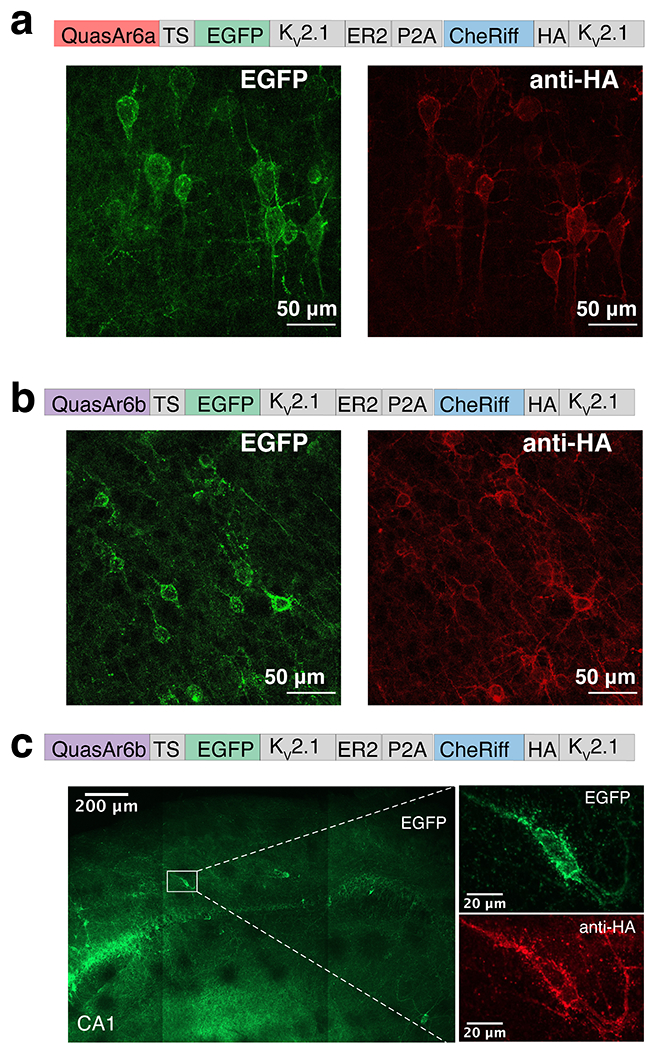
a,b. Confocal images showing bicistronic expression of soma-targeted QuasAr6a-EGFP (somQuasAr6a) in L5 somatosensory cortex or soma-targeted QuasAr6b-EGFP (somQuasAr6b) with somCheRiff-HA in L5 cingulate cortex. The expression of GEVIs was visualized in the EGFP channel and the expression of CheRiff in the Cy5 channel (anti-HA immunostaining). c. Confocal images showing bicistronic expression of soma-targeted QuasAr6b-EGFP (somQuasAr6b) with somCheRiff-HA in hippocampal PV cells in a PV-Cre+ mouse.
Extended Data Fig. 7. Effect of GEVI expression on membrane electrical properties and excitabilities (Related to Fig. 3).
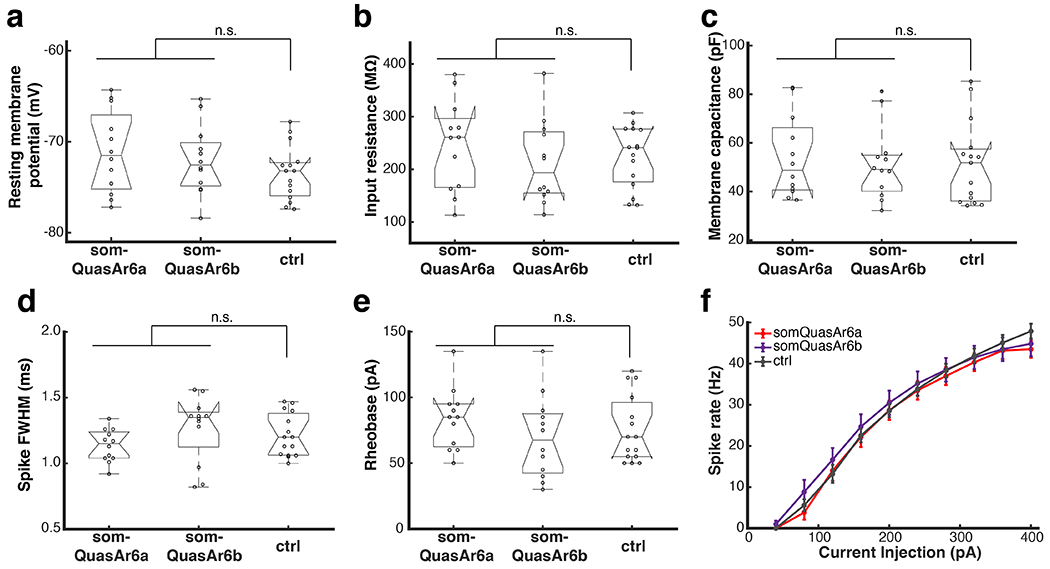
Mouse L2/3 cortical neurons expressing Arch-based GEVIs were measured by patch clamp in acute slices (somQuasAr6a, n = 2 animals, 12 cells; somQuasAr6b, n = 2 animals, 12 cells). Non-expressing cells from the same slices were used as the control (n = 4 animals, 15 cells). Box plots: central mark indicates median, bottom edge 25th percentile, top edge 75th percentile, whiskers most extreme data points excluding outliers, ‘+’ symbol outliers. n.s., not significant, two-sided Wilcoxon rank-sum test. Error bars in g: SEM.
Extended Data Fig. 8. Optopatch in hippocampal PV cells (Related to Fig. 4).
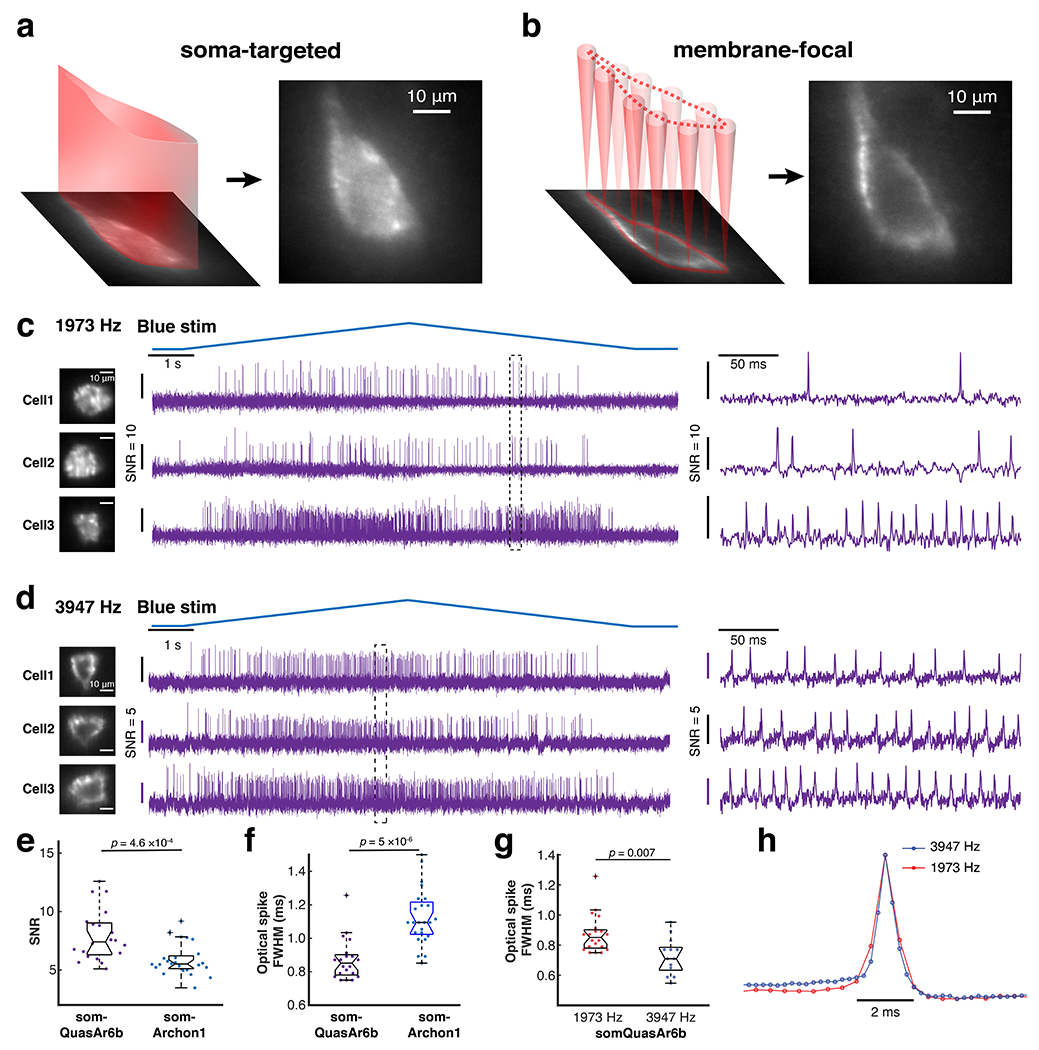
a,b. Two ways of patterning 635-nm light to the cell with a spatial light modulator (SLM). Left: soma-targeted. Right: membrane-focal. The cell shown here was a hippocampal PV neuron (imaged with 25x, NA = 1.05 objective). Compared to whole-soma illumination, membrane-focal illumination provides improved shot-noise-limited SNR but greater sensitivity to motion artifacts. c, d. Representative Optopatch traces of somQuasAr6b+ PV cells, recorded at 2 kHz (1973 Hz) and 4 kHz (3947 Hz) with a 10x objective (NA 0.6). Magnified views of the boxed regions are shown on the right. For the 2 kHz-imaging experiment, soma-targeted illumination was used. For the 4 kHz-imaging experiment, membrane-focal illumination was used. Due to this difference in the optical configuration, the SNRs from these two datasets were not compared in the analysis. e. Comparison of the in vivo SNR of QuasAr6b (n = 20 cells, 3 animals) and Archon1 in PV cells (n = 24 cells, 2 animals), two-sided Wilcoxon rank-sum test. f. Comparison of optical spike full-width at half-maximum (FWHM) of optogenetically triggered spikes in PV cells, imaged with somQuasAr6b and somArchon1 at a 2 kHz frame rate, two-sided Wilcoxon rank-sum test. g. Comparison of optical spike FWHM of optogenetically triggered spikes in PV cells, imaged with somQuasAr6b a 2 kHz (n = 20 cells, 3 animals) and 4 kHz (n = 13 cells, 2 animals) frame rate, two-sided Wilcoxon rank-sum test. h. Spike-triggered average fluorescence waveform of optogenetically trigged spikes recorded with somQuasAr6b a 2 kHz (n = 20 cells, 3 animals) and 4 kHz (n = 13 cells, 2 animals) frame rate.
Extended Data Fig. 9. Photostability of QuasAr6a and QuasAr6b in vivo (Related to Fig. 4).
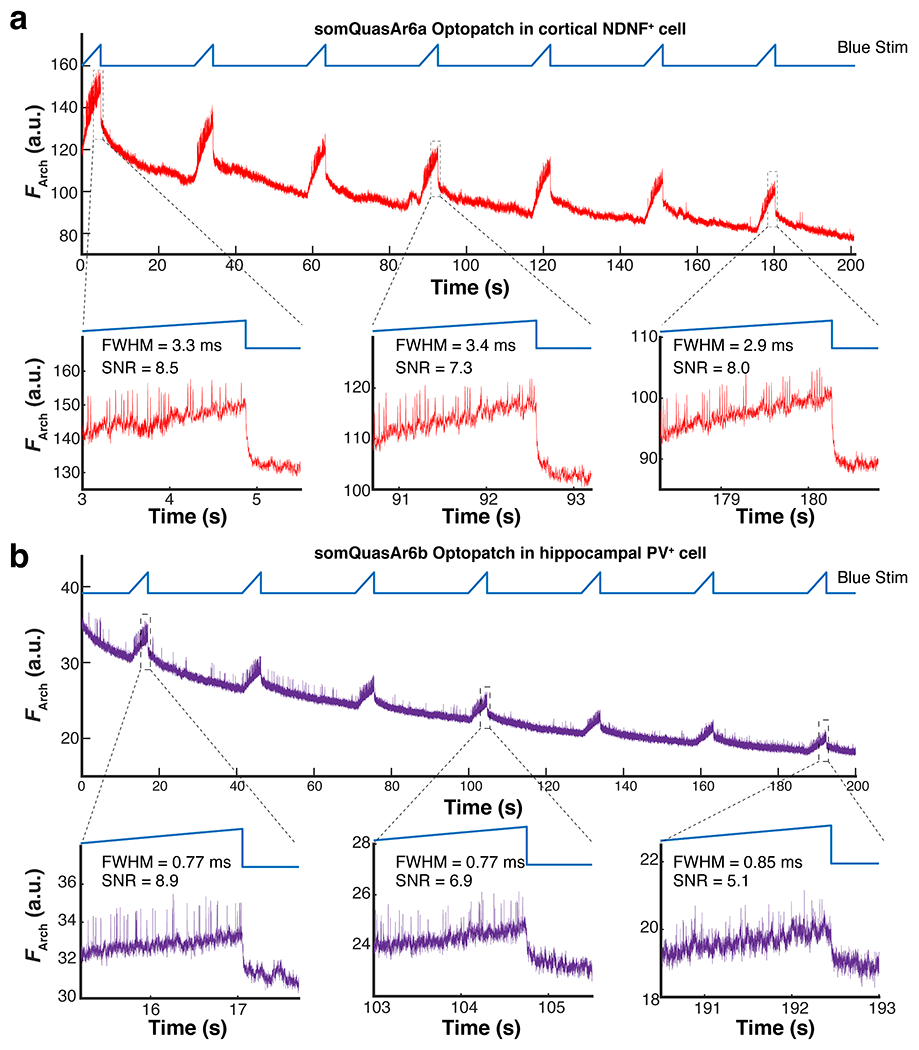
a. Raw Arch-channel fluorescence trace without baseline or photobleaching correction of a Layer 1 NDNF cell (visual cortex) expressing QuasAr6a-based Optopatch, imaged for 200 seconds at 1 kHz (n = 2 cells). The 635-nm power delivered to the cell was 4 mW. b. Raw Arch-channel fluorescence trace of a hippocampal PV cell expressing QuasAr6b-based Optopatch, imaged for 200 seconds at 2 kHz (n = 2 cells). The 635-nm power delivered to the cell was 8 mW. The measurement was done in anesthetized animals. The fluorescence traces were the raw traces directly extracted from cell mask and not corrected for background. The SNR and FWHM was calculated for the all the optogenetically evoked spikes in the magnified region.
Extended Data Fig. 10. Additional examples of electrical coupling between hippocampal PV cells (Related to Fig. 6).
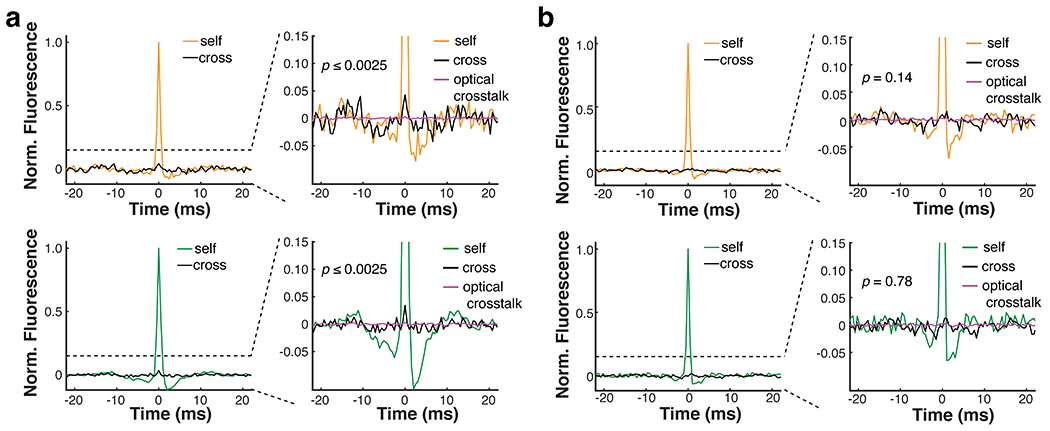
a. An example where gap junction-induced spikelets were detected between PV pairs in both directions. The inter-soma distances were 90 μm. b. An example where no gap junction-induced spikelet was detected between the PV pair (inter-soma distance = 298 μm).
Supplementary Material
Acknowledgments:
We thank B.L. Sabatini and O. Yizhar for advice and discussion; C. Dulac for the PV-Cre mouse line; M. Andermann and J. Fernando for advice on cranial window surgery; T.D. Green, K. Williams, Urs Böhm, A. Preecha, H. Dahche, Y. Adam, and G. Testa-Silva for technical assistance and advice; E. M. Moult for advice on statistics; M.P. Chien for advice on pooled screening; E. Miller for the BeRST1 dye; B. Arnold from Harvard FAS Informatics for assistance with Illumina sequencing data analysis; the Bauer Core Facility at Harvard University for FACS service; the Biopolymers Facility at Harvard Medical School for next-generation sequencing; Harvard Center for Biological Imaging (RRID:SCR_018673) for infrastructure and support on confocal imaging. This work was supported by the Howard Hughes Medical Institute (AEC and KD), NIH grants 1RF1MH117042 and 1R01NS126043 (AEC), a Vannevar Bush Faculty Fellowship N00014-18-1-2859 (AEC), a National Science Foundation QuBBE QLCI grant OMA-2121044 (AEC), a Helen Hay Whitney Fellowship (LZF), and a Merck fellowship from the Life Science Research Foundation (DWC).
Footnotes
Competing interests: A.E.C. is a founder of Q-State Biosciences. A.E.C and H.T. filed a patent on the genetically encoded voltage indicators described in this study. The remaining authors declare no competing interests.
Materials availability: Plasmids encoding QuasAr6a or QuasAr6b are available on Addgene. The tet-on spiking HEK cells are available from ATCC (# crl-3479 and crl-3480).
Data availability:
Data used in the study are available upon reasonable request to A.E.C.
References
- 1.Lin MZ & Schnitzer MJ Genetically encoded indicators of neuronal activity. Nat. Neurosci 19, 1142–1153 (2016). [DOI] [PMC free article] [PubMed] [Google Scholar]
- 2.Yang W & Yuste R In vivo imaging of neural activity. Nat. Methods 14, 349–359 (2017). [DOI] [PMC free article] [PubMed] [Google Scholar]
- 3.Kim TH & Schnitzer MJ Fluorescence imaging of large-scale neural ensemble dynamics. Cell 185, 9–41 (2022). [DOI] [PMC free article] [PubMed] [Google Scholar]
- 4.Tian L, Hires SA, Mao T, Huber D, Chiappe ME, Chalasani SH, … Looger LL Imaging neural activity in worms, flies and mice with improved GCaMP calcium indicators. Nat. Methods 6, 875–881 (2009). [DOI] [PMC free article] [PubMed] [Google Scholar]
- 5.Chen TW, Wardill TJ, Sun Y, Pulver SR, Renninger SL, Baohan A, … Kim DS Ultrasensitive fluorescent proteins for imaging neuronal activity. Nature 499, 295–300 (2013). [DOI] [PMC free article] [PubMed] [Google Scholar]
- 6.Hasle N, Cooke A, Srivatsan S, Huang H, Stephany JJ, Krieger Z, … Fowler DM High-throughput, microscope-based sorting to dissect cellular heterogeneity. Mol. Syst. Biol 16, e9442 (2020). [DOI] [PMC free article] [PubMed] [Google Scholar]
- 7.Lee J, Liu Z, Suzuki PH, Ahrens JF, Lai S, Lu X, … St-Pierre F Versatile phenotype-activated cell sorting. Sci. Adv 6 (2020). [DOI] [PMC free article] [PubMed] [Google Scholar]
- 8.Chien MP, Brinks D, Testa-Silva G, Tian H, Phil Brooks F 3rd, Adam Y, … Cohen AE Photoactivated voltage imaging in tissue with an archaerhodopsin-derived reporter. Sci. Adv 7, eabe3216 (2021). [DOI] [PMC free article] [PubMed] [Google Scholar]
- 9.Kanfer G, Sarraf SA, Maman Y, Baldwin H, Dominguez-Martin E, Johnson KR, … Youle RJ Image-based pooled whole-genome CRISPRi screening for subcellular phenotypes. J. Cell Biol 220, e202006180 (2021). [DOI] [PMC free article] [PubMed] [Google Scholar]
- 10.Yan X, Stuurman N, Ribeiro SA, Tanenbaum ME, Horlbeck MA, Liem CR, … Vale RD High-content imaging-based pooled CRISPR screens in mammalian cells. J. Cell Biol 220 (2021). [DOI] [PMC free article] [PubMed] [Google Scholar]
- 11.Lawson M & Elf J Imaging-based screens of pool-synthesized cell libraries. Nat. Methods 18, 358–365 (2021). [DOI] [PubMed] [Google Scholar]
- 12.Akemann W, Mutoh H, Perron A, Rossier J & Knopfel T Imaging brain electric signals with genetically targeted voltage-sensitive fluorescent proteins. Nat. Methods 7, 643–649 (2010). [DOI] [PubMed] [Google Scholar]
- 13.Knopfel T Genetically encoded optical indicators for the analysis of neuronal circuits. Nat. Rev. Neurosci 13, 687–700 (2012). [DOI] [PubMed] [Google Scholar]
- 14.Gong Y, Huang C, Li JZ, Grewe BF, Zhang Y, Eismann S & Schnitzer MJ High-speed recording of neural spikes in awake mice and flies with a fluorescent voltage sensor. Science 350, 1361–1366 (2015). [DOI] [PMC free article] [PubMed] [Google Scholar]
- 15.Marshall JD, Li JZ, Zhang Y, Gong Y, St-Pierre F, Lin MZ & Schnitzer MJ Cell-Type-Specific Optical Recording of Membrane Voltage Dynamics in Freely Moving Mice. Cell 167, 1650–1662 e1615 (2016). [DOI] [PMC free article] [PubMed] [Google Scholar]
- 16.Adam Y, Kim JJ, Lou S, Zhao Y, Xie ME, Brinks D, … Cohen AE Voltage imaging and optogenetics reveal behaviour-dependent changes in hippocampal dynamics. Nature 569, 413–417 (2019). [DOI] [PMC free article] [PubMed] [Google Scholar]
- 17.Abdelfattah AS, Kawashima T, Singh A, Novak O, Liu H, Shuai Y, … Schreiter ER Bright and photostable chemigenetic indicators for extended in vivo voltage imaging. Science 365, 699–704 (2019). [DOI] [PubMed] [Google Scholar]
- 18.Piatkevich KD, Bensussen S, Tseng HA, Shroff SN, Lopez-Huerta VG, Park D, … Han X Population imaging of neural activity in awake behaving mice. Nature 574, 413–417 (2019). [DOI] [PMC free article] [PubMed] [Google Scholar]
- 19.Villette V, Chavarha M, Dimov IK, Bradley J, Pradhan L, Mathieu B, … Lin MZ Ultrafast Two-Photon Imaging of a High-Gain Voltage Indicator in Awake Behaving Mice. Cell 179, 1590–1608 e1523 (2019). [DOI] [PMC free article] [PubMed] [Google Scholar]
- 20.Fan LZ, Kheifets S, Bohm UL, Wu H, Piatkevich KD, Xie ME, … Cohen AE All-Optical Electrophysiology Reveals the Role of Lateral Inhibition in Sensory Processing in Cortical Layer 1. Cell 180, 521–535 e518 (2020). [DOI] [PMC free article] [PubMed] [Google Scholar]
- 21.Böhm UL, Kimura Y, Kawashima T, Ahrens MB, Higashijima S. i., Engert F & Cohen AE Voltage imaging identifies spinal circuits that modulate locomotor adaptation in zebrafish. Neuron 110, 1211–1222.e1214 (2022). [DOI] [PMC free article] [PubMed] [Google Scholar]
- 22.Kannan M, Vasan G, Haziza S, Huang C, Chrapkiewicz R, Luo J, … Pieribone VA Dual polarity voltage imaging reveals subthreshold dynamics and concurrent spiking patterns of multiple neuron-types. bioRxiv, 2021.2010.2013.463730 (2021). [Google Scholar]
- 23.Evans SW, Shi D, Chavarha M, Plitt MH, Taxidis J, Madruga B, … Lin MZ A positively Tuned Voltage Indicator Reveals Electrical Correlates of Calcium Activity in the Brain. bioRxiv, 2021.2010.2021.465345 (2021). [Google Scholar]
- 24.Abdelfattah AS, Zheng J, Reep D, Tsegaye G, Tsang A, Arthur BJ, … Kolb I Sensitivity optimization of a rhodopsin-based fluorescent voltage indicator. bioRxiv, 2021.2011.2009.467909 (2021). [DOI] [PMC free article] [PubMed] [Google Scholar]
- 25.Herwig L, Rice AJ, Bedbrook CN, Zhang RJK, Lignell A, Cahn JKB, … Arnold FH Directed Evolution of a Bright Near-Infrared Fluorescent Rhodopsin Using a Synthetic Chromophore. Cell Chem. Biol 24, 415–425 (2017). [DOI] [PMC free article] [PubMed] [Google Scholar]
- 26.Hochbaum DR, Zhao Y, Farhi SL, Klapoetke N, Werley CA, Kapoor V, … Cohen AE All-optical electrophysiology in mammalian neurons using engineered microbial rhodopsins. Nat. Methods 11, 825–833 (2014). [DOI] [PMC free article] [PubMed] [Google Scholar]
- 27.Landau AT, Park P, Wong-Campos JD, Tian H, Cohen AE & Sabatini BL Dendritic branch structure compartmentalizes voltage-dependent calcium influx in cortical layer 2/3 pyramidal cells. eLife 11 (2022). [DOI] [PMC free article] [PubMed] [Google Scholar]
- 28.Werley CA, Chien MP & Cohen AE Ultrawidefield microscope for high-speed fluorescence imaging and targeted optogenetic stimulation. Biomed. Opt. Express 8, 5794–5813 (2017). [DOI] [PMC free article] [PubMed] [Google Scholar]
- 29.Paez-Segala MG, Sun MG, Shtengel G, Viswanathan S, Baird MA, Macklin JJ, … Looger LL Fixation-resistant photoactivatable fluorescent proteins for CLEM. Nat. Methods 12, 215–218 (2015). [DOI] [PMC free article] [PubMed] [Google Scholar]
- 30.Kannan M, Vasan G, Huang C, Haziza S, Li JZ, Inan H, … Pieribone VA Fast, in vivo voltage imaging using a red fluorescent indicator. Nat. Methods 15, 1108–1116 (2018). [DOI] [PMC free article] [PubMed] [Google Scholar]
- 31.Park J, Werley CA, Venkatachalam V, Kralj JM, Dib-Hajj SD, Waxman SG & Cohen AE Screening fluorescent voltage indicators with spontaneously spiking HEK cells. PLoS One 8, e85221 (2013). [DOI] [PMC free article] [PubMed] [Google Scholar]
- 32.Zhang H, Reichert E & Cohen AE Optical electrophysiology for probing function and pharmacology of voltage-gated ion channels. eLife 5, e15202 (2016). [DOI] [PMC free article] [PubMed] [Google Scholar]
- 33.Huang YL, Walker AS & Miller EW A Photostable Silicon Rhodamine Platform for Optical Voltage Sensing. J. Am. Chem. Soc 137, 10767–10776 (2015). [DOI] [PMC free article] [PubMed] [Google Scholar]
- 34.McNamara HM, Dodson S, Huang YL, Miller EW, Sandstede B & Cohen AE Geometry-Dependent Arrhythmias in Electrically Excitable Tissues. Cell Syst. 7, 359–370 e356 (2018). [DOI] [PMC free article] [PubMed] [Google Scholar]
- 35.Piatkevich KD, Jung EE, Straub C, Linghu C, Park D, Suk HJ, … Boyden ES A robotic multidimensional directed evolution approach applied to fluorescent voltage reporters. Nat. Chem. Biol 14, 352–360 (2018). [DOI] [PMC free article] [PubMed] [Google Scholar]
- 36.Maclaurin D, Venkatachalam V, Lee H & Cohen AE Mechanism of voltage-sensitive fluorescence in a microbial rhodopsin. Proc. Natl. Acad. Sci. USA 110, 5939–5944 (2013). [DOI] [PMC free article] [PubMed] [Google Scholar]
- 37.Penzkofer A, Silapetere A & Hegemann P Photocycle Dynamics of the Archaerhodopsin 3 Based Fluorescent Voltage Sensor QuasAr1. Int. J. Mol. Sci 21 (2019). [DOI] [PMC free article] [PubMed] [Google Scholar]
- 38.Penzkofer A, Silapetere A & Hegemann P Photocycle dynamics of the Archaerhodopsin 3 based fluorescent voltage sensor Archon2. J. Photochem. Photobiol. B 225, 112331 (2021). [DOI] [PubMed] [Google Scholar]
- 39.Werley CA, Brookings T, Upadhyay H, Williams LA, McManus OB & Dempsey GT All-Optical Electrophysiology for Disease Modeling and Pharmacological Characterization of Neurons. Curr. Protoc. Pharmacol 78, 11 20 11–11 20 24 (2017). [DOI] [PMC free article] [PubMed] [Google Scholar]
- 40.Buchanan EK, Kinsella I, Zhou D, Zhu R, Zhou P, Gerhard F, … Shaik M Penalized matrix decomposition for denoising, compression, and improved demixing of functional imaging data. arXiv, 1807.06203 (2018). [Google Scholar]
- 41.Lim ST, Antonucci DE, Scannevin RH & Trimmer JS A novel targeting signal for proximal clustering of the Kv2.1 K+ channel in hippocampal neurons. Neuron 25, 385–397 (2000). [DOI] [PubMed] [Google Scholar]
- 42.Baker CA, Elyada YM, Parra A & Bolton MM Cellular resolution circuit mapping with temporal-focused excitation of soma-targeted channelrhodopsin. eLife 5 (2016). [DOI] [PMC free article] [PubMed] [Google Scholar]
- 43.Abs E, Poorthuis RB, Apelblat D, Muhammad K, Pardi MB, Enke L, … Letzkus JJ Learning-Related Plasticity in Dendrite-Targeting Layer 1 Interneurons. Neuron 100, 684–699 (2018). [DOI] [PMC free article] [PubMed] [Google Scholar]
- 44.Schuman B, Machold RP, Hashikawa Y, Fuzik J, Fishell GJ & Rudy B Four Unique Interneuron Populations Reside in Neocortical Layer 1. J. Neurosci 39, 125–139 (2019). [DOI] [PMC free article] [PubMed] [Google Scholar]
- 45.Anastasiades PG, Collins DP & Carter AG Mediodorsal and Ventromedial Thalamus Engage Distinct L1 Circuits in the Prefrontal Cortex. Neuron 109, 314–330 (2021). [DOI] [PMC free article] [PubMed] [Google Scholar]
- 46.Ferguson BR & Gao WJ PV Interneurons: Critical Regulators of E/I Balance for Prefrontal Cortex-Dependent Behavior and Psychiatric Disorders. Front. Neural Circuits 12, 37 (2018). [DOI] [PMC free article] [PubMed] [Google Scholar]
- 47.Jouhanneau JS, Kremkow J & Poulet JFA Single synaptic inputs drive high-precision action potentials in parvalbumin expressing GABA-ergic cortical neurons in vivo. Nat. Commun 9, 1540 (2018). [DOI] [PMC free article] [PubMed] [Google Scholar]
- 48.Antonoudiou P, Tan YL, Kontou G, Upton AL & Mann EO Parvalbumin and Somatostatin Interneurons Contribute to the Generation of Hippocampal Gamma Oscillations. J. Neurosci 40, 7668–7687 (2020). [DOI] [PMC free article] [PubMed] [Google Scholar]
- 49.Dombeck DA, Harvey CD, Tian L, Looger LL & Tank DW Functional imaging of hippocampal place cells at cellular resolution during virtual navigation. Nat. Neurosci 13, 1433–1440 (2010). [DOI] [PMC free article] [PubMed] [Google Scholar]
- 50.Ahmadi N, Constandinou TG & Bouganis CS Estimation of neuronal firing rate using Bayesian Adaptive Kernel Smoother (BAKS). Plos One 13, e0206794 (2018). [DOI] [PMC free article] [PubMed] [Google Scholar]
- 51.van Welie I, Roth A, Ho SS, Komai S & Hausser M Conditional Spike Transmission Mediated by Electrical Coupling Ensures Millisecond Precision-Correlated Activity among Interneurons In Vivo. Neuron 90, 810–823 (2016). [DOI] [PMC free article] [PubMed] [Google Scholar]
- 52.Feldman D, Singh A, Schmid-Burgk JL, Carlson RJ, Mezger A, Garrity AJ, … Blainey PC Optical Pooled Screens in Human Cells. Cell 179, 787–799 e717 (2019). [DOI] [PMC free article] [PubMed] [Google Scholar]
- 53.Mansoury M, Hamed M, Karmustaji R, Al Hannan F & Safrany ST The edge effect: A global problem. The trouble with culturing cells in 96-well plates. Biochemistry and Biophysics Reports 26 (2021). [DOI] [PMC free article] [PubMed] [Google Scholar]
- 54.Chien MP, Werley CA, Farhi SL & Cohen AE Photostick: a method for selective isolation of target cells from culture. Chem. Sci 6, 1701–1705 (2015). [DOI] [PMC free article] [PubMed] [Google Scholar]
- 55.Binan L, Belanger F, Uriarte M, Lemay JF, Pelletier De Koninck JC, Roy J, … Costantino S Opto-magnetic capture of individual cells based on visual phenotypes. eLife 8 (2019). [DOI] [PMC free article] [PubMed] [Google Scholar]
- 56.Lee D, Kume M & Holy TE Sensory coding mechanisms revealed by optical tagging of physiologically defined neuronal types. Science 366, 1384–1389 (2019). [DOI] [PMC free article] [PubMed] [Google Scholar]
- 57.Zimanyi L, Cao Y, Needleman R, Ottolenghi M & Lanyi JK Pathway of proton uptake in the bacteriorhodopsin photocycle. Biochemistry 32, 7669–7678 (1993). [DOI] [PubMed] [Google Scholar]
- 58.Brown LS, Yamazaki Y, Maeda A, Sun L, Needleman R & Lanyi JK The proton transfers in the cytoplasmic domain of bacteriorhodopsin are facilitated by a cluster of interacting residues. J. Mol. Biol 239, 401–414 (1994). [DOI] [PubMed] [Google Scholar]
- 59.Ferrarese L, Jouhanneau JS, Remme MWH, Kremkow J, Katona G, Rozsa B, … Poulet JFA Dendrite-Specific Amplification of Weak Synaptic Input during Network Activity In Vivo. Cell Rep. 24, 3455–3465 e3455 (2018). [DOI] [PMC free article] [PubMed] [Google Scholar]
- 60.Jouhanneau JS & Poulet JFA Multiple Two-Photon Targeted Whole-Cell Patch-Clamp Recordings From Monosynaptically Connected Neurons in vivo. Front. Synaptic Neurosci 11, 15 (2019). [DOI] [PMC free article] [PubMed] [Google Scholar]
- 61.Lambert TJ FPbase: a community-editable fluorescent protein database. Nat. Methods 16, 277–278 (2019). [DOI] [PubMed] [Google Scholar]
- 62.Hofherr A, Fakler B & Klocker N Selective Golgi export of Kir2.1 controls the stoichiometry of functional Kir2.x channel heteromers. J. Cell Sci 118, 1935–1943 (2005). [DOI] [PubMed] [Google Scholar]
- 63.Stockklausner C, Ludwig J, Ruppersberg JP & Klocker N A sequence motif responsible for ER export and surface expression of Kir2.0 inward rectifier K(+) channels. FEBS Lett. 493, 129–133 (2001). [DOI] [PubMed] [Google Scholar]
Methods only references
- 64.Gradinaru V, Zhang F, Ramakrishnan C, Mattis J, Prakash R, Diester I, … Deisseroth K Molecular and cellular approaches for diversifying and extending optogenetics. Cell 141, 154–165 (2010). [DOI] [PMC free article] [PubMed] [Google Scholar]
- 65.Nguyen C, Upadhyay H, Murphy M, Borja G, Rozsahegyi EJ, Barnett A, … Werley CA Simultaneous voltage and calcium imaging and optogenetic stimulation with high sensitivity and a wide field of view. Biomed. Opt. Express 10, 789–806 (2019). [DOI] [PMC free article] [PubMed] [Google Scholar]
- 66.Goldey GJ, Roumis DK, Glickfeld LL, Kerlin AM, Reid RC, Bonin V, … Andermann ML Removable cranial windows for long-term imaging in awake mice. Nat. Protoc 9, 2515–2538 (2014). [DOI] [PMC free article] [PubMed] [Google Scholar]
Associated Data
This section collects any data citations, data availability statements, or supplementary materials included in this article.
Supplementary Materials
Data Availability Statement
Data used in the study are available upon reasonable request to A.E.C.


