

SUMMARY
Human brain organoids provide unique platforms for modeling several aspects of human brain development and pathology. However, current brain organoid systems mostly lack the resolution to recapitulate the development of finer brain structures with subregional identity, including functionally distinct nuclei in the thalamus. Here, we report a method for converting human embryonic stem cells (hESCs) into ventral thalamic organoids (vThOs) with transcriptionally diverse nuclei identities. Notably, single-cell RNA sequencing revealed previously unachieved thalamic patterning with a thalamic reticular nucleus (TRN) signature, a GABAergic nucleus located in the ventral thalamus. Using vThOs, we explored the functions of TRN-specific, disease-associated genes patched domain containing 1 (PTCHD1) and receptor tyrosine-protein kinase (ERBB4) during human thalamic development. Perturbations in PTCHD1 or ERBB4 impaired neuronal functions in vThOs, albeit not affecting overall thalamic lineage development. Together, vThOs present an experimental model for understanding nuclei-specific development and pathology in the thalamus of the human brain.
Keywords: Brain organoid, reticular nucleus, thalamic organoid, ERBB4, PTCHD1, hESC
Graphical Abstract

In Brief
Generation of organoid models for subregions of the human brain is challenging. Park and colleagues report a method to generate ventralized thalamic organoids, which recapitulate molecular and functional features, and cellular diversity of ventral thalamic nuclei and offer a model to dissect related brain disorders.
INTRODUCTION
Despite substantial progress in the organoid field in recent years, there has been a significant challenge in modeling complex brain regions with subregional identity (e.g., distinct nuclei in the thalamus or subregions of the hippocampus).1–3 For example, the thalamus divides into approximately 60 nuclei, each with unique connections to other brain regions regulating distinct functions.4,5 One such nucleus, the thalamic reticular nucleus (TRN), is the primary part of the ventral thalamus (also known as prethalamus) comprised of a thin sheet of inhibitory GABAergic neurons strategically located between the cortex and dorsal thalamus.6 Due to its location and cellular nature, the TRN provides inhibitory feedback to thalamocortical connections and plays vital roles in gating sensory information flow, attention selection, and sleep rhythm generation.7–10 Accordingly, TRN dysfunction has been linked to sleep disturbances, attention deficits, and sensory abnormalities in many neurodevelopmental disorders, including attention-deficit/hyperactivity disorder (ADHD), intellectual disability (ID), and autism spectrum disorders (ASD).6,11,12 Although animal studies have provided valuable information to the TRN function, little is known about the development and function of the TRN in the developing human brain in physiological and disease contexts. Therefore, it is imperative to have a robust in vitro model to study human-specific features of TRN development and function as well as to further our understanding of the pathophysiology of TRN-related disorders.
Three-dimensional (3D) brain organoids provide physiologically relevant in vitro systems to examine human brain development and disorders.13,14 Human pluripotent stem cells (PSCs)-derived region-specific organoids have accelerated our understanding of how distinct regions of the human brain develop.15,16 Previously, we demonstrated the generation of thalamic organoids with a regional identity similar to the dorsal division of the human thalamus.17 Here, we developed a method for differentiating human embryonic stem cells (hESCs) into ventral thalamus-like brain organoids (vThOs). Through single-cell transcriptome analysis, we discovered divergent thalamic lineages in vThOs. Strikingly, TRN-like cell clusters that displayed similar heterogeneity to in vivo TRN formed during vThO development. By manipulating TRN-specific, disease-related genes (ERBB4 and PTCHD1) in vThOs, we further demonstrated that vThOs represent a model for deciphering nucleus-specific disease mechanisms during human thalamic development.
RESULTS
Generation of thalamic organoids with a ventral identity
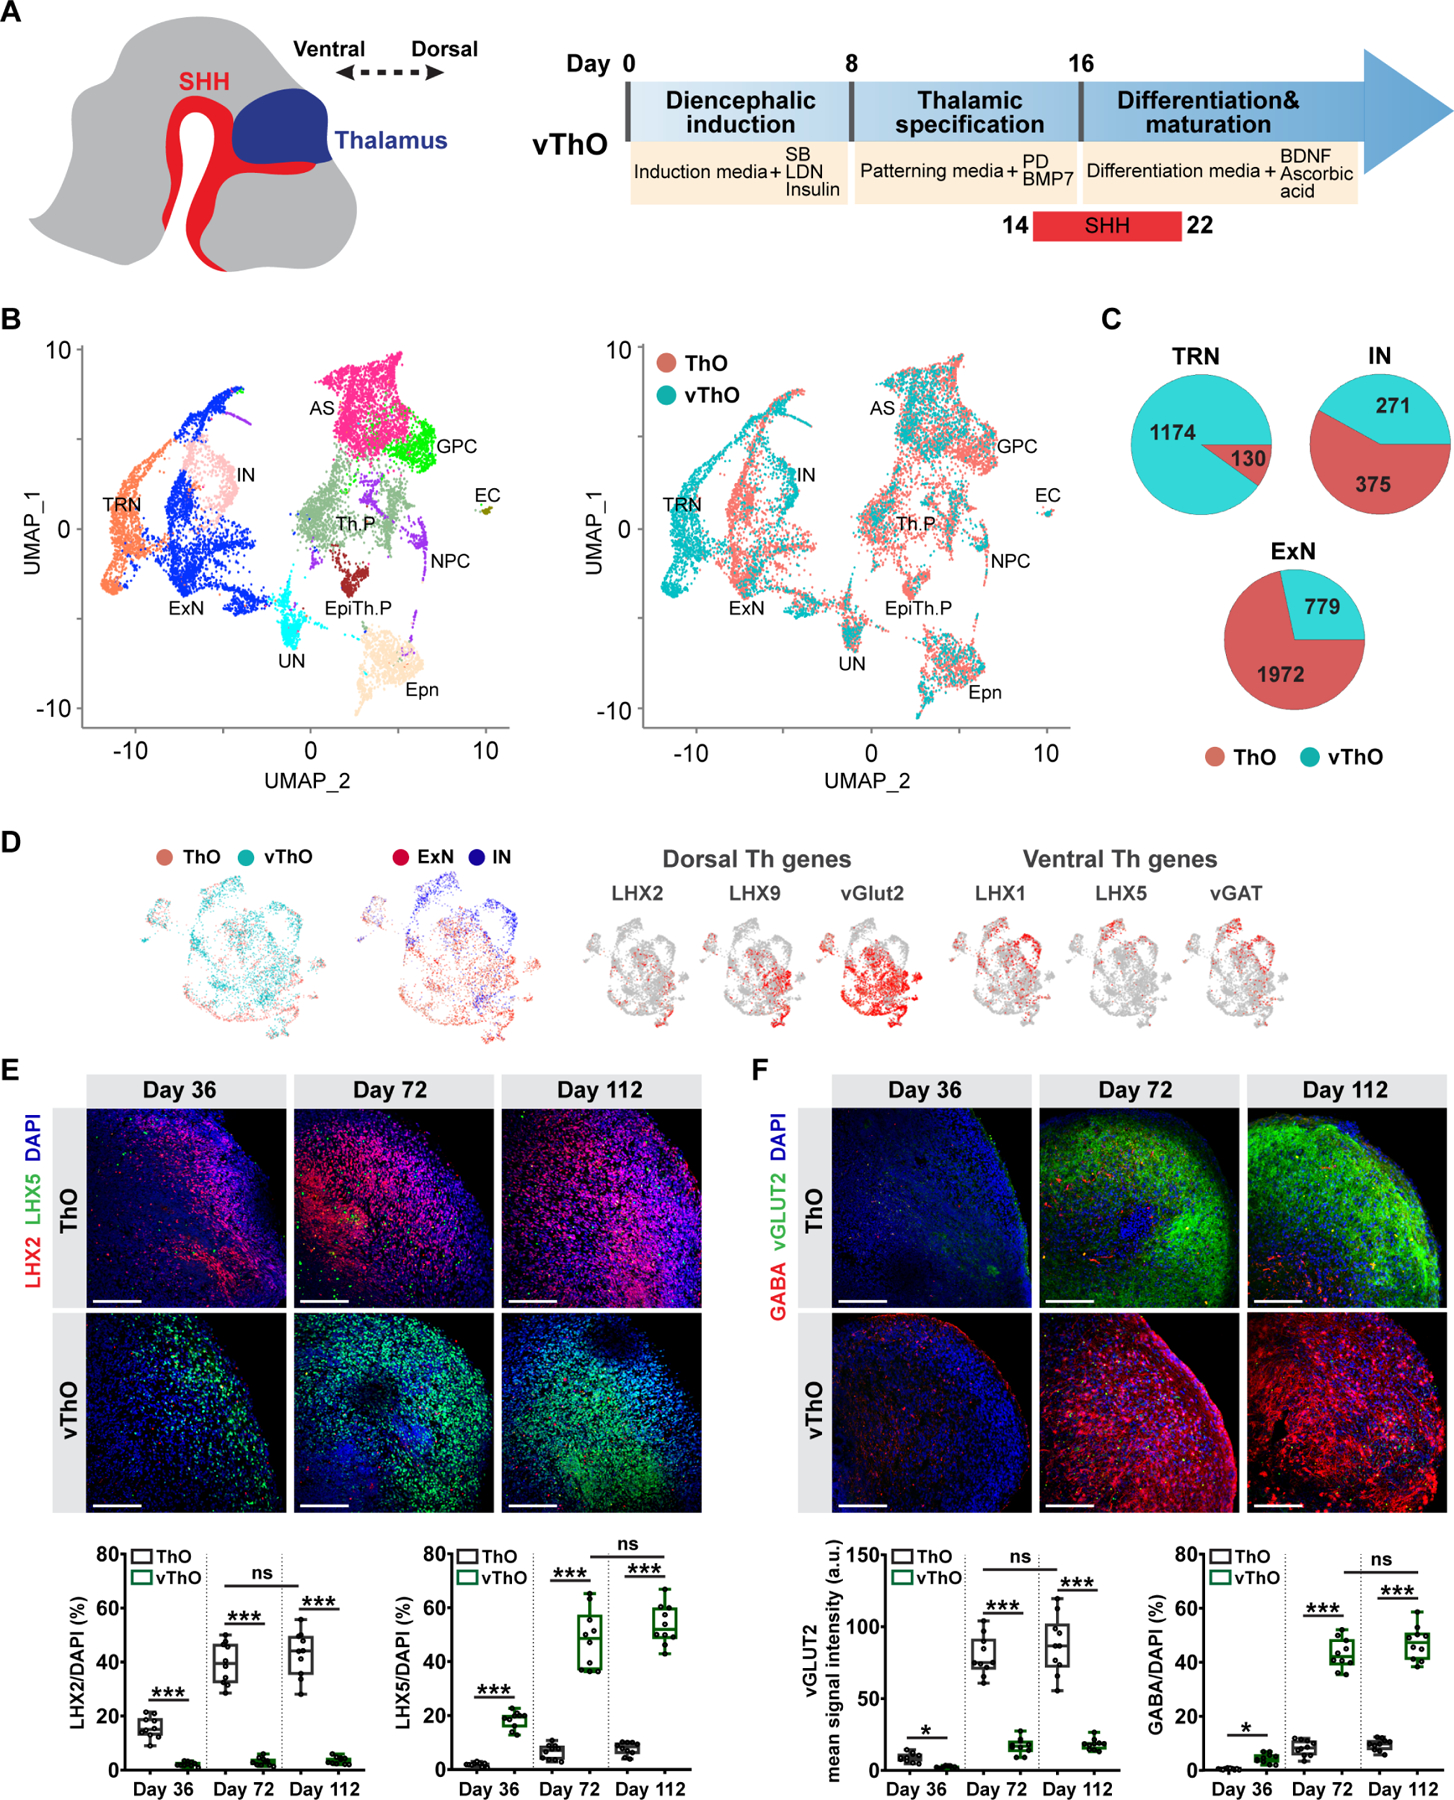
We previously generated human thalamic organoids (ThOs) resembling the dorsal thalamus by dual SMAD inhibition and insulin-driven caudalization coupled with thalamic patterning (MEK-ERK inhibition and BMP7 activation) from hESCs.17 Notably, several studies demonstrated that secreted morphogen Sonic Hedgehog (SHH) plays a critical role in controlling cellular fate in the thalamus, promoting the emergence of the rostroventral portion of the thalamus, including the TRN.18–23 Thus, we explored thalamic differentiation with the treatment of recombinant SHH (C25II) under 3 different conditions: (1) SHH treatment that covers the entire patterning stage (d8-16), (2) mid-patterning stage to early differentiation stage (d12-20), (3) or late-patterning stage to early differentiation stage (d14-22) (Figure S1A). To examine the effect of SHH on transcriptional change and lineage commitment in guiding the thalamic fate, we performed single-cell RNA sequencing (scRNA-seq) of 37,941 cells from day 70 organoids with or without SHH treatment. Differential gene expression analysis showed a significant upregulation of genes enriched in the ventral thalamus (RELN, LHX5, LHX1) and TRN (TRH, ESRRG)24–26 in organoids treated with SHH at d12-20 or d14-22 (Figure S1B). In contrast, dorsal thalamic markers (LHX2 and LHX9)27 were significantly downregulated and displayed slight differences across all 3 SHH treatment conditions (Figure S1B). Immunostaining further confirmed drastically downregulated dorsal marker (LHX2) and significantly upregulated ventral marker (LHX5) in thalamic organoids with SHH treatment at later time points (Figure S1C, Conditions 2 and 3). Immunostaining with another ventral thalamic identity marker, DLX2,21 further demonstrated the enrichment of cells with ventral identity in thalamic organoids treated with SHH at later time points, particularly between d14-22 (Figure S1D). However, thalamic organoids from all conditions acquired similar production of cells positive for broad thalamus27 and mature neuron markers, TCF7L2 and MAP2, respectively (Figure S1E), indicating similar thalamic neuron differentiation regardless of the shift in dorsal-ventral identity with SHH treatment. Finally, a comparison with unique markers in six different human thalamic regions revealed that SHH-treated (d14-22) thalamic organoids were similar to the ventral anterior thalamic nucleus, pulvinar, and medial geniculate nucleus (Figure S1F).28
The dorsal thalamus exhibits PAX6 expression preferentially in neural progenitors, whereas both progenitors and neurons in the ventral thalamus demonstrate PAX6 expression.21,29 To examine the expression pattern of PAX6 from proliferative progenitors to postmitotic neurons, we employed pseudo-temporal modeling of single cells and pseudotime calculation to determine developmental stages (Figure S1G).30 We discovered that PAX6 is highly expressed in postmitotic neurons (MKI67− cells) of thalamic organoids with SHH administration between d14-22. In contrast, PAX6 expression is very limited in postmitotic neurons of thalamic organoids with no or earlier SHH treatment (d8-16 and d12-20) (Figure S1G). Together, our findings suggest that late activation of the SHH pathway (day14-22) leads to the generation of thalamic organoids with a ventral identity. Therefore, we named these organoids ventralized thalamic organoids (vThOs) (Figure 1A).
Figure 1. Transcriptional and cellular characterization of ventral thalamic organoids (vThOs).
(A) Left, a schematic view showing the regionalization of the diencephalon by SHH activity during embryonic development. Right, schematic describing the protocol for generating vThOs from human hESC.
(B) UMAP plots of single-cell RNA-seq analysis from ThOs and vThOs at day 70 colored by cell type assignment (left) and organoid type (right). ExN: Excitatory neuron, IN: Inhibitory neuron, TRN: Thalamic reticular nucleus neuron, AS: astrocyte, EpiTh.P: Epithalamic progenitors, Th.P: Thalamic progenitors, NPC: neuronal progenitor cell, GPC: glia progenitor cell, Epn: Ependymal cell, EC: Endothelial cell, UN: unassigned cells.
(C) Pie chart representing the cell count from ThOs and vThOs in TRN, IN, and ExN clusters.
(D) Distribution of excitatory and inhibitory neurons in ThOs and vThOs, and expression profiles of known ventral/dorsal thalamic markers in ThO- and vThO-derived cells.
(E) Immunostaining of vThOs and ThOs at days 36, 72, and 112 for dorsal identity marker LHX2 and ventral identity marker LHX5. Data represent the mean ± SEM (n=10 organoids, ns=not significant, ***p<0.001). An unpaired two-tail t-test with Welch’s correction was used for comparison.
(F) Immunostaining of vThOs and ThOs at days 36, 72, and 112 for excitatory neuron marker vGLUT2 and inhibitory neuron marker GABA. Data represent the mean ± SEM (n=10 organoids, ns=not significant, *p<0.05, ***p<0.001). An unpaired two-tail t-test with Welch’s correction was used for comparison. Scale bars represent 100 μm in E and F.
Single-cell transcriptomics atlas of vThO reveals the presence of inhibitory neuron clusters, including TRN identity
To investigate thalamic cell specification, we further analyzed the scRNA-seq generated from ThOs and vThOs at day 70. After quality control, 11 major cell clusters were defined by their distinct molecular features, including excitatory neurons, inhibitory neurons, astrocytes, endothelial cells (EC), ependymal cells (Epn) and progenitor populations (Figure 1B and S2A). Notably, we identified two major inhibitory neuron clusters abundantly generated in vThOs; IN (inhibitory neuron) and TRN. Inhibitory neurons in TRN cluster exhibit high expression of canonical TRN markers (ECEL1, SPP1, SST, ESRRG, RORB) (Figures 1B, C, and S2B, C, D). Comparative analysis with the reference transcriptome and unique cell markers validated the presence of the TRN cell cluster (Figure S2C, D).31 As shown in a previous mouse model,32 and in RNA in situ hybridization that indicated the discrete expression of SPP1 and ECEL1 in the TRN region (Figure S2C), we observed transcriptional separation of cell clusters defined by the expression of SPP1 and ECEL1 in the TRN cluster (Figure S2D). SHH signaling also regulates the emergence of rostral thalamic progenitors that mostly differentiate into GABAergic thalamic neurons.20 Overall, similar to the developing human thalamus, SHH activation in organoid culture induces the generation of inhibitory neurons with TRN-like cellular identity.
During development, the ventral-to-dorsal gradient of SHH activity specifies different neuronal subtypes that are characterized by unique markers.27,33 In vThO-derived cells, we detected strong expression of ventral identity markers (LHX1, LHX5, and vGAT), while in stark contrast ThO-derived cells mostly demonstrate dorsal identity (LHX2, LHX9, and vGLUT2) (Figure 1D).34 Quantitative PCR analysis verified that the expression of ventral markers (DLX2, LHX1, LHX5, and vGAT) was significantly higher in vThOs than ThOs (Figure S3A). Similarly, vThOs demonstrate notably higher expression of TRN markers (SST, SPP1, ECEL1, PTCHD1, and ERBB4) than ThOs (Figure S3A). Furthermore, immunostaining revealed a widespread expression of the ventral identity markers LHX5 and LHX1 at different stages of organoid development only in vThOs but not in ThOs (Figure 1E and S3B). In contrast, ThOs mostly contain LHX2+ thalamic neurons with dorsal identity (Figure 1E). Co-labeling with general thalamic neuron marker TCF7L226 and ventral identity marker LHX5 proved that almost all thalamic cells in vThOs acquired ventral identity (Figure S3C).
The ventral section of the thalamus, including TRN, is mostly comprised of inhibitory GABAergic neurons, whereas the nuclei in the dorsal section mostly contain excitatory glutamatergic neurons.5 Immunostaining analysis with the combination of excitatory neuron marker vGLUT2 and inhibitory neuron marker GABA revealed the enrichment of GABAergic inhibitory neurons in vThOs while ThOs mostly contain excitatory glutamatergic neurons. Notably, the specification of excitatory neurons in ThOs and inhibitory neurons in vThOs were mostly complete by day 72 in culture (Figure 1F). Also, GABA+ thalamic neurons within vThOs co-express ventral identity marker LHX5 corroborating the conclusion that thalamic progenitors that acquired the ventral identity differentiate into inhibitory neurons similar to those during in vivo embryonic development (Figure S3D).5
Next, we performed single-cell RNAseq at earlier (Day36) and later (D112) stages of ThOs and vThOs. We observed similar cell clusters of the integrated datasets from ThOs and vThOs at days 36, 72 and 112 and the integrated datasets of human fetal dorsal and ventral thalamus (Figure S3E).35 Importantly, gene set enrichment analysis (GSEA) revealed the enrichment of ventral thalamus gene signature in vThOs across different developmental stages (Figure S3F). To investigate the developmental changes of inhibitory neurons in vThOs, next we performed an inferred pseudotime analysis across vThOs at days 36, 72, 112 in culture, which revealed a large fraction of mature inhibitory neurons at days 72 and 112 compared to day 36 (Figure S3G). We also observed elevated expression of neuronal markers (STMN2, GAP43, DCX), inhibitory neuron markers (SLC32A1, GAD1/2) and ventral thalamic markers (ESRRG, PBX3, LHX1) with pseudotime (Figure S3H). Finally, GO analysis demonstrated that pseudotime is associated with maturation trajectory of inhibitory neurons (Figure S3I). Together, these results show that vThOs resemble the human fetal ventral thalamus with progressive maturation of inhibitory neurons.
vThOs contain diverse thalamic nuclei with ventral identity
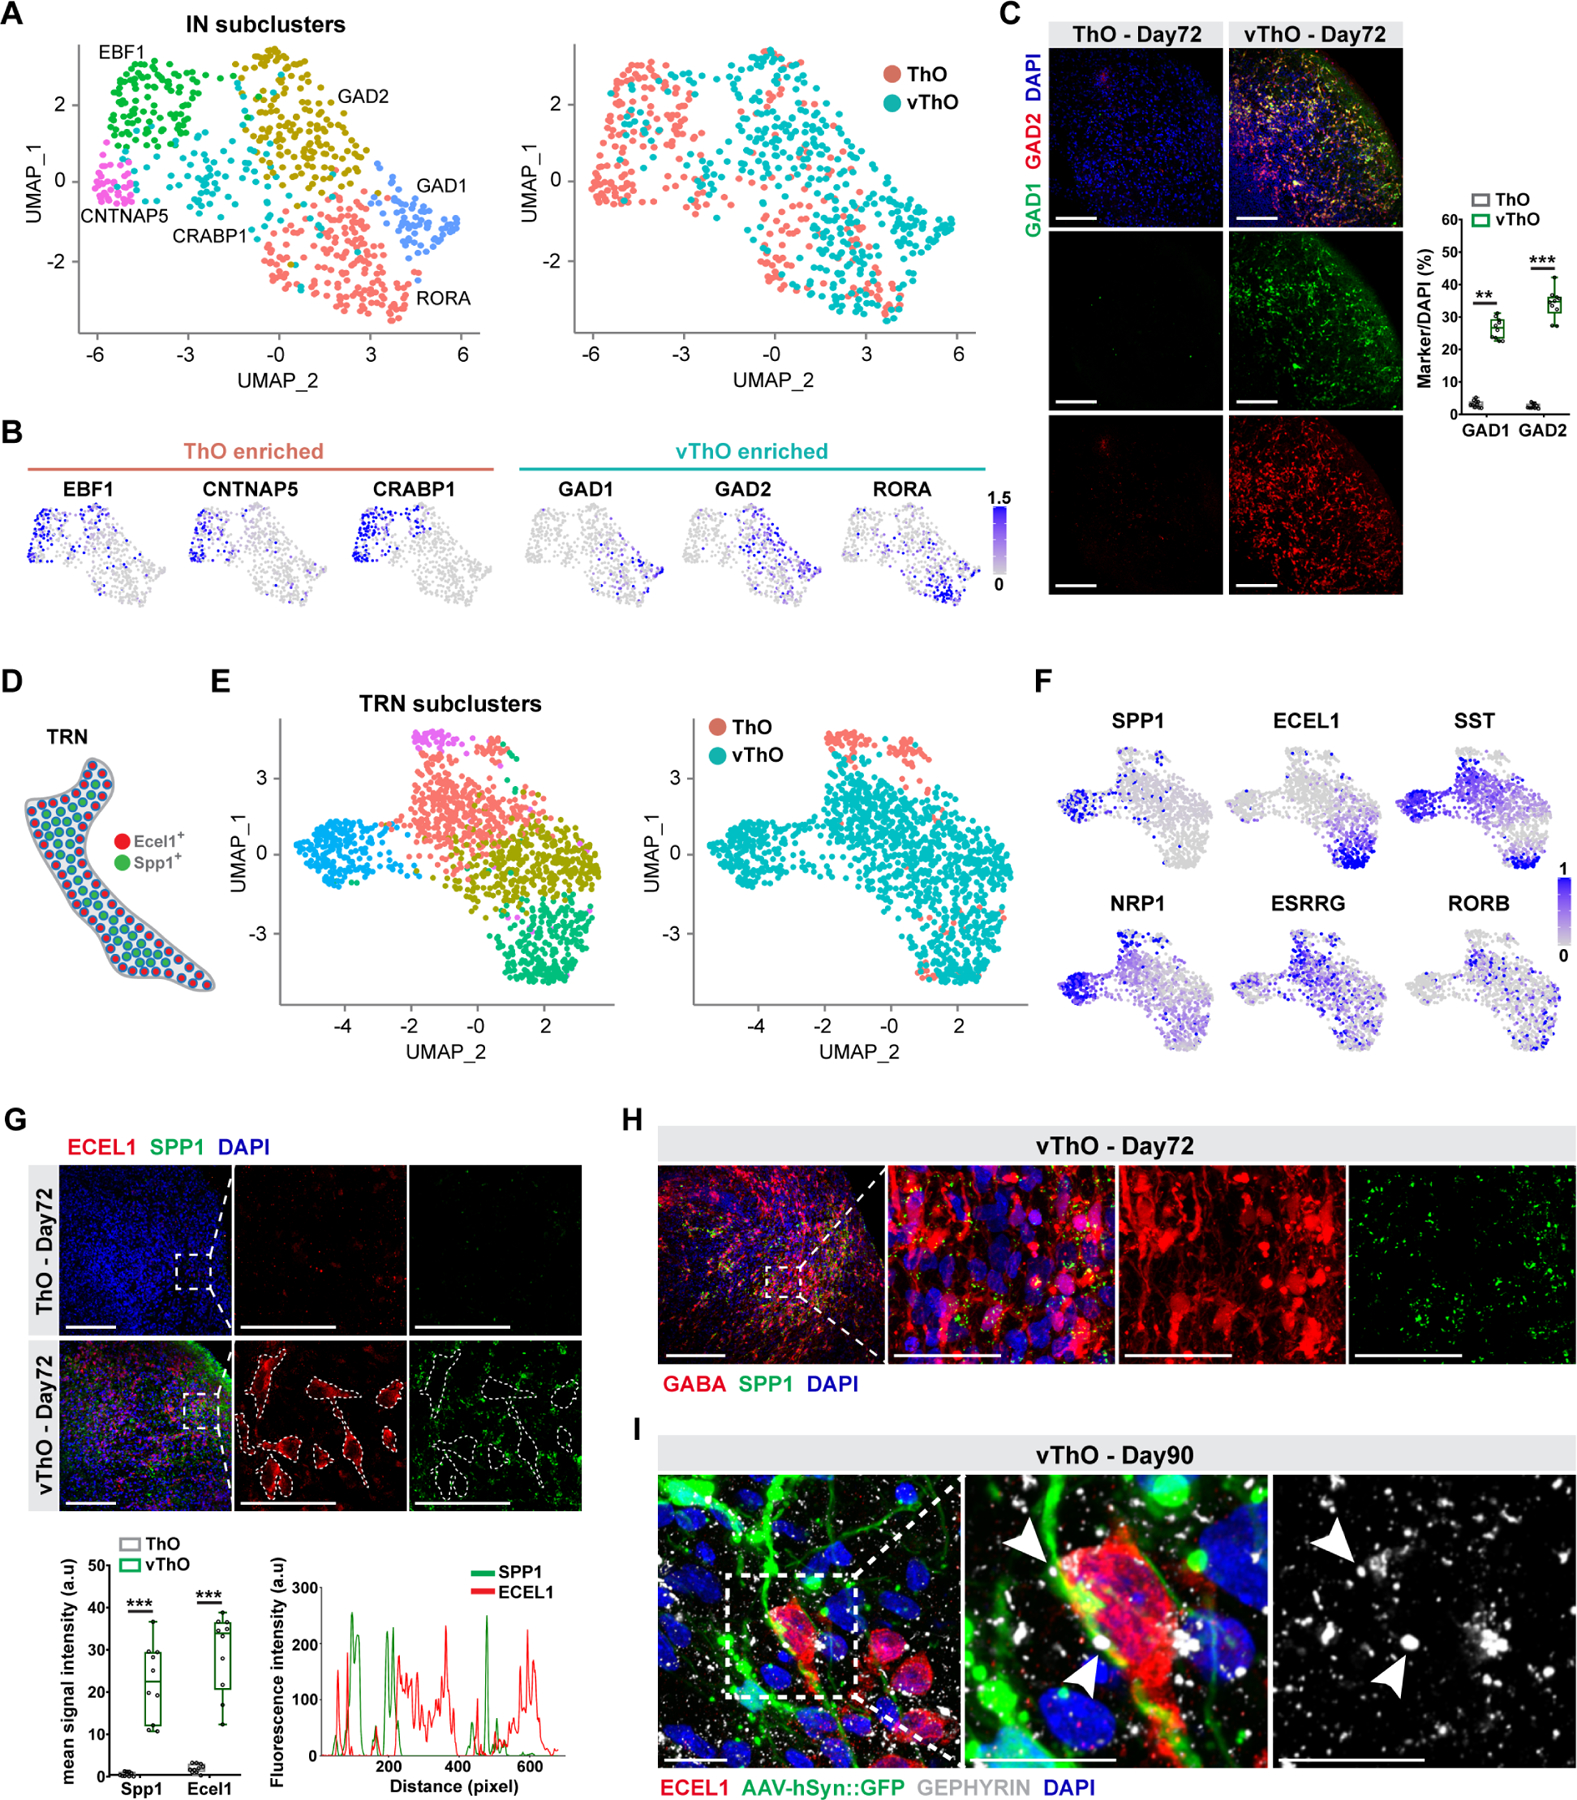
Previous studies emphasized the heterogeneity across thalamic nuclei.36,37 More recently, scRNA-seq technologies further uncovered the cellular complexity of thalamic neurons.5,38,39 Here, we further analyzed the single-cell transcriptome of ThO and vThO to define the thalamic nuclei identities. Our sub-clustering analysis of the inhibitory neuron cell populations without TRN markers (IN) produced 6 distinct subtypes, some strongly enriched in ThOs characterized by high expression of EBF1, CNTNAP5, and CRABP1 (Figure 2A, B). In contrast, vThOs contained highly enriched inhibitory neuron subpopulations marked by GAD1, GAD2, and RORA expression (Figure 2B). Indeed, subgroups defined by the expression of RORA+ and GAD2+ have also been detected in adult mouse ventral thalamic nuclei.38 Furthermore, immunostaining for the inhibitory neuron markers GAD1 and GAD2 in thalamic organoids revealed widespread expression of GAD1+ and GAD2+ thalamic neurons in vThOs but not in ThOs (Figure 2C). We next sub-clustered the TRN cell population since TRN showed a molecular heterogeneity within the nucleus (Figure 2D, E, F).32 Sub-clustering analysis uncovered 4 unique TRN subclusters within vThOs, which were mostly absent in ThOs (Figure 2E). vThOs contained highly enriched SST+ and RORB+ cells in several TRN subpopulations (Figure 2E, F). The presence of SST+ neurons in TRN has also been shown in mice models.40 A previous study revealed that in adult mice TRN neurons demonstrate core versus shell-like expression of SPP1 and ECEL1, respectively (Figure 2D).32 Indeed, vThOs showed enriched expression of SPP1 and ECEL1 in separate subpopulations similar to their in vivo counterparts (Figure 2F). We further performed immunostaining for SPP1 and ECEL1 to examine the structural organization within thalamic organoids. vThOs contained highly enriched and separated subpopulations of SPP1+ and ECEL1+ cells (Figure 2G). However, although ECEL1+ TRN neurons tend to cluster together in vThOs (Figure S2E), the distinct core-versus shell-like anatomical structure was not apparent. The lack of structural organization of TRN cells could stem from the fact that brain organoids mostly represent features of the early to mid-gestational stage of the developing brain.16,41 Since TRN is comprised of GABAergic inhibitory neurons, we performed co-staining with inhibitory neuron marker GABA and TRN marker SPP1 in vThOs and demonstrated that SPP1 is localized to cell bodies and branches of GABAergic neurons (Figure 2H). Finally, to interrogate the synaptic connectivity of TRN neurons within vThOs, we infected vThOs with AAV-hSyn::GFP and co-labeled TRN neurons with ECEL1 and inhibitory synapses with GEPHYRIN. Apart from widespread inhibitory synapse formation in vThOs by Day 90 in culture, this result demonstrated that ECEL1+ TRN neurons form synaptic connections with ECEL1−/GFP+ non-TRN neurons (Figure 2I). Collectively, our results demonstrated that vThOs contain cell types with transcriptional and cellular characteristics reminiscent of in vivo TRN neurons, and they exhibit mature neuron phenotypes by day 90 in culture.
Figure 2. Cell heterogeneity of inhibitory and TRN neuron cell clusters from vThOs.
(A) UMAP plots of single-cell RNA-seq analysis of ThOs and vThOs from IN cell clusters.
(B) GAD1, GAD2, and RORA are significantly enriched in inhibitory thalamic neurons derived from vThOs. In contrast, ThO-derived inhibitory neurons express genes including EBF1, CNTNAP5, and CRABP1. Enrichment and depletion are scaled by - log2(FDR) and shown as a grey-to-blue gradient towards enriched expression.
(C) Left, GAD1 and GAD2 staining of ThOs and vThOs at day 72. Right, quantification of marker+/DAPI+ cells indicated the drastic enrichment of GAD1+ and GAD2+ neurons in vThOs at day 72. Data represent the mean ± SEM (n=10 organoids, **p<0.01, ***p<0.001). An unpaired two-tail t-test with Welch’s correction was used for comparison.
(D) Scheme demonstrating non-overlapping expression of ECEL1 and SPP1 within TRN.
(E) UMAP plots of single-cell RNA-seq analysis of ThOs and vThOs from TRN cells indicating distinct subclusters.
(F). Enrichment of TRN-specific cell markers, SPP1, ECEL1, SST, NRP1, ESRRG, and RORB within vThOs. Exclusive expressions of SPP1 and ECEL1 were observed in TRN subpopulations. Enrichment and depletion are scaled by - log2(FDR) and shown as a grey-to-blue gradient towards enriched expression.
(G) Top, co-staining for SPP1 and ECEL1 in ThOs and vThOs at day 72. Dotted lines mark the territory of ECEL1-positive cells. Note the exclusion of the SPP1 signal in the dotted lines. Bottom, quantification of mean signal intensity in cells indicates the drastic enrichment of SPP1 and ECEL1 in vThOs compared to ThOs. The fluorescence intensity graph shows the non-overlapping localization of SPP1 and ECEL1. Data represent the mean ± SEM (n=10 organoids, ***p<0.001). An unpaired two-tail t-test with Welch’s correction was used for comparison.
(H) Co-staining of GABA and SPP1 in vThOs at day 72. Note the co-localization of TRN neuron marker SPP1 within GABA-positive inhibitory neurons.
(I) Co-staining of TRN neuron markers ECEL1 and inhibitory synapse marker GEPHYRIN in AAV-hSyn::GFP infected vThOs at Day90. Arrowheads point synapses between ECEL1+ TRN neuron and GFP+/ECEL1− nonTRN neurons. Scale bars represent 100 μm in C, G and H, and 20 μm in I.
vThOs contain functionally distinct neurons
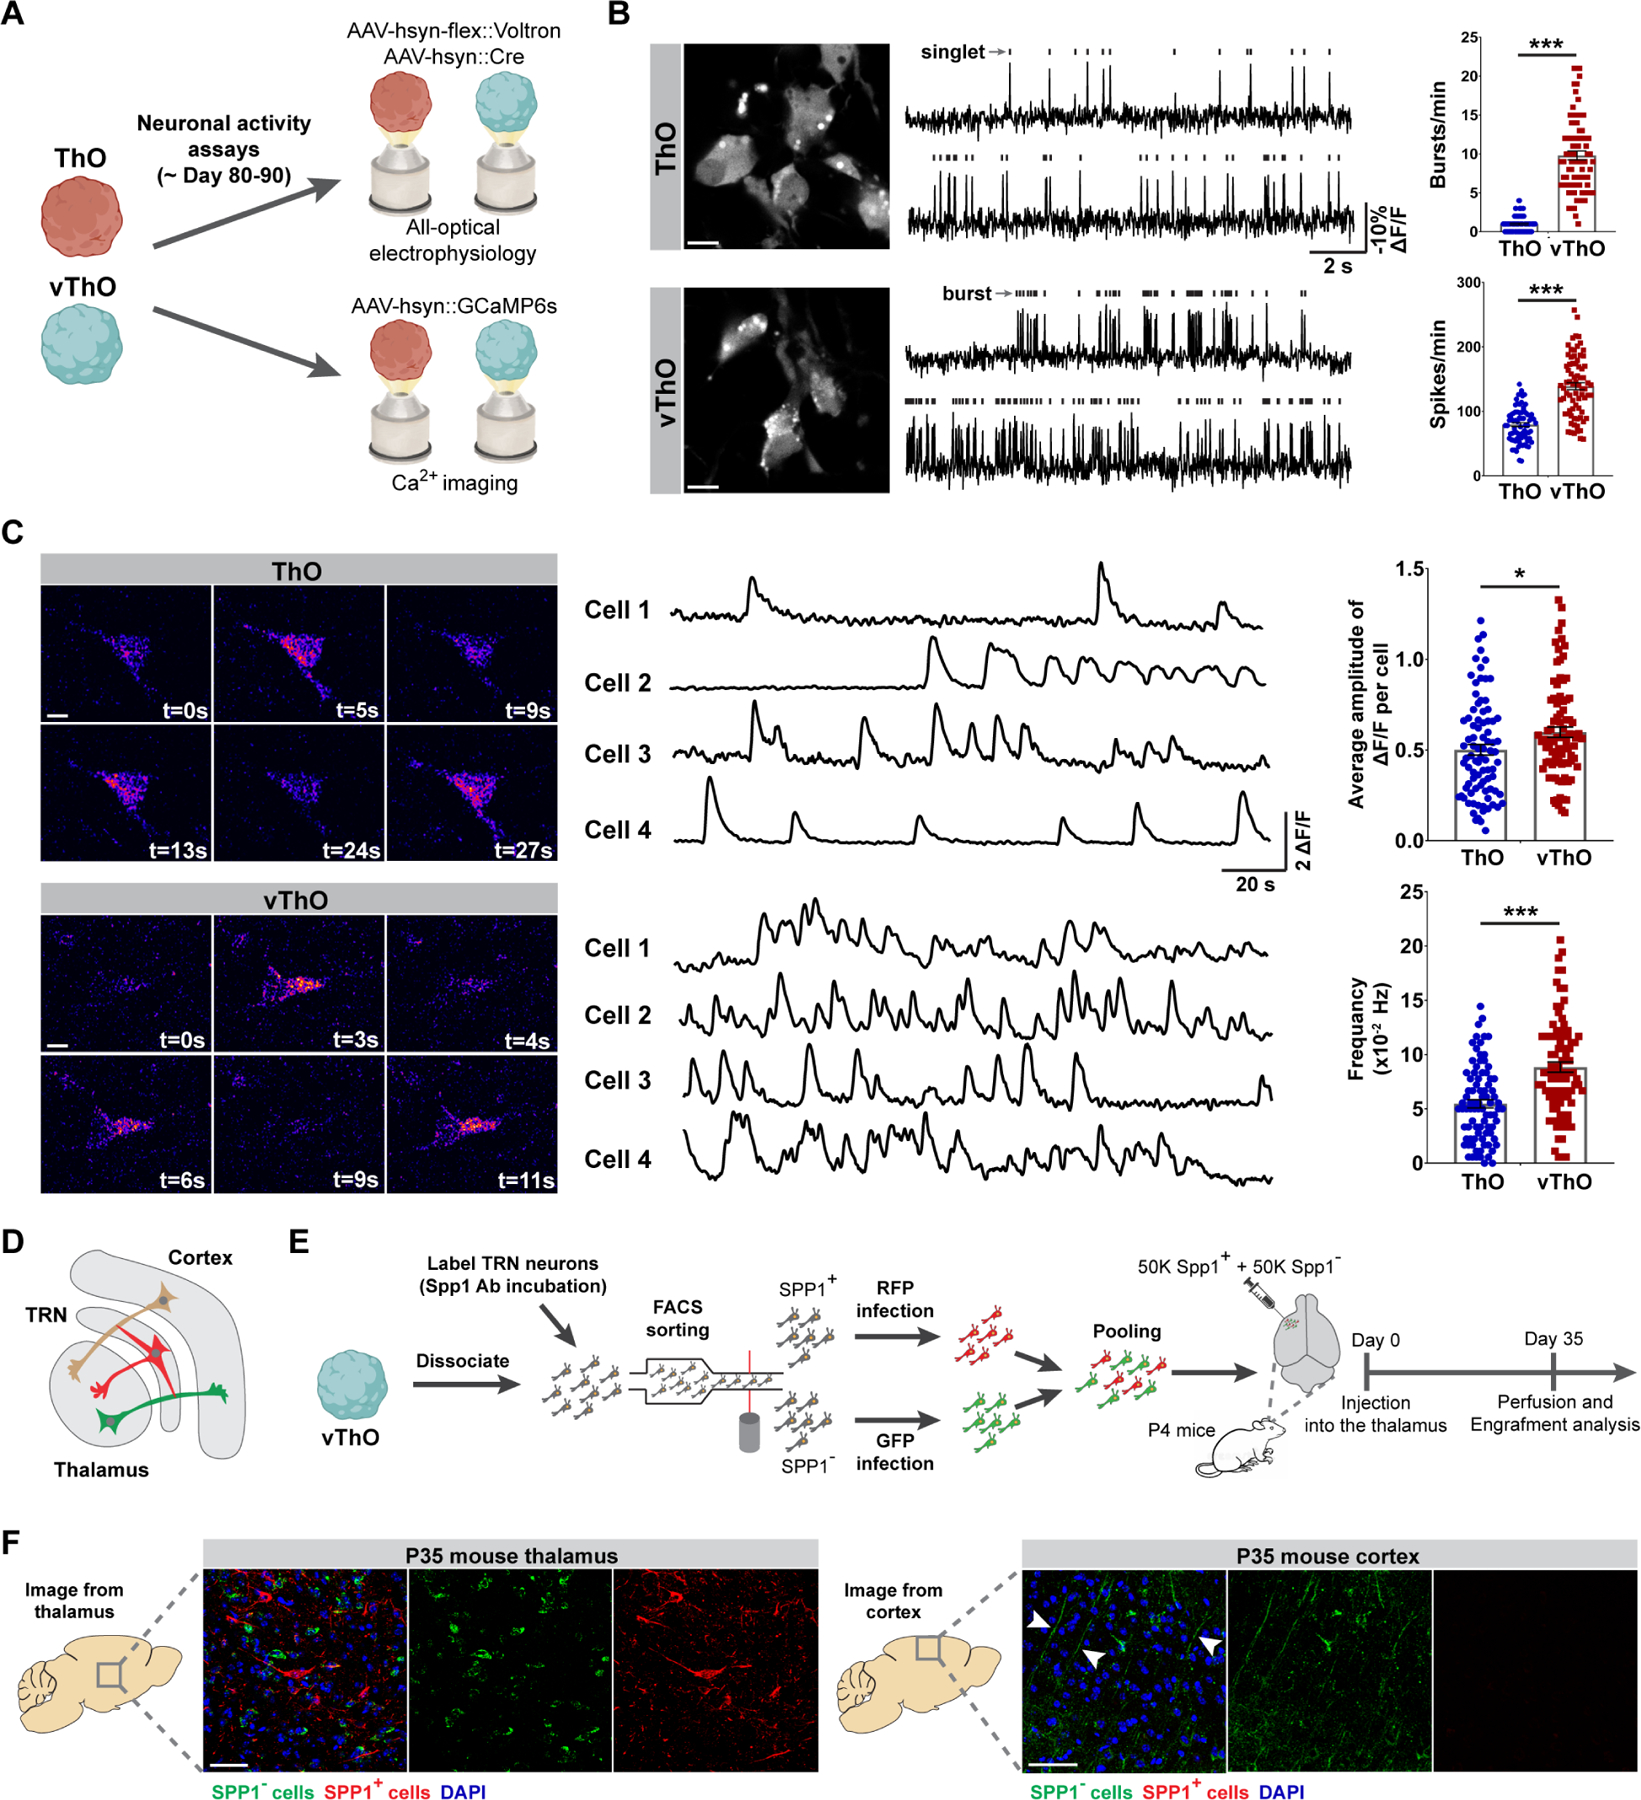
Since ThOs and vThOs contain neuronal populations with distinct transcriptional and cellular identities, we next compared the functional properties of neurons in ThOs and vThOs (Figure 3A). TRN neurons exhibit intrinsic bursting activity that regulates thalamocortical oscillations.42,43 Therefore, to describe the firing properties of individual neurons in ThOs and vThOs, we took an all-optical electrophysiology approach using a genetically encoded voltage indicator Voltron.44 Interestingly, we observed a clear difference in firing patterns between neurons from ThOs and vThOs. Most noticeably, neurons from vThOs exhibited ~10-fold more high-frequency action potentials (bursts), while neurons from ThOs mostly fired in single action potentials (singlet) (Figure 3B). This eventually led to an increased spiking rate in neurons from vThOs compared to those from ThOs (Figure 3B). We then performed calcium imaging with the genetically encoded calcium indicator GCaMP6s.45 Consistent with the high spiking rates of neurons from vThOs observed in voltage imaging experiments (Figure 3B), the frequency and the average amplitude of calcium activity in neurons from vThOs were significantly higher compared to those from ThOs (Figure 3C). These results not only demonstrate the functional maturation of neurons in both types of thalamic organoids but also indicate the functional divergence of neurons generated in ThOs and vThOs. More importantly, neurons from vThOs exhibit electrophysiological characteristics similar to the TRN neurons described in animal models.42,43
Figure 3. Neurons from ThOs and vThOs demonstrate distinct firing properties.
(A) Schematic diagram showing all-optical electrophysiology and calcium imaging approach to record neuronal activity in ThOs and vThOs at days 80–90.
(B) Left, representative images of neurons in ThO and vThO expressing the voltage indicator Voltron and labeled with Janelia Fluor 549 (JF549). Middle, representative voltage traces from neurons in ThO and vThO with detected action potentials indicated by black rectangles above the traces. Right, quantifications of burst and spike numbers per minute observed in neurons from ThOs and vThOs. Data represent the mean ± SEM (n=80 neurons per condition from 8 different organoids, ***p<0.001). An unpaired two-tail t-test with Welch’s correction was used for comparison.
(C) Left, representative images demonstrating calcium activity traces observed from individual neurons in ThOs and vThOs (day80-90). Right, quantifications of the average amplitude of 𝛥F/F per cell and calcium spike frequency of neurons from ThOs and vThOs. Data represent the mean ± SEM (n=90 neurons per condition from 9 different organoids, *p<0.05, ***p<0.001). An unpaired two-tail t-test with Welch’s correction was used for comparison.
(D) Scheme showing main connections between the thalamus, cerebral cortex, and TRN.
(E) Depiction of isolation and transplantation of SPP1+ (RFP) and SPP1− (GFP) vThO-derived neurons into the cortex of immune-deficient mice brain.
(F) Co-staining for GFP and RFP indicates successful engraftment of SPP1− thalamic neurons and SPP1+ TRN neurons into the mouse thalamus (left panel). SPP1− thalamic neurons project to the cortex but not SPP1+ TRN neurons similar to their in vivo counterparts (right panel). n=7 animals. Scale bars represent 10 μm in B and C and 100 μm in F.
The TRN receives excitatory projections from thalamocortical and corticothalamic neurons and sends inhibitory afferents to the dorsal thalamus and TRN itself but not to the cortex (Figure 3D).6 We next sought to answer whether TRN neurons in vThOs would follow a similar connection profile when transplanted into the thalamus of neonatal mice. To test this, we sorted SPP1+ TRN neurons and SPP1− thalamic neurons from vThOs. Then, we labeled SPP1+ and SPP1− cells with AAV-hSyn:RFP and AAV-hSyn:GFP, respectively. Finally, we injected pooled RFP+ and GFP+ neurons into the thalamus of an immune-deficient neonatal mouse (Figure 3E). After 35 days of transplantation, immunostaining for GFP and RFP revealed that both SPP1− thalamic neurons (GFP+) and SPP1+ TRN neurons (RFP+) were able to survive and engraft into the mouse thalamus (Figure 3F, left panel). However, only SPP1− thalamic neurons (GFP+) sent projections to the cortical area, while projections from SPP1+ TRN neurons (RFP+) were largely absent (Figure 3F, right panel). Thus, TRN neurons derived from vThOs follow a similar connection preference as their in vivo counterparts and do not form synaptic connections with cortical neurons (Figures 3D and F). Collectively, these data suggest that neurons generated in vThOs exhibit functional properties and connection preferences similar to in vivo TRN neurons.
vThOs offer a platform to examine early perturbations in TRN-related neurodevelopmental disorders
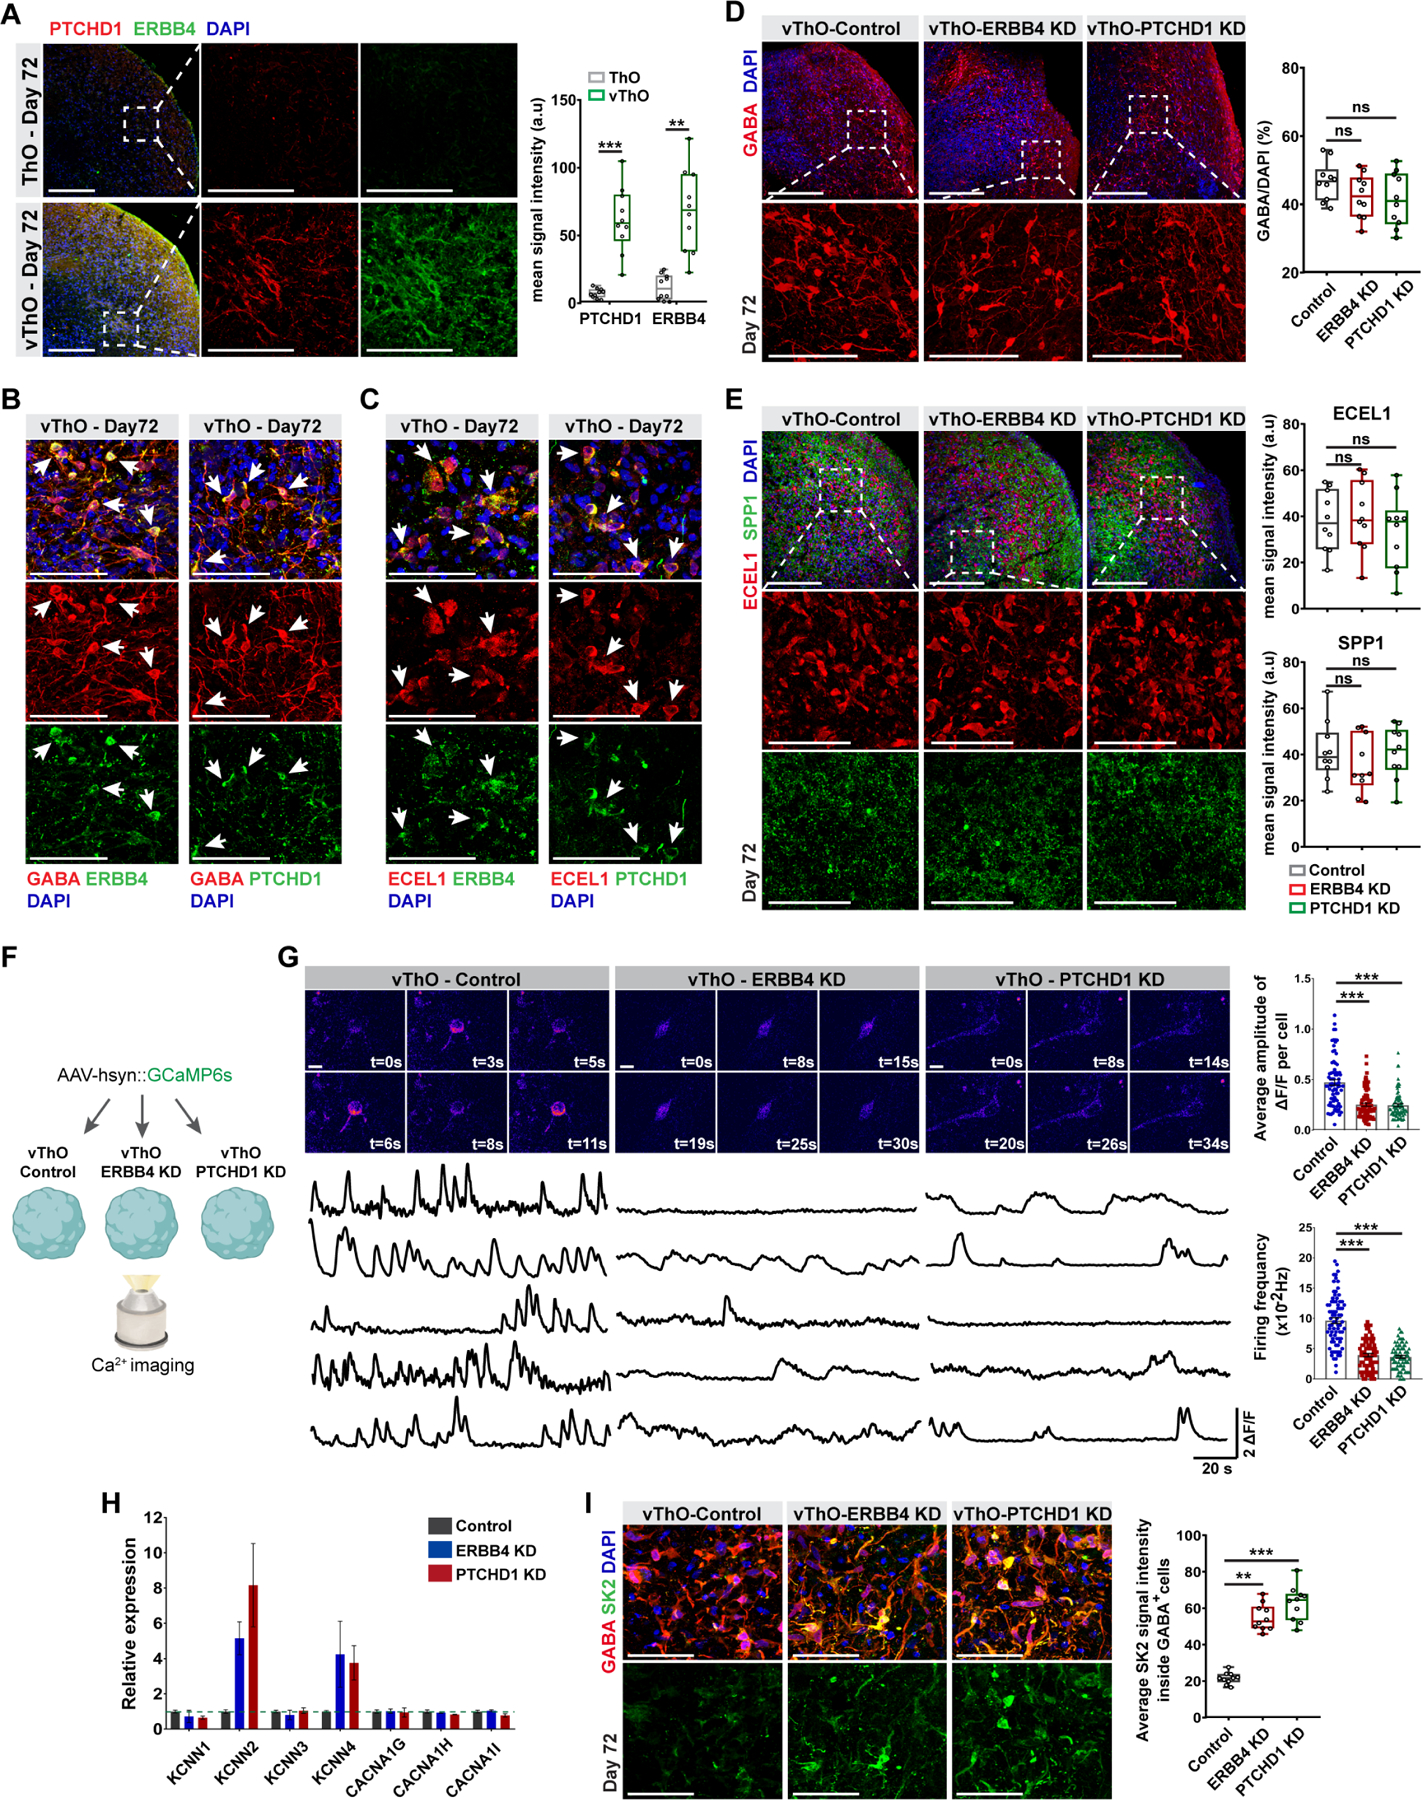
TRN neurons’ activity correlates with behavioral state, sensory detection, and attention.8–10 Consequently, TRN dysfunction has been linked to neurodevelopmental and neuropsychiatric diseases such as ASD, ADHD, and schizophrenia.6,46 Animal models demonstrated that deletion of Erbb4 or Ptchd1 in TRN resulted in sensory or attention deficits, respectively, due to dysregulated neuronal activity.11,12 In concert with the previous RNA in situ hybridization of the mouse brain, our scRNA-seq data demonstrated high expression of ERBB4 and PTCHD1 in the TRN cluster (Figure S4A). Moreover, immunostaining analysis revealed an almost exclusive expression of ERBB4 and PTCHD1 in vThOs (Figure 4A), and both proteins demonstrated a high level of expression in GABA+ inhibitory and ECEL1+ TRN neurons (Figures 4B–C). Using vThOs as a model system, we thus explored the functions of these genes during ventral thalamus development. We used CRISPRi (CRISPR interference) to suppress the expression of PTCHD1 and ERBB4. After testing the efficacy of designed gRNAs (Figures S4B-C), those with higher efficiency of gene repression were used to suppress the given gene in vThOs (Figure S4D). qPCR and immunostaining analyses demonstrated that vThOs with the given gRNA dramatically decreased the expression of target genes (Figures S4E-G). However, repression of neither ERBB4 nor PTCHD1 altered the level of TCF7L2+ thalamic, ECEL1/SPP1+ TRN, GABA+ inhibitory or vGLUT2+ excitatory neurons (Figures 4D–E and S4H-I). These data suggest that suppressing PTCHD1 or ERBB4 in vThOs has no significant effects on lineage specification of thalamic and TRN neurons as well as GABAergic and glutamatergic neuron differentiation.
Figure 4. Suppression of disease associated-, TRN enriched genes, ERBB4 and PTCHD1 results in reduced neuronal activity in vThOs.
(A) Left, co-staining for ERBB4 and PTCHD1 indicates enriched expression of these genes in vThOs at day 72. Right, mean signal intensity quantification for ERBB4 and PTCHD1 in ThOs and vThOs. Data represent the mean ± SEM (n=10 organoids, **p<0.01, ***p<0.001). An unpaired two-tail t-test with Welch’s correction was used for comparison.
(B) Co-staining of ERBB4 and PTCHD1 with inhibitory neuron marker GABA in vThOs at day 72. Arrows point co-localization of ERBB4-GABA and PTCHD1-GABA.
(C) Co-staining of ERBB4 and PTCHD1 with TRN neuron marker ECEL1 in vThOs at day 72. Arrows point co-localization of ERBB4-ECEL1 and PTCHD1-ECEL1.
(D) Left, immunostaining for inhibitory neuron marker GABA in control, ERBB4 knockdown (ERBB4-KD) and PTCHD1 knockdown (PTCHD1-KD) vThOs at day 72. Right, quantification of GABA+/DAPI+ cells in organoids indicates similar GABAergic neuron differentiation across different conditions. Data represent the mean ± SEM (n=10 organoids). One-way ANOVA with Dunnett’s multiple comparison test was used for comparison.
(E) Left, immunostaining for TRN neuron markers ECEL1 and SPP1 in control, ERBB4 knockdown (ERBB4-KD) and PTCHD1 knockdown (PTCHD1-KD) vThOs at day 72. Right, quantification of ECEL1 and SPP1 mean signal intensity indicating similar TRN neuron differentiation across different conditions. Data represent the mean ± SEM (n=10 organoids). One-way ANOVA with Dunnett’s multiple comparison test was used for comparison.
(F) Schematic diagram showing calcium activity recordings in vThO, vThO-ERBB4 KD, and vThO-PTCHD1 KD.
(G) Left, representative images demonstrating calcium activity traces observed from individual neurons in control, ERBB4-KD and PTCHD1-KD vThOs (day80-90). Right, quantifications of the average amplitude of 𝛥F/F per cell and calcium spike frequency of neurons in control, ERBB4-KD and PTCHD1-KD vThOs. Data represent the mean ± SEM (n=80 neurons per condition from 8 different organoids, ***p<0.001). One-way ANOVA with Dunnett’s multiple comparison test was used for comparison.
(H) qPCR analysis for expression levels of genes encoding for small conductance Ca2+-activated potassium channels (KCNN1-4) and T-type calcium channels (CACNA1G-I) in control, ERBB4 KD, and PTCHD1 KD vThOs.
(I) Left, co-staining of inhibitory neuron marker GABA and small conductance Ca2+-activated potassium channel 2 (SK2) in control, ERBB4 KD, and PTCHD1 KD vThOs. Right, quantification of average SK2 signal intensity in GABA+ inhibitory neurons. Note accumulation of SK2 in ERBB4 KD and PTCHD1 KD compared to control vThOs. Data represent the mean ± SEM (n=10 organoids). One-way ANOVA with Dunnett’s multiple comparison test was used for comparison. Scale bars represent 100 μm in A-E and H-I, and 10 μm in G.
Next, we examined the functional consequences of PTCHD1 or ERBB4 knockdown in vThOs with calcium activity assay (Figure 4F). In control vThOs, thalamic neurons displayed high-frequency calcium spikes (Figure 4G). However, neurons from vThO-PTCHD1 KD or vThO-ERBB4 KD showed prolonged inter-spike interval that in turn decreased neuronal activity with decreased average amplitude and frequency (Figure 4G). Since repetitive bursting observed in the TRN and other brain regions is known to depend on the interactions between T-type Ca2+ and small conductance calcium-activated K+ channels (SK),11,47,48 we next investigated possible dysregulation of these channels by PTCHD1 and ERBB4 knockdown in vThOs. Surprisingly, we observed increased expression of two genes, KCNN2 and 4, which encode for SK2 and SK4 channels when the expression of PTCHD1 and ERBB4 is repressed (Figure 4H). In support of this result, we also observed an accumulation of SK2 channels particularly in GABA+ inhibitory neurons in which PTCHD1 and ERBB4 are highly expressed (Figures 4I and 4B). Previous studies showed an inverse correlation between the expression level of SK channels and neural bursting activity. Inhibition of SK channel activity results in an increased incidence rate of bursting while gain-of-function of SK channels inversely causes diminished bursting activity similar to our observation in PTCHD1 and ERBB4 knockdown in vThOs.48–50 These results point to a possible common pathway downstream of PTCHD1 and ERBB4 that regulates the expression of SK2 and SK4 channels and hence neuronal activity. Overall, perturbation of TRN-related genes impairs neuronal functions in vThOs containing TRN-like cell clusters, extending similar observations made in animal studies11,12 to a human-specific model. Therefore, vThOs represent a reliable in vitro model to investigate human TRN development and function in physiological and disease contexts.
DISCUSSION
The thalamus is a sensory and motor relay center in the mammalian forebrain, containing several functionally distinct nuclei. As a part of the thalamic network, the thalamic reticular nucleus (TRN) laterally surrounds the core thalamic nuclei and exerts a highly specialized function by modulating information flow between these thalamic nuclei and the cortex.5 Due to this specialized function as a gatekeeper of information flow, TRN dysfunction has been implicated in multiple neurodevelopmental and psychiatric disorders.6 Therefore, we developed a protocol to generate ventralized thalamic organoids (vThOs) that incorporate TRN identity. Single-cell RNA profiling of vThOs revealed several transcriptionally distinct subpopulations in the TRN cell cluster that share marker expressions observed in the mouse TRN. Importantly, both single-cell transcriptome and corresponding immunohistochemistry analysis demonstrated non-overlapping SPP1+ and ECEL1+ cell populations in the TRN cluster, which is consistent with the transcriptional and cellular organization of the mouse TRN.32 Furthermore, neurons from vThOs exhibit unique firing properties reminiscent of the TRN neurons described in animal models. Finally, we showed reduced neuronal activity caused by perturbation of TRN-related, disease-linked genes ERBB4 and PTCHD1. Thus, vThOs offer a platform to study human-specific, nuclei-dependent cellular mechanisms underlying normal and abnormal development of the thalamus.
Tonic and burst firing are known to occur in TRN neurons from adult animals depending on their resting membrane potential.51 Our neuronal activity measurements from vThOs demonstrated a high tendency of these neurons to fire in bursts similar to in vivo TRN neurons. However, we failed to observe the synchronized and rhythmic bursting pattern that is known to occur in TRN neurons and is important to generate oscillatory activities in the thalamus.42 The lack of such an activity pattern may be due to the fact that vThOs resemble the developing thalamus, and TRN neurons within are not mature enough to produce advanced firing properties.17,41 Indeed, the electrophysiological properties of TRN neurons were generally examined in adult animals.5 Second, vThOs, unlike the developing brain, lack sensory inputs that may facilitate neuronal maturation and hence the emergence of mature activity patterns.15 Similarly, unlike their counterparts in the fetal brain, TRN neurons in vThOs do not form reciprocal connections with thalamocortical or corticothalamic circuits, which may further lead to diverse neuronal firing properties.52 Thus, future studies may adopt the fusion of multiple region-specific brain organoids to achieve further functional crosstalk and maturation for vThOs.17,45,53–55 Overall, emerging brain organoids with more defined subregional identities, including the vThOs, hold the potential to facilitate the modeling of the human brain at an ever-defined resolution.
Limitations of study
The present study used a limited number of human ESC lines. Future studies using a larger number of ESC and iPSC lines are needed to confirm the reliability and reproducibility of human thalamic organoid generation. Similarly, we used a CRISPR-based knockdown system for disease modeling, which needs to be further analyzed with other systems and patient-derived iPSCs. There are also inherent limitations to using brain organoids to precisely model human brain development and function in health and disease states. For example, the lack of immune cells and vascularization in brain organoids may cause significant changes in the normal developmental trajectory of neurons and may eventually hinder the precise modeling of disease progression. Also, since brain organoids are more similar to the developing brain than the adult postnatal brain, studying the mature functions of neurons may be challenging. Although we observed similar electrophysiological properties between in vitro TRN neurons and their in vivo counterparts, studying advanced firing properties as in animal studies may not be possible using vThOs.
STAR METHODS
RESOURCE AVAILABILITY
Lead contact
Further information and requests for reagents may be directed to, and will be fulfilled by the lead contact, Dr. In-Hyun Park (inhyun.park@yale.edu).
Materials availability
This study did not generate new unique reagents.
Data and code availability
RNA sequencing data have been deposited in Gene Expression Omnibus database and are publicly available as of the date of publication. Accession numbers are listed in the key resources table. This paper analyses existing, publicly available data. The accession numbers for the datasets are listed in the key resources table. This paper does not report original code. Any additional information required to reanalyze the data reported in this paper is available from the lead contact upon request.
Key Resources Table
| REAGENT or RESOURCE | SOURCE | IDENTIFIER |
|---|---|---|
| Antibodies | ||
| LHX2 | Invitrogen | Cat# PA5-78287 |
| LHX5 | Invitrogen | Cat# PA5-47828 |
| GABA | Invitrogen | Cat# PA5-32241 |
| vGLUT2 | Millipore | Cat# MAB5504 |
| GAD1/GAD67 | Invitrogen | Cat# MA5-24909 |
| GAD2/GAD65 | Invitrogen | Cat# PA5-22260 |
| ECEL1 | abcam | Cat# ab234710 |
| SPP1 | Invitrogen | Cat# MA5-17180 |
| PTCHD1 | Invitrogen | Cat# PA5-48191 |
| PTCHD1 | abcam | Cat# ab109407 |
| ERBB4 | Invitrogen | Cat# MA1-861 |
| DLX2 | Invitrogen | Cat# 702009 |
| TCF7L2 | Cell Signaling | Cat# 2569S |
| MAP2 | Millipore | Cat# MAB3418 |
| LHX1 | Origene | Cat# TA504527 |
| GEPHYRIN | R&D System | Cat# MAB7519 |
| SK2 | Millipore | Cat#MABN1832 |
| Chemicals, Peptides, and Recombinant Proteins | ||
| mTeSR1 | Stem Cell Technologies | Cat# 05875 |
| DMEM-F12 | Life Technologies | Cat# 11330057 |
| Neurobasal Media | Life Technologies | Cat# 2110349 |
| FBS | Life Technologies | Cat# 10437028 |
| Amino acids, non-essential | Life Technologies | Cat# 11140050 |
| Penicillin/Streptomycin | Life Technologies | Cat# 15140–122 |
| Glutamax | Life Technologies | Ca# 35050 |
| β-Mercaptoethanol | Sigma | Ca# M7522 |
| N2 | Life Technologies | Cat# 17502–048 |
| B27 | Life Technologies | Cat# 17504–044 |
| B27 supplement without vitamin A | Life Technologies | Cat# 12587010 |
| bFGF | Millipore | Cat# GF003AF |
| KnockOut Serum Replacement | Life Technologies | Cat# 10828–028 |
| HBSS | Life Technologies | Cat# 14170112 |
| Matrigel | BD | Cat# 354230 |
| Dextrose | Sigma | Cat# G7021 |
| Poly-D-Lysine | Xona | Cat# XC PDL |
| Y-27632 | Stem Cell Technologies | Cat# 72304 |
| Dispase (100ml) | Stem Cell Technologies | Cat# 07913 |
| Accutase (100ml) | Stem Cell Technologies | Cat# AT104 |
| LDN-193189 | Sigma | Cat# SML0559 |
| SB431542 | Abcam | Cat# ab120163 |
| BMP7 | GIBCO | Cat# PHC9544 |
| SHH | R&D Systems | Cat# 464-SH-200 |
| Puromycin | Sigma | Cat# P8833 |
| BDNF | Prepotech | Cat# 450–02 |
| Ascorbic acid | Sigma | Cat# A92902 |
| O.C.T compound | Tissue-Tek | Cat# 4583 |
| Bovine serum albumin | American Bioanalytical | Cat# AB01088 |
| ProLong Gold Antifade Reagent | ThermoFisher | Cat# P36930 |
| Critical Commercial Assays | ||
| Papain Dissociation System | Worthington Biochemical Corporation | Cat# LK003150 |
| Human Stem Cell Nucleofector Kit 1 | Lonza | Cat# VPH-5012 |
| RNeasy mini kit | QIAGEN | Cat# 74104 |
| RNase-Free DNase Set | QIAGEN | Cat# 79254 |
| iScript cDNA synthesis kit | Biorad | Cat# 1708891 |
| SsoFast EvaGreen Supermix | Biorad | Cat# 1725201 |
| Deposited Data | ||
| Raw and proposed scRNA-seq | This paper | GEO:GSE210720 |
| scRNA-seq for human fetal dorsal and ventral thalamus | 35 | https://data.nemoarchive.org/biccn/grant/u01_devhu/kriegstein/transcriptome/scell/10x_v2/human/processed/counts/ |
| H3K27ac ChIP-seq in distinct human brain regions | 28 | GEO: GSE40465 |
| Reference transcriptome hg19 | N/A | https://support.10xgenomics.com/ |
| RNA in situ hybridization for mouse fetal thalamus | 56 | Allen developing mouse brain atlas |
| Experimental Models: Cell Lines | ||
| HES-3 NKX2-1GFP/w | Elefanty lab, Monash University, Australia | https://www.ncbi.nlm.nih.gov/pubmed/21425409 |
| H1 hESC line | WiCell | https://www.ncbi.nlm.nih.gov/pubmed/9804556/ |
| H1-AAVS1-CAG-GFP | This paper | 17 |
| HES-3-BC4 | This paper | 57 |
| Oligonucleotides | ||
| See Table S1 for oligonucleotides used in this paper | This paper | N/A |
| Other | ||
| U-bottom ultra-low-attachment 96-well plate | Corning | CLS7007-24EA |
| Ultra-low-attachment 6-well plate | Corning | CLS3471-24EA |
| Ultra-low-attachment 24-well plate | Corning | 3473 |
| 35 mm dish (with glass bottom) | MatTek | P35GC-0-10-C |
| Orbital shaker | IKA | KS260 |
| Nucleofector | Lonza | AAB-1001 |
| Software and Algorithms | ||
| CellRanger (v3.0.2) | 10x Genomics | https://support.10xgenomics.com/single-cell-gene-expression/software/downloads/latest |
| Seurat (v3.0.2) | 58 | https://satijalab.org/seurat/ |
| Monocle (v2.99.3) | 30 | http://cole-trapnell-lab.github.io/monocle-release/ |
| GOstats (v2.46.0) | 59 | https://www.bioconductor.org/packages/release/bioc/html/GOstats.html |
| Bioconductor (v3.8) | N/A | https://www.bioconductor.org/ |
| R (v3.5.0) | N/A | https://www.r-project.org/ |
| GSEA (v4.0.2) | 60 | https://software.broadinstitute.org/gsea/index.jsp |
EXPERIMENTAL MODEL AND SUBJECT DETAILS
Animals
The Rag2−/− GammaC−/− mice were purchased from Jackson Laboratories. All animal experiments described in this study were approved by the Institutional Animal Care & Use Committee (IACUC) of Yale University.
hESCs culture
H1 hESCs and HES-3 NKX2-1GFP/w and BC4 hESCs were cultured on Matrigel (BD Biosciences) coated cell culture dishes with mTeSR1 media (Stem Cell Technologies). hESCs were passaged every week by treatment with Dispase (0.83 U/ml, Stem Cell Technologies). All experiments including hESCs were approved by Yale Embryonic Stem Cell Research Oversight (ESCRO).
Organoid details
| Experiments | Samples | Sex | Culture Stages (days) |
|---|---|---|---|
| Figure 1, 2, S1 and S2: scRNA-seq, staining | ThO, ThO with different SHH treatment and vThO | Male and female | 72 |
| Figure 3: Calcium and patch clamp recordings | ThO and vThO | Male and female | 80 ~90 |
| Figure 3: Dissociation of thalamic neurons | vThO | Female | 90 |
| Figure S3: qPCR and staining | ThO and vThO | Male and female | 72 |
| Figure 4 and S4: Calcium recordings | ThO and vThO | Female | 80 ~90 |
| Figure 4 and S4: staining | ThO and vThO | Male and female | 72 |
| Figure S4: qPCR | vThO | Female | 50 |
METHOD DETAILS
Generation of human thalamic and ventral thalamic organoids (ThO and vThO)
ThOs were generated as reported earlier.17 Briefly, 9000 of Accutase-dissociated hESC cells were plated into a well of U-bottom ultra-low-attachment 96-well plate in neural induction media (DMEM-F12, 15% (v/v) KSR, 5% (v/v) heat-inactivated FBS (Life Technologies), 1% (v/v) Glutamax, 1% (v/v) MEM-NEAA, 100 μM β-Mercaptoethanol) supplemented with 10 μM SB-431542, 100 nM LDN-193189, 4 μg/ml insulin and 50 μM Y27632. FBS and Y27632 were removed from day 2 and 4, respectively. The media was replenished every other day until day 8, when organoids were transferred to the ultra-low-attachment 6-well plate. The organoids were cultured in spinning thalamic patterning media with minus vitamin A (1:1 mixture of DMEM-F12, 0.15% (w/v) Dextrose, 1% (v/v) N2 supplement, 2% (v/v) B27 supplement without vitamin A, 100 μM β-Mercaptoethanol, 30 ng/ml BMP7 and 1 μM PD325901). The media was replenished every other day until day 16, where media was switched to facilitate differentiation and maturation (1:1 mixture of DMEM-F12 and Neurobasal media, 0.5% (v/v) N2 supplement, 1% (v/v) B27 supplement, 0.5% (v/v) MEM-NEAA, 1% (v/v) Glutamax, 0.025% (v/v) Insulin, 50 μM β-Mercaptoethanol, and 1% (v/v) Penicillin/Streptomycin) supplemented with 20 ng/ml BDNF and 200 μM ascorbic acid.
For vThO generation, 100 ng/ml SHH (c25II) was administered for 8 days (day 8–16, 12–20 and 14–22), and the optimum condition was SHH treatment from day 14 to 22. The differentiation media was changed every other day until day 25 and every 4 days thereafter. For H1 cells, 20 ng/ml bFGF was supplemented to enhance cell growth.
Immunofluorescence staining
For organoids, residual media was removed by washing with PBS. As described earlier,57 all hCOs were fixed in 4% paraformaldehyde (PFA) at 4°C overnight. After washing with PBS three times, they were incubated in 30% sucrose solution for 2 days at 4°C. Organoids were embedded in O.C.T in base molds on dry ice and sectioned for 40-μm. The organoid blocks were further stored at −80°C. After sections were dried, they were incubated with 0.1% Triton-100 for 15 min and further blocked with 3% bovine serum albumin (BSA) for 2 hours at RT. Then, the primary antibody, diluted in 3% BSA, incubation is performed at 4°C overnight. After washing with PBS, organoids were incubated with Alexa Fluor dyes (1:500) for 2 hours and following nuclei staining with DAPI (1:1000) for 10 minutes at RT. Finally, slides were mounted with ProLong Gold Antifade Reagent, and images were taken with Leica TCS SP8 confocal microscope.
Real-time quantitative PCR (qPCR)
Total RNA was isolated from the whole organoids via RNeasy Mini Kit (Qiagen). 1 μg RNA was converted to cDNA using iScript Select cDNA Synthesis Kit. For the quantification of gene expression, qPCR was carried out on the CFX96 Real-Time PCR system (Biorad) using the SsoFast EvaGreen Supermix (Biorad). The PCR conditions were: 95 °C for 15 min, followed by 40 two-step cycles at 94 °C for 10 s and 60 °C for 45 s. A list of primers used in this study is presented in Table S1.
Data processing of scRNA-seq
scRNA-seq reads were aligned to hg19 human genome and counted with Ensembl genes by count function of CellRanger (v3.0.2) with default parameters. UMI count data from each library was harmonized by Seurat (v3.0.2).61 First, cells with more than 500 genes and genes expressed in more than five cells were retained for subsequent analyses. After normalizing raw UMI count to total UMI count, highly variable genes were identified by variance stabilizing transformation with 0.3 loess parameter. Cell pair anchoring was implemented by top 2,500 variable genes with 30 dimensions of canonical correlation analysis. After scaling gene expression values across all integrated cells, we performed dimensional reduction using principal component analysis (PCA). Individual cells were visualized into two-dimensional UMAP space using from 1st to 30th PCs. Graph-based clustering was then implemented with shared nearest neighbor method from 1st to 30th PCs and 0.8 resolution value. Differentially-expressed genes (DEGs) in each cluster was identified with more than 1.25 fold change and p<0.05 by two-sided unpaired T test. Gene Ontology analysis was performed to the DEGs by GOstats Bioconductor package (v2.46.0). False discovery rate was adjusted by p.adjust function in R with “method=”BH”” parameter.
Each cluster was labeled systematically with unique markers and Gene Ontology. First, we classified neuronal and non-neuronal clusters with expression of neuronal growth cone markers (STMN, GAP43 and DCX) and early neurogenesis markers (VIM, HES1 or SOX2). Then, the neuronal clusters were segregated into excitatory (ExN) and inhibitory thalamic clusters (IN) by glutamate transporters (SLC17A6 and SLC17A7) and GABA transporters/Glutamate decarboxylase (SLC32A1, GAD1 and GAD2), respectively. Neuronal progenitor cells (NPCs) were categorized by high expression of genes related to “mitotic nuclear division (GO:0007067)”. We associated each thalamic progenitor subpopulation (Th.P and epiTh.P) with a subset of differentially expressed genes based on known markers and a correlation-based hierarchical clustering of the genes, defined previously.39 Three non-neuronal clusters with high expression (FDR < 0.05) of genes related to “astrocyte differentiation (GO:0048708)” were assigned as astrocyte clusters (AS). Glia progenitor cell (GPC) clusters display significant enrichment of “gliogenesis (GO:0042063)” without the enrichment of “astrocyte differentiation” and HOPX expression. Two non-neuronal cluster were characterized by ependymal cell markers (CLIC6, FOLR1, and CXCL14) and one non-neuronal cluster was characterized by endothelial cell marker PDGFRA. Four neuronal clusters were predominantly generated from ventral thalamic organoids. In particular, these clusters were characterized by TRN-specific markers (ECEL1, ESRRG, ELMOD1, SST and RORB). The one rest cluster does not show any significant GO terms and labeled as unassigned cluster (UN).
Active genes in human thalamic regions were defined as nearest genes to H3K27ac ChIP-seq peaks (GSE40465).28 Unique active genes in each region were collected as region-specific gene sets. In each scRNA-seq library, genes were ranked by relative expression to average of all libraries. GSEA was conducted by GSEA software (v4.0.3) without collapse of gene sets.60
Developmental pseudotime was predicted by monocle (v2.99.3) in Bioconductor package.30 Instead of the normalization in monocle tool, we used Seurat-based PCA projection as “normalized_data_projection”. Transposition of Seurat-based UMAP projection was used as “reduceDimS”, “reduceDimA” and “reduceDimK” slot, whereas transposition of the PCA projection was used as “reducedDimW” slot. Developmental graph was constructed by SimplePPT method with “close_loop=T,prune_graph=T,euclidean_distance_ratio=10,geodestic_distance_ratio=0.1,minimal_branch_len = 0.5”. Then, pseudotime was calculated by selecting “NPC” as a root.
Single-cell transcriptome profiles of human fetal dorsal and ventral thalamus were downloaded from NEMO archive (https://data.nemoarchive.org/biccn/grant/u01_devhu/kriegstein/transcriptome/scell/10x_v2/human/processed/counts/).35 Data integration and batch effect normalization was implemented by Seurat as described above.61 Ventral thalamus gene signatures were identified by global comparison between human fetal dorsal and ventral thalamus (>1.25 fold change and T test p-value < 0.05). Enrichment of ventral thalamus gene signatures in vThO was analyzed by GSEA software with default parameters. Then, cell trajectory analysis by monocle was performed in cells in inhibitory neuron clusters to investigate the maturation of TRN inhibitory neurons.30 Differentially-expressed genes along peudotime was identified by Pearson correlation, which was calculated by cor function in R. Significant Gene Ontology terms were identified by GSEA software with genes sorted by Pearson correlation coefficient.
Transplantation of SPP1+ and SPP1− thalamic neurons into mouse brain
SPP1+ neurons were isolated from dissociated vThOs on day 75. Briefly, dissociated cells were incubated with APC-SPP1 antibody for 30 min. Then, SPP1+ and SPP1− neurons were sorted with FACS and plated on Matrigel-coated plates within thalamic differentiation media. After 2 days of culturing, AAV-RFP and AAV-GFP vectors were transduced into SPP1+ and SPP1− neurons, respectively. All pooled neurons suspended in PBS (100.000 cells/μl) were transplanted into mice brain as previously described 62. After mice were anesthetized by hypothermia, 100K thalamic neuron suspension (10 μM) was bilaterally injected into brains of either male or female mice at post-natal day 4. Then, mice were recovered on a heating pad at 37 °C. After 35-days of neuron transplantation, mice were perfused with PBS and 4% PFA. Then, explanted brain tissues were further fixed and sliced for immunofluorescence staining.
Viral labeling and neuronal activity imaging
As we described previously,45,57 organoids were transferred to a 96-well plate for viral infection. After incubation in 300 μl neural media containing AAV.hSyn.flex.Voltron + AAV.hSyn.Cre (Addgene, 119036 and 105553) or AAV. hSyn. GCaMP6s.WPRE.SV40 (Addgene, 100843) for 24 h, organoids were transferred to 6-well plate in fresh medium. After 10 to 15 days of virus transduction, the intact organoids were used for voltage and calcium imaging. Time-lapse images were taken with Leica TCS SP8 confocal microscope at a speed of 50 frames/s for voltage imaging and 5 frames/s for calcium imaging. To obtain single neuron voltage and calcium traces, a region of interest (ROI) was manually drawn around neuronal cell bodies and mean fluorescence intensities over time was calculated using Fiji software.63 The initial trace (X0) is the mean intensity over the ROI in time. X0 was fit with a piecewise linear curve using a Savitzky-Golay filter with a window size of 10 s to estimate the slow baseline fluctuations, F0. We calculated ΔF/F as.
QUANTIFICATION AND STATISTICAL ANALYSIS
Data are presented as mean ± SEM. An unpaired two-tail t-test with Welch’s correction was used for the comparison of two groups, and one-way ANOVA with Dunnett’s multiple comparison test was used for the comparison of three or more groups to determine the statistical significance (GraphPad Prism 8.2.0). Statistical tests and biological replicates for each experiment are presented in the figure legends. Statistical significance is presented with asterisks as follows: *p<0.05, **p<0.01, ***p<0.001.
Supplementary Material
Highlights.
A protocol for ventral thalamic organoids (vThOs) with discrete nuclei identities.
vThOs exhibit cellular and functional features akin to thalamic reticular nucleus.
Similar molecular features between vThOs and human ventral thalamus.
Perturbation in nuclei-specific, disease-linked genes impairs neural functions in vThOs.
Acknowledgements
I.-H. P. was partly supported by NIH (R01MH118344-01A1, R01MH118554-01A1), CSCRF (14-SCC-YALE-01, 16-RMB-YALE-04), Kavli Foundation, Simons Foundation, and Nomis foundation. Computation time was provided by Yale University Biomedical High-Performance Computing Center.
Footnotes
Publisher's Disclaimer: This is a PDF file of an unedited manuscript that has been accepted for publication. As a service to our customers we are providing this early version of the manuscript. The manuscript will undergo copyediting, typesetting, and review of the resulting proof before it is published in its final form. Please note that during the production process errors may be discovered which could affect the content, and all legal disclaimers that apply to the journal pertain.
Decleration of interest
The authors declare no competing interests.
REFERENCES
- 1.Xiang Y, Cakir B, and Park IH (2021). Deconstructing and reconstructing the human brain with regionally specified brain organoids. Semin Cell Dev Biol 111, 40–51. 10.1016/j.semcdb.2020.05.023. [DOI] [PubMed] [Google Scholar]
- 2.Susaimanickam PJ, Kiral FR, and Park IH (2022). Region Specific Brain Organoids to Study Neurodevelopmental Disorders. Int J Stem Cells 15, 26–40. 10.15283/ijsc22006. [DOI] [PMC free article] [PubMed] [Google Scholar]
- 3.Huang WK, Wong SZH, Pather SR, Nguyen PTT, Zhang F, Zhang DY, Zhang Z, Lu L, Fang W, Chen L, et al. (2021). Generation of hypothalamic arcuate organoids from human induced pluripotent stem cells. Cell Stem Cell 28, 1657–1670 e1610. 10.1016/j.stem.2021.04.006. [DOI] [PMC free article] [PubMed] [Google Scholar]
- 4.Halassa MM, and Sherman SM (2019). Thalamocortical Circuit Motifs: A General Framework. Neuron 103, 762–770. 10.1016/j.neuron.2019.06.005. [DOI] [PMC free article] [PubMed] [Google Scholar]
- 5.Roy DS, Zhang Y, Halassa MM, and Feng G (2022). Thalamic subnetworks as units of function. Nat Neurosci 25, 140–153. 10.1038/s41593-021-00996-1. [DOI] [PMC free article] [PubMed] [Google Scholar]
- 6.Ferrarelli F, and Tononi G (2011). The Thalamic Reticular Nucleus and Schizophrenia. Schizophrenia Bull 37, 306–315. 10.1093/schbul/sbq142. [DOI] [PMC free article] [PubMed] [Google Scholar]
- 7.McAlonan K, Cavanaugh J, and Wurtz RH (2006). Attentional modulation of thalamic reticular neurons. J Neurosci 26, 4444–4450. 10.1523/JNEUROSCI.5602-05.2006. [DOI] [PMC free article] [PubMed] [Google Scholar]
- 8.Wimmer RD, Schmitt LI, Davidson TJ, Nakajima M, Deisseroth K, and Halassa MM (2015). Thalamic control of sensory selection in divided attention. Nature 526, 705–709. 10.1038/nature15398. [DOI] [PMC free article] [PubMed] [Google Scholar]
- 9.Marlinski V, Sirota MG, and Beloozerova IN (2012). Differential gating of thalamocortical signals by reticular nucleus of thalamus during locomotion. J Neurosci 32, 15823–15836. 10.1523/JNEUROSCI.0782-12.2012. [DOI] [PMC free article] [PubMed] [Google Scholar]
- 10.Halassa MM, Siegle JH, Ritt JT, Ting JT, Feng G, and Moore CI (2011). Selective optical drive of thalamic reticular nucleus generates thalamic bursts and cortical spindles. Nat Neurosci 14, 1118–1120. 10.1038/nn.2880. [DOI] [PMC free article] [PubMed] [Google Scholar]
- 11.Wells MF, Wimmer RD, Schmitt LI, Feng G, and Halassa MM (2016). Thalamic reticular impairment underlies attention deficit in Ptchd1(Y/-) mice. Nature 532, 58–63. 10.1038/nature17427. [DOI] [PMC free article] [PubMed] [Google Scholar]
- 12.Ahrens S, Jaramillo S, Yu K, Ghosh S, Hwang GR, Paik R, Lai C, He M, Huang ZJ, and Li B (2015). ErbB4 regulation of a thalamic reticular nucleus circuit for sensory selection. Nat Neurosci 18, 104–111. 10.1038/nn.3897. [DOI] [PMC free article] [PubMed] [Google Scholar]
- 13.Clevers H (2016). Modeling Development and Disease with Organoids. Cell 165, 1586–1597. 10.1016/j.cell.2016.05.082. [DOI] [PubMed] [Google Scholar]
- 14.Lancaster MA, and Knoblich JA (2014). Organogenesis in a dish: modeling development and disease using organoid technologies. Science 345, 1247125. 10.1126/science.1247125. [DOI] [PubMed] [Google Scholar]
- 15.Pasca SP (2018). The rise of three-dimensional human brain cultures. Nature 553, 437–445. 10.1038/nature25032. [DOI] [PubMed] [Google Scholar]
- 16.Chiaradia I, and Lancaster MA (2020). Brain organoids for the study of human neurobiology at the interface of in vitro and in vivo. Nature Neuroscience 23, 1496–1508. 10.1038/s41593-020-00730-3. [DOI] [PubMed] [Google Scholar]
- 17.Xiang Y, Tanaka Y, Cakir B, Patterson B, Kim KY, Sun P, Kang YJ, Zhong M, Liu X, Patra P, et al. (2019). hESC-Derived Thalamic Organoids Form Reciprocal Projections When Fused with Cortical Organoids. Cell Stem Cell 24, 487–497 e487. 10.1016/j.stem.2018.12.015. [DOI] [PMC free article] [PubMed] [Google Scholar]
- 18.Szabo NE, Zhao T, Zhou X, and Alvarez-Bolado G (2009). The role of Sonic hedgehog of neural origin in thalamic differentiation in the mouse. J Neurosci 29, 2453–2466. 10.1523/JNEUROSCI.4524-08.2009. [DOI] [PMC free article] [PubMed] [Google Scholar]
- 19.Jeong Y, Dolson DK, Waclaw RR, Matise MP, Sussel L, Campbell K, Kaestner KH, and Epstein DJ (2011). Spatial and temporal requirements for sonic hedgehog in the regulation of thalamic interneuron identity. Development 138, 531–541. 10.1242/dev.058917. [DOI] [PMC free article] [PubMed] [Google Scholar]
- 20.Vue TY, Bluske K, Alishahi A, Yang LL, Koyano-Nakagawa N, Novitch B, and Nakagawa Y (2009). Sonic hedgehog signaling controls thalamic progenitor identity and nuclei specification in mice. J Neurosci 29, 4484–4497. 10.1523/JNEUROSCI.0656-09.2009. [DOI] [PMC free article] [PubMed] [Google Scholar]
- 21.Kiecker C, and Lumsden A (2004). Hedgehog signaling from the ZLI regulates diencephalic regional identity. Nature Neuroscience 7, 1242–1249. 10.1038/nn1338. [DOI] [PubMed] [Google Scholar]
- 22.Nakagawa Y, and Shimogori T (2012). Diversity of thalamic progenitor cells and postmitotic neurons. Eur J Neurosci 35, 1554–1562. 10.1111/j.1460-9568.2012.08089.x. [DOI] [PubMed] [Google Scholar]
- 23.Nakagawa Y (2019). Development of the thalamus: From early patterning to regulation of cortical functions. Wiley Interdiscip Rev Dev Biol 8, e345. 10.1002/wdev.345. [DOI] [PubMed] [Google Scholar]
- 24.Burgunder JM, Heyberger B, and Lauterburg T (1999). Thalamic reticular nucleus parcellation delineated by VIP and TRH gene expression in the rat. J Chem Neuroanat 17, 147–152. 10.1016/s0891-0618(99)00033-2. [DOI] [PubMed] [Google Scholar]
- 25.Miquelajauregui A, Sandoval-Schaefer T, Martinez-Armenta M, Perez-Martinez L, Carabez A, Zhao Y, Heide M, Alvarez-Bolado G, and Varela-Echavarria A (2015). LIM homeobox protein 5 (Lhx5) is essential for mamillary body development. Front Neuroanat 9, 136. 10.3389/fnana.2015.00136. [DOI] [PMC free article] [PubMed] [Google Scholar]
- 26.Nagalski A, Puelles L, Dabrowski M, Wegierski T, Kuznicki J, and Wisniewska MB (2016). Molecular anatomy of the thalamic complex and the underlying transcription factors. Brain Struct Funct 221, 2493–2510. 10.1007/s00429-015-1052-5. [DOI] [PMC free article] [PubMed] [Google Scholar]
- 27.Shiraishi A, Muguruma K, and Sasai Y (2017). Generation of thalamic neurons from mouse embryonic stem cells. Development 144, 1211–1220. 10.1242/dev.144071. [DOI] [PubMed] [Google Scholar]
- 28.Vermunt MW, Reinink P, Korving J, de Bruijn E, Creyghton PM, Basak O, Geeven G, Toonen PW, Lansu N, Meunier C, et al. (2014). Large-scale identification of coregulated enhancer networks in the adult human brain. Cell Rep 9, 767–779. 10.1016/j.celrep.2014.09.023. [DOI] [PubMed] [Google Scholar]
- 29.Clegg JM, Li ZW, Molinek M, Caballero IM, Manuel MN, and Price DJ (2015). Pax6 is required intrinsically by thalamic progenitors for the normal molecular patterning of thalamic neurons but not the growth and guidance of their axons. Neural Dev 10. ARTN 26. 10.1186/s13064-015-0053-7. [DOI] [PMC free article] [PubMed] [Google Scholar]
- 30.Cao JY, Spielmann M, Qiu XJ, Huang XF, Ibrahim DM, Hill AJ, Zhang F, Mundlos S, Christiansen L, Steemers FJ, et al. (2019). The single-cell transcriptional landscape of mammalian organogenesis. Nature 566, 496-+. 10.1038/s41586-019-0969-x. [DOI] [PMC free article] [PubMed] [Google Scholar]
- 31.Darmanis S, Sloan SA, Zhang Y, Enge M, Caneda C, Shuer LM, Hayden Gephart MG, Barres BA, and Quake SR (2015). A survey of human brain transcriptome diversity at the single cell level. Proc Natl Acad Sci U S A 112, 7285–7290. 10.1073/pnas.1507125112. [DOI] [PMC free article] [PubMed] [Google Scholar]
- 32.Li Y, Lopez-Huerta VG, Adiconis X, Levandowski K, Choi S, Simmons SK, Arias-Garcia MA, Guo B, Yao AY, Blosser TR, et al. (2020). Distinct subnetworks of the thalamic reticular nucleus. Nature 583, 819–824. 10.1038/s41586-020-2504-5. [DOI] [PMC free article] [PubMed] [Google Scholar]
- 33.Scholpp S, and Lumsden A (2010). Building a bridal chamber: development of the thalamus. Trends Neurosci 33, 373–380. 10.1016/j.tins.2010.05.003. [DOI] [PMC free article] [PubMed] [Google Scholar]
- 34.Nakagawa Y, and O’Leary DDM (2001). Combinatorial expression patterns of LIM-Homeodomain and other regulatory genes parcellate developing thalamus. The Journal of Neuroscience 21, 2711–2725. [DOI] [PMC free article] [PubMed] [Google Scholar]
- 35.Eze UC, Bhaduri A, Haeussler M, Nowakowski TJ, and Kriegstein AR (2021). Single-cell atlas of early human brain development highlights heterogeneity of human neuroepithelial cells and early radial glia. Nat Neurosci 24, 584–594. 10.1038/s41593-020-00794-1. [DOI] [PMC free article] [PubMed] [Google Scholar]
- 36.Yen CT, Conley M, Hendry SH, and Jones EG (1985). The morphology of physiologically identified GABAergic neurons in the somatic sensory part of the thalamic reticular nucleus in the cat. J Neurosci 5, 2254–2268. [DOI] [PMC free article] [PubMed] [Google Scholar]
- 37.Deleuze C, and Huguenard JR (2006). Distinct electrical and chemical connectivity maps in the thalamic reticular nucleus: potential roles in synchronization and sensation. J Neurosci 26, 8633–8645. 10.1523/JNEUROSCI.2333-06.2006. [DOI] [PMC free article] [PubMed] [Google Scholar]
- 38.Saunders A, Macosko EZ, Wysoker A, Goldman M, Krienen FM, de Rivera H, Bien E, Baum M, Bortolin L, Wang S, et al. (2018). Molecular Diversity and Specializations among the Cells of the Adult Mouse Brain. Cell 174, 1015–1030 e1016. 10.1016/j.cell.2018.07.028. [DOI] [PMC free article] [PubMed] [Google Scholar]
- 39.Govek KW, Chen S, Sgourdou P, Yao Y, Woodhouse S, Chen T, Fuccillo MV, Epstein DJ, and Camara PG (2022). Combined single-cell RNA-seq profiling and enhancer editing reveals critical spatiotemporal controls over thalamic nuclei formation in the murine embryo. bioRxiv, 2022.2002.2018.481097 10.1101/2022.02.18.481097. [DOI]
- 40.Martinez-Garcia RI, Voelcker B, Zaltsman JB, Patrick SL, Stevens TR, Connors BW, and Cruikshank SJ (2020). Two dynamically distinct circuits drive inhibition in the sensory thalamus (vol 583, pg 813, 2020). Nature 585, E13–E13. 10.1038/s41586-020-2680-3. [DOI] [PMC free article] [PubMed] [Google Scholar]
- 41.Tanaka Y, Cakir B, Xiang YF, Sullivan GJ, and Park IH (2020). Synthetic Analyses of Single-Cell Transcriptomes from Multiple Brain Organoids and Fetal Brain. Cell Reports 30, 1682-+. 10.1016/j.celrep.2020.01.038. [DOI] [PMC free article] [PubMed] [Google Scholar]
- 42.Halassa MM, and Acsady L (2016). Thalamic Inhibition: Diverse Sources, Diverse Scales. Trends Neurosci 39, 680–693. 10.1016/j.tins.2016.08.001. [DOI] [PMC free article] [PubMed] [Google Scholar]
- 43.Fogerson PM, and Huguenard JR (2016). Tapping the Brakes: Cellular and Synaptic Mechanisms that Regulate Thalamic Oscillations. Neuron 92, 687–704. 10.1016/j.neuron.2016.10.024. [DOI] [PMC free article] [PubMed] [Google Scholar]
- 44.Abdelfattah AS, Kawashima T, Singh A, Novak O, Liu H, Shuai YC, Huang YC, Campagnola L, Seeman SC, Yu JN, et al. (2019). Bright and photostable chemigenetic indicators for extended in vivo voltage imaging. Science 365, 699-+. 10.1126/science.aav6416. [DOI] [PubMed] [Google Scholar]
- 45.Xiang Y, Tanaka Y, Patterson B, Kang YJ, Govindaiah G, Roselaar N, Cakir B, Kim KY, Lombroso AP, Hwang SM, et al. (2017). Fusion of Regionally Specified hPSC-Derived Organoids Models Human Brain Development and Interneuron Migration. Cell Stem Cell 21, 383–398 e387. 10.1016/j.stem.2017.07.007. [DOI] [PMC free article] [PubMed] [Google Scholar]
- 46.Halassa MM, Chen Z, Wimmer RD, Brunetti PM, Zhao S, Zikopoulos B, Wang F, Brown EN, and Wilson MA (2014). State-dependent architecture of thalamic reticular subnetworks. Cell 158, 808–821. 10.1016/j.cell.2014.06.025. [DOI] [PMC free article] [PubMed] [Google Scholar]
- 47.Shao J, Liu Y, Gao D, Tu J, and Yang F (2021). Neural Burst Firing and Its Roles in Mental and Neurological Disorders. Front Cell Neurosci 15, 741292. 10.3389/fncel.2021.741292. [DOI] [PMC free article] [PubMed] [Google Scholar]
- 48.Cueni L, Canepari M, Lujan R, Emmenegger Y, Watanabe M, Bond CT, Franken P, Adelman JP, and Luthi A (2008). T-type Ca2+ channels, SK2 channels and SERCAs gate sleep-related oscillations in thalamic dendrites. Nat Neurosci 11, 683–692. 10.1038/nn.2124. [DOI] [PubMed] [Google Scholar]
- 49.Hopf FW, Martin M, Chen BT, Bowers MS, Mohamedi MM, and Bonci A (2007). Withdrawal from intermittent ethanol exposure increases probability of burst firing in VTA neurons in vitro. J Neurophysiol 98, 2297–2310. 10.1152/jn.00824.2007. [DOI] [PubMed] [Google Scholar]
- 50.Ritter-Makinson S, Clemente-Perez A, Higashikubo B, Cho FS, Holden SS, Bennett E, Chkhaidze A, Eelkman Rooda OHJ, Cornet MC, Hoebeek FE, et al. (2019). Augmented Reticular Thalamic Bursting and Seizures in Scn1a-Dravet Syndrome. Cell Rep 26, 54–64 e56. 10.1016/j.celrep.2018.12.018. [DOI] [PMC free article] [PubMed] [Google Scholar]
- 51.Steriade M, McCormick DA, and Sejnowski TJ (1993). Thalamocortical oscillations in the sleeping and aroused brain. Science 262, 679–685. 10.1126/science.8235588. [DOI] [PubMed] [Google Scholar]
- 52.Nakajima M, and Halassa MM (2017). Thalamic control of functional cortical connectivity. Curr Opin Neurobiol 44, 127–131. 10.1016/j.conb.2017.04.001. [DOI] [PMC free article] [PubMed] [Google Scholar]
- 53.Bagley JA, Reumann D, Bian S, Levi-Strauss J, and Knoblich JA (2017). Fused cerebral organoids model interactions between brain regions. Nat Methods 14, 743–751. 10.1038/nmeth.4304. [DOI] [PMC free article] [PubMed] [Google Scholar]
- 54.Birey F, Andersen J, Makinson CD, Islam S, Wei W, Huber N, Fan HC, Metzler KRC, Panagiotakos G, Thom N, et al. (2017). Assembly of functionally integrated human forebrain spheroids. Nature 545, 54–59. 10.1038/nature22330. [DOI] [PMC free article] [PubMed] [Google Scholar]
- 55.Miura Y, Li MY, Revah O, Yoon SJ, Narazaki G, and Pasca SP (2022). Engineering brain assembloids to interrogate human neural circuits. Nat Protoc 17, 15–35. 10.1038/s41596-021-00632-z. [DOI] [PubMed] [Google Scholar]
- 56.Sunkin SM, Ng L, Lau C, Dolbeare T, Gilbert TL, Thompson CL, Hawrylycz M, and Dang C (2013). Allen Brain Atlas: an integrated spatio-temporal portal for exploring the central nervous system. Nucleic Acids Res 41, D996–D1008. 10.1093/nar/gks1042. [DOI] [PMC free article] [PubMed] [Google Scholar]
- 57.Cakir B, Xiang Y, Tanaka Y, Kural MH, Parent M, Kang YJ, Chapeton K, Patterson B, Yuan Y, He CS, et al. (2019). Engineering of human brain organoids with a functional vascular-like system. Nat Methods 16, 1169–1175. 10.1038/s41592-019-0586-5. [DOI] [PMC free article] [PubMed] [Google Scholar]
- 58.Macosko EZ, Basu A, Satija R, Nemesh J, Shekhar K, Goldman M, Tirosh I, Bialas AR, Kamitaki N, Martersteck EM, et al. (2015). Highly Parallel Genome-wide Expression Profiling of Individual Cells Using Nanoliter Droplets. Cell 161, 1202–1214. 10.1016/j.cell.2015.05.002. [DOI] [PMC free article] [PubMed] [Google Scholar]
- 59.Falcon S, and Gentleman R (2007). Using GOstats to test gene lists for GO term association. Bioinformatics 23, 257–258. 10.1093/bioinformatics/btl567. [DOI] [PubMed] [Google Scholar]
- 60.Subramanian A, Tamayo P, Mootha VK, Mukherjee S, Ebert BL, Gillette MA, Paulovich A, Pomeroy SL, Golub TR, Lander ES, and Mesirov JP (2005). Gene set enrichment analysis: a knowledge-based approach for interpreting genome-wide expression profiles. Proc Natl Acad Sci U S A 102, 15545–15550. 10.1073/pnas.0506580102. [DOI] [PMC free article] [PubMed] [Google Scholar]
- 61.Stuart T, Butler A, Hoffman P, Hafemeister C, Papalexi E, Mauck WM 3rd, Hao Y, Stoeckius M, Smibert P, and Satija R (2019). Comprehensive Integration of Single-Cell Data. Cell 177, 1888–1902 e1821. 10.1016/j.cell.2019.05.031. [DOI] [PMC free article] [PubMed] [Google Scholar]
- 62.Cakir B, Tanaka Y, Kiral FR, Xiang Y, Dagliyan O, Wang J, Lee M, Greaney AM, Yang WS, duBoulay C, et al. (2022). Expression of the transcription factor PU.1 induces the generation of microglia-like cells in human cortical organoids. Nat Commun 13, 430. 10.1038/s41467-022-28043-y. [DOI] [PMC free article] [PubMed] [Google Scholar]
- 63.Schindelin J, Arganda-Carreras I, Frise E, Kaynig V, Longair M, Pietzsch T, Preibisch S, Rueden C, Saalfeld S, Schmid B, et al. (2012). Fiji: an open-source platform for biological-image analysis. Nat Methods 9, 676–682. 10.1038/nmeth.2019. [DOI] [PMC free article] [PubMed] [Google Scholar]
Associated Data
This section collects any data citations, data availability statements, or supplementary materials included in this article.
Supplementary Materials
Data Availability Statement
RNA sequencing data have been deposited in Gene Expression Omnibus database and are publicly available as of the date of publication. Accession numbers are listed in the key resources table. This paper analyses existing, publicly available data. The accession numbers for the datasets are listed in the key resources table. This paper does not report original code. Any additional information required to reanalyze the data reported in this paper is available from the lead contact upon request.
Key Resources Table
| REAGENT or RESOURCE | SOURCE | IDENTIFIER |
|---|---|---|
| Antibodies | ||
| LHX2 | Invitrogen | Cat# PA5-78287 |
| LHX5 | Invitrogen | Cat# PA5-47828 |
| GABA | Invitrogen | Cat# PA5-32241 |
| vGLUT2 | Millipore | Cat# MAB5504 |
| GAD1/GAD67 | Invitrogen | Cat# MA5-24909 |
| GAD2/GAD65 | Invitrogen | Cat# PA5-22260 |
| ECEL1 | abcam | Cat# ab234710 |
| SPP1 | Invitrogen | Cat# MA5-17180 |
| PTCHD1 | Invitrogen | Cat# PA5-48191 |
| PTCHD1 | abcam | Cat# ab109407 |
| ERBB4 | Invitrogen | Cat# MA1-861 |
| DLX2 | Invitrogen | Cat# 702009 |
| TCF7L2 | Cell Signaling | Cat# 2569S |
| MAP2 | Millipore | Cat# MAB3418 |
| LHX1 | Origene | Cat# TA504527 |
| GEPHYRIN | R&D System | Cat# MAB7519 |
| SK2 | Millipore | Cat#MABN1832 |
| Chemicals, Peptides, and Recombinant Proteins | ||
| mTeSR1 | Stem Cell Technologies | Cat# 05875 |
| DMEM-F12 | Life Technologies | Cat# 11330057 |
| Neurobasal Media | Life Technologies | Cat# 2110349 |
| FBS | Life Technologies | Cat# 10437028 |
| Amino acids, non-essential | Life Technologies | Cat# 11140050 |
| Penicillin/Streptomycin | Life Technologies | Cat# 15140–122 |
| Glutamax | Life Technologies | Ca# 35050 |
| β-Mercaptoethanol | Sigma | Ca# M7522 |
| N2 | Life Technologies | Cat# 17502–048 |
| B27 | Life Technologies | Cat# 17504–044 |
| B27 supplement without vitamin A | Life Technologies | Cat# 12587010 |
| bFGF | Millipore | Cat# GF003AF |
| KnockOut Serum Replacement | Life Technologies | Cat# 10828–028 |
| HBSS | Life Technologies | Cat# 14170112 |
| Matrigel | BD | Cat# 354230 |
| Dextrose | Sigma | Cat# G7021 |
| Poly-D-Lysine | Xona | Cat# XC PDL |
| Y-27632 | Stem Cell Technologies | Cat# 72304 |
| Dispase (100ml) | Stem Cell Technologies | Cat# 07913 |
| Accutase (100ml) | Stem Cell Technologies | Cat# AT104 |
| LDN-193189 | Sigma | Cat# SML0559 |
| SB431542 | Abcam | Cat# ab120163 |
| BMP7 | GIBCO | Cat# PHC9544 |
| SHH | R&D Systems | Cat# 464-SH-200 |
| Puromycin | Sigma | Cat# P8833 |
| BDNF | Prepotech | Cat# 450–02 |
| Ascorbic acid | Sigma | Cat# A92902 |
| O.C.T compound | Tissue-Tek | Cat# 4583 |
| Bovine serum albumin | American Bioanalytical | Cat# AB01088 |
| ProLong Gold Antifade Reagent | ThermoFisher | Cat# P36930 |
| Critical Commercial Assays | ||
| Papain Dissociation System | Worthington Biochemical Corporation | Cat# LK003150 |
| Human Stem Cell Nucleofector Kit 1 | Lonza | Cat# VPH-5012 |
| RNeasy mini kit | QIAGEN | Cat# 74104 |
| RNase-Free DNase Set | QIAGEN | Cat# 79254 |
| iScript cDNA synthesis kit | Biorad | Cat# 1708891 |
| SsoFast EvaGreen Supermix | Biorad | Cat# 1725201 |
| Deposited Data | ||
| Raw and proposed scRNA-seq | This paper | GEO:GSE210720 |
| scRNA-seq for human fetal dorsal and ventral thalamus | 35 | https://data.nemoarchive.org/biccn/grant/u01_devhu/kriegstein/transcriptome/scell/10x_v2/human/processed/counts/ |
| H3K27ac ChIP-seq in distinct human brain regions | 28 | GEO: GSE40465 |
| Reference transcriptome hg19 | N/A | https://support.10xgenomics.com/ |
| RNA in situ hybridization for mouse fetal thalamus | 56 | Allen developing mouse brain atlas |
| Experimental Models: Cell Lines | ||
| HES-3 NKX2-1GFP/w | Elefanty lab, Monash University, Australia | https://www.ncbi.nlm.nih.gov/pubmed/21425409 |
| H1 hESC line | WiCell | https://www.ncbi.nlm.nih.gov/pubmed/9804556/ |
| H1-AAVS1-CAG-GFP | This paper | 17 |
| HES-3-BC4 | This paper | 57 |
| Oligonucleotides | ||
| See Table S1 for oligonucleotides used in this paper | This paper | N/A |
| Other | ||
| U-bottom ultra-low-attachment 96-well plate | Corning | CLS7007-24EA |
| Ultra-low-attachment 6-well plate | Corning | CLS3471-24EA |
| Ultra-low-attachment 24-well plate | Corning | 3473 |
| 35 mm dish (with glass bottom) | MatTek | P35GC-0-10-C |
| Orbital shaker | IKA | KS260 |
| Nucleofector | Lonza | AAB-1001 |
| Software and Algorithms | ||
| CellRanger (v3.0.2) | 10x Genomics | https://support.10xgenomics.com/single-cell-gene-expression/software/downloads/latest |
| Seurat (v3.0.2) | 58 | https://satijalab.org/seurat/ |
| Monocle (v2.99.3) | 30 | http://cole-trapnell-lab.github.io/monocle-release/ |
| GOstats (v2.46.0) | 59 | https://www.bioconductor.org/packages/release/bioc/html/GOstats.html |
| Bioconductor (v3.8) | N/A | https://www.bioconductor.org/ |
| R (v3.5.0) | N/A | https://www.r-project.org/ |
| GSEA (v4.0.2) | 60 | https://software.broadinstitute.org/gsea/index.jsp |