

Abstract
Background:
T1 inflammation (marked by IFN-γ expression) is now consistently identified in subsets of asthma cohorts, but how it contributes to disease remains unclear.
Objective:
We sought to understand the role of CCL5 in asthmatic T1 inflammation, and how it interacts with both T1 and T2 inflammation.
Methods:
CCL5, CXCL9 and CXCL10 mRNA expression from sputum bulk RNAseq, as well as clinical/inflammatory data were obtained from the Severe Asthma Research Program (SARPIII). CCL5 and IFNG expression from Bronchoalveolar lavage (BAL) cell bulk RNAseq were obtained from the Immune Mechanisms in Severe Asthma (IMSA) cohort and expression related to previously identified immune cell profiles. The role of CCL5 in Tissue Resident Memory T-cells (TRMs) reactivation was evaluated in a T1 high murine severe asthma model.
Results:
Sputum CCL5 expression strongly correlated with T1 chemokines (p<0.001 for CXCL9 and CXCL10), consistent with a role in T1 inflammation. CCL5High participants had greater FeNO (p=0.009), blood eosinophils (p<0.001), and sputum eosinophils (p=0.001) in addition to sputum neutrophils (p=0.001). Increased CCL5 BAL expression was unique to a previously described T1High/T2Variable/Lymphocytic patient group in the IMSA cohort, with IFNG trending with worsening lung obstruction only in this group (p=0.083). In a murine model, high expression of the CCL5 receptor CCR5 was observed in TRMs and consistent with a T1 signature. A role for CCL5 in TRM activation was supported by the ability of the CCR5 inhibitor maraviroc to blunt reactivation.
Conclusion:
CCL5 appears to contribute to TRM-related T1 neutrophilic inflammation in asthma, while paradoxically also correlating with T2 inflammation and with sputum eosinophilia.
Keywords: Asthma, IFN-gamma, CXCL-10, CXCL9, CCL5, CCR5, maraviroc, Tissue Resident Memory T cells (TRM)
Capsule Summary:
CCL5 expression in asthma correlates with biomarkers of T1 inflammation as well as eosinophilia and neutrophilia, suggesting CCL5 may be a bridge between T1 and T2 inflammation in asthma.
Introduction
Asthma affects 9–10% of the population1 with an estimated 3–5% of these patients meeting criteria for severe asthma2. However, asthma is not a singular disease but rather a complex array of different and overlapping phenotypes with unique underlying pathobiologies and responses to therapies3 such that targeted phenotype specific therapy is necessary to provide effective care4. While the management of patients with elevated Type 2 (T2) inflammation has greatly advanced with the advent of numerous T2-targeted biologics, therapy options remain limited for patients without evidence of significant T2 inflammation or in those T2 high patients who fail to adequately respond to T2 targeted therapies5. Further understanding of non-T2 pathways, both how these pathways contribute to asthma pathology and how they interact with T2 inflammation, is needed to develop new therapeutics for these patients.
We previously showed that Type 1 (T1) inflammation as manifested by elevated expression of IFN-γ6 as well as the T1 chemokines CXCL9 (MIG) and CXCL10 (IP-10)7 can be identified in the airways in a subgroup of asthmatic patients and that this pathway is poorly responsive to corticosteroid therapy6–8. Establishment of T1 inflammation in asthma appears to be mediated by the chemokines CXCL9 and CXCL10, through their cognate receptor CXCR3, as well as by CCL5 (RANTES) through the CCR5 receptor, since interruption of both pathways (utilizing CXCR3−/− mice treated with the CCR5 inhibitor maraviroc) is necessary to block the recruitment of IFN-γ+ T-cells to the lung in a murine severe asthma model9. In contrast, in wild type mice undergoing the severe asthma model, maraviroc alone was effective in blunting asthma responses, raising the possibility that CCR5 may play a unique role in T1 High asthma which could make a target for future therapeutics in this population9.
While T1 inflammation is increasingly recognized in asthma, it may be the combination of multiple inflammatory pathways that is particularly deleterious. Analysis of the Severe Asthma Research Program I/II (SARP I/II) cohort previously showed that participants with elevations in both T1 and T2 inflammation had the most severe disease10. Additionally, deep inflammatory cell profiling of BAL cells from asthmatic patients identified a lymphocytic T1High T2-variable asthma patient group with varying degrees of severity but with notable T1 and T2 overlap11. Parallels in human disease are supported by observations that, while very efficacious, T2 targeted biologics can generate only partial or poor responses in many,5 suggesting other pathways may contribute to their disease.
CCL5 has long been a chemokine of interest in asthma with identification of increased CCL5 expression in bronchoalveolar lavage (BAL) as early as the 1990s.12 Its role as a chemotactic signal for T2-inflammation-induced eosinophils has been suggested via CCR1 and possibly CCR3 activation13. However, CCL5 also plays a significant role in T1 inflammation. Its receptor, CCR5 is found on Th1 cells at sites of inflammation in autoimmune diseases, while CCL5 has also been reported to mediate Th1 recruitment in viral inflammation.14, 15 16 CXCR3 and CCR5 are independently capable of eliciting T1 inflammation in a murine severe asthma model9. Combined, these data suggest that CCL5 could bridge between T1 and T2 inflammation in asthma.
In this study, we hypothesized that CCL5 would be a unique bridge between T1 and T2 inflammation. To test this, we utilized sputum RNAseq data for CXCL9, CXCL10 and CCL5 expression from SARP III participants to assess correlations with sputum T1 chemokines, T2 biomarkers, and lung function. We further examined the relationship of CCL5 to the immune cell derived asthma groups previously reported11 in the IMSA cohort and confirmed a functional role for CCL5 in Tissue Resident Memory T-cell (TRM) reactivation in a murine severe asthma model.
Materials and Methods
Human Participants/Sputum RNA:
SARP III Cohort:
Previously obtained data from participants enrolled in the SARP III cohort were used. Non-smoking participants between the ages of 18–60 with asthma from ethnically/racially diverse backgrounds were recruited to multiple participating academic sites. All participants provided informed consent in accordance with local site IRB guidelines in coordination with the overall SARP data coordinating center. Asthma was determined by physician report and documentation of obstruction with bronchodilator reversibility on spirometry or a positive methacholine challenge. Non-smoking healthy controls were also included. Participants meeting European Respiratory Society/American Thoracic Society (ERS/ATS) 2013 definition of severe asthma17 were classified as having severe asthma (SA) with the remaining participants classified as having mild to moderate asthma (MMA). Participants underwent 2–3 baseline visits that included spirometry, exhaled nitric oxide (FeNO), sputum induction, and clinical questionnaires.
Sputum Whole-Transcriptome RNA Sequencing:
Expression data for genes CCL5, CXCL9, and CXCL10 were extracted from whole transcriptome sequencing of sputum samples from the SARP cohort. Briefly, mRNA whole transcriptome libraries were constructed with 20 ng of total RNA input per sample, using 16 cycles of amplification. Pooled libraries were sequenced on an Illumina NovaSeq 6000 instrument. Sequencing reads were trimmed with skewer18 (end-quality = 15, mean-quality = 25, min = 30). HiSat219 was used to align trimmed reads to the human reference genome GRCh38. Htseq-count20 with GRCh38 ensemble v84 gene transcript model was used for gene quantification. The raw gene count matrix was variance-stabilized through DESeq221 to produce a gene expression matrix suitable for downstream analyses.
IMSA Cohort:
Additional participants were recruited only through University of Pittsburgh School of Medicine via the Immune Mechanisms in Severe Asthma (IMSA) cohort. Participants with confirmed asthma provided informed consent in accordance with University of Pittsburgh’s IRB guidelines. Participant recruitment mirrored that in SARP and has been previously reported.11 Participants underwent clinical characterization similar to SARP III as well as bronchoscopy with BAL and endobronchial brushings. The immune and molecular profiles of BAL cells utilizing cytometry time of flight (CyTOF) and bulk RNA-sequencing have been previously described11.
CyTOF analysis of human BAL cells.
The details of CyTOF performance and analysis have been published previously11. Briefly, human BAL cells obtained via bronchoscopy were labeled with 40 monoclonal antibodies bearing rare earth element tags. Single cell mass cytometry (Cytometry Time of Flight; CyTOF) was performed using the Helios CyTOF system (Fluidigm). After initial analysis to eliminate debris, dead cells, and doublets, viable BAL cells were clustered using 33 cell-surface markers with the R implementation of FlowSOM through the cytofkit package (version 3.7). This unbiased machine learning approach yielded 25 unique cell populations, which we have previously described in detail11. CyTOF data acquisition results in conventional flow cytometry standard (FCS) files, which are amenable to downstream analysis by common methods. We therefore have used FlowJo software (TreeStar, Inc.) herein to manually assess the phenotype of CD4 and CD8 TRMs as well as a population of CD4 T cells characterized by co-expression of CD161 and CCR5. Upon verification of the basic phenotype of the cells (see Fig E1, in this article’s Online Repository at www.jacionline.org), expression of CXCR3, CCR5, and IFN-γ was assessed. The latter had been induced by in vitro stimulation of BAL cells with PMA (20 ng/ml) and ionomycin (1 μg/ml) in the presence of the protein transport inhibitor Brefeldin A (5 μg/ml) in a similar manner to that described for murine cells in the Intracellular Staining and Flow Cytometry section below.
Mouse Model:
C57BL/6 wild-type (WT) mice (catalog no. 000664) were purchased from the Jackson Laboratory (Bar Harbor, Me). All animal experiments were completed at the University of Pittsburgh in accordance with the IACUC approved protocol. All animals were cared for according to the National Institutes of Health Policy on Humane Care and Use of Laboratory Animals with adherence to the Guide for the Care and Use of Laboratory Animals. The mice were housed under pathogen-free conditions and underwent treatments between 8 and 10 weeks of age. Age-matched, mixed sex mice were used in this study. As described previously6, mice were exposed to a type 1–dominant severe asthma model. Mice were sensitized to 25 μg of house dust mite (HDM) antigen (low-endotoxin, Greer Laboratories [Lenoir, NC] [catalog no. XPB70D3A2.5]) combined with 5 μg of cyclic diguanosine monophosphate (cyclic-di-GMP) (Axxora [Farmingdale, NY] [catalog no. BLG-C057–01]) in PBS on days 1, 3, and 5 via intranasal route (i.n.). The mice were rested for 5 days and then subjected to 1 challenge set involving 3 consecutive daily challenges with 0.5 μg of cyclic-di-GMP with 25 μg of HDM i.n. on day 1, followed by 25 μg of HDM i.n. only the subsequent 2 days. Mice were then rested 4 weeks and underwent a final reactivation challenge. The mice were humanely sacrificed 24 hours after final challenge, and their lungs were used for preparation of whole lung homogenate as described previously6–9 and in the next section (Fig E2).
Intracellular Staining and Flow Cytometry:
The lungs of sacrificed mice were perfused with sterile PBS, removed, and processed for single-cell preparation, as described previously6, 9. Briefly, the lung tissues were digested in a collagenase A (0.7mg/ml)/DNase (30μg/ml) suspension (5 ml) and then dissociated using C-tubes on a gentleMACS dissociator (Miltenyi Biotec). A single-cell suspension was prepared by passing the dissociated tissue through a 70-μM cell strainer which was then treated with red blood cell lysis buffer (BD Pharm Lyse, BD, Franklin Lakes, NJ). In order to assess cytokine expression, cells were stimulated in media for 2.5 hours with phorbol myristate acetate (PMA, 50 ng/mL)/ionomycin (1 μg/mL) in the presence of brefeldin A and monensin (each 1:1000 of 1000X stock; Biolegend). Cells were washed, resuspended in Hanks balanced salt solution, and stained with fixable viability dye (FVD) eFluor 780 (eBioscience, San Diego, Calif). The cells were stained for cell surface markers using optimally diluted monoclonal antibodies (anti-CD3-PE Dazzle 594, anti-CD4-Alexa Fluor 700, anti-CD8-BV750, anti-CD69-FITC, anti-CD103-APC, anti-CXCR3-BV650, anti-CCR5-PE Cy7, and anti-CD161-PE; Biolegend), then fixed overnight using a Foxp3/Transcription Factor Fixation/Permeabilization Buffer Set (eBioscience) followed by staining for intracellular cytokines (anti-IFN-γ-BV421, and anti-IL-17A-V450; Biolegend) in permeabilization buffer. Incubations with antibodies against cell surface and intracellular proteins were each carried out for 45 min on ice. Appropriate fluorescence minus one (FMO) controls were used to establish thresholds of positivity for each individual marker. Data were acquired on an Aurora flow cytometer (Cytek) and analyzed using FlowJo software (Tree Star, Inc, Ashland, Ore). Elimination of spectral overlap was accomplished with SpectroFlow software (Cytek) running on the Aurora instrument using cells for the unstained and FVD controls, and Invitrogen UltraComp eBeads Plus compensation beads (ThermoFisher) singly labeled with each of the individual monoclonal antibodies. For experiments involving tissue resident memory cells (TRMs) mice were injected via the tail vein with 3 μg of anti-Thy1.1-APC Cy7 monoclonal antibody (Biolegend) in 250 μl sterile PBS in order to label circulating blood cells, 3 minutes prior to sacrifice then single cell suspensions were prepared as described above. Both APC-Cy7 and the FVD eFluor 780 fall in the Cytek Aurora R7 channel so live, non-circulating tissue resident cells were considered to be those lacking either label in that channel.
Statistics:
Statistical Analyses were completed using the STATA statistical software package (Version 16.1, StataCorp, College Station, TX). For clinical data, as the data were not consistently normally distributed, non-parametric analyses are used throughout. Spearman’s rho was used for correlative data, while group comparisons were completed using either Mann-Whitney U-test for two group comparisons or Kruskal-Wallis with Dunn’s post-hoc testing for multiple groups. Logistic regression analyses were performed initially with univariate analyses for each candidate variable, then as multivariate analyses for all variables at the univariate level with p<0.10. Multivariate models were then reduced using stepwise removal of variables in descending order by p-value for those with a p-value >0.05. A variable was considered non-significant if the likelihood ratio test showed a p>0.05 for the reduced model compared to the full model containing the same variable. The model was considered optimized when the model could no longer be reduced, with the final model reported with exact p-values for each included variables and likelihood ratio p-values reported for variables removed from the final model. Graphs were produced for figures using Prism (Version 9.4.0, GraphPad Software, San Diego, CA). Exact p-values are reported throughout.
Results
CCL5 expression in sputum is elevated in an asthma subgroup and correlates with both T1 and T2 inflammation.
286 representative participants from the SARP III cohort (Healthy Control = 27, Mild to Moderate Asthma = 102, Severe Asthma = 157, Table E1) had induced sputum samples that were processed for bulk RNA-sequencing. Median expression of CCL5, CXCL9, and CXCL10 across the cohort was not significantly different across mild to moderate asthma, severe asthma and healthy controls; however, increased variance was observed in the asthmatic participants with a subgroup of participants expressing higher levels of each chemokine (greater than one standard deviation above the healthy control median, Fig 1A). As expected, CCL5 expression correlated strongly with both CXCL9 (Fig E3, A) and CXCL10 expression levels (Fig 1B), supporting the association of CCL5 expression in sputum with T1 inflammation as previously reported9. Utilizing a cutoff of 1 standard deviation above the healthy control median, a CCL5 High group was identified (CCL5 expression = 9.185 Arbitrary units (AU), Fig 1A). CCL5 High asthmatic participants (n=92) had a greater proportion and number of lymphocytes in sputum cell differential (median 1.1%, IQR 0.5–1.8) compared to CCL5 Low asthmatic participants (n=168) (median 0.7%, IQR 0.3–1.2, p<0.001) (Fig 1C), suggesting CCL5 associates with lymphocytic inflammation and that lymphocytes are a potential source for CCL5 expression. As the cutoff of one standard deviation for CCL5 High status was arbitrary, we repeated the analysis using a more restrictive cutoff of 1.5 standard deviations (CCL5 Very High). This resulted in a slightly smaller group (n=71), but the identified clinical patterns (Table E2, A) and sputum cell count patterns observed (Table E2, B) were unchanged.
Figure 1: CCL5 Expression in sputum correlates with T1 chemokines and is associated with multiple sputum cell differentials.

Bulk RNA sequencing data was obtained from sputum samples in the SARP III cohort at their baseline visit. (A) The expression levels of CCL5, CXCL9 and CXCL10 in sputum (median with inter-quartile range) are shown across the cohort by asthma severity (Healthy Control [Healthy], Mild to Moderate Asthma [MMA] and Severe Asthma [SA]); CCL5 High status was determined by using a cutoff of 1 SD above the healthy control median (y=9.185, dashed line); (B) CCL5 expression in sputum correlates with the expression of T1 chemokine CXCL10, Spearman non-parametric correlations, simple linear regression (black) with 95% CI (shaded blue); (C) Sputum cell differential and count for lymphocytes shown by CCL5 High/Low status, Mann-Whitney U (D) FEV1 % predicted and FEV1/FVC ratio shown by CCL5 High/Low status, linear regression adjusted for age and BMI.
Increased CCL5 expression associates with multiple clinical parameters:
CCL5 High participants were also noted to be both older (median age 53.5 years [IQR 38.6–62.4] vs. 44.8 years [IQR 33.9–53.3], p<0.001) and have a later age of asthma onset (14.0 years [IQR 5.0–35.0] vs. 10.0 years [IQR 4.75–24.0], p=0.029) than CCL5 Low participants (Table I), consistent with previous reports that older age of onset is associated with T1 inflammation10, 22, 23. No significant differences were seen in clinical severity, asthma control or asthma quality of life, although CCL5High participants had a lower BMI and fewer females.
Table I:
Baseline Clinical Data for CCL5 High (HC median + 1SD)
| Variable | CCL5 Low | CCL5 High | ||
|---|---|---|---|---|
| n | 168 (64.6%) | 92 (35.4%) | p-value | |
| Age at baseline (years) | 44.8 (33.9 – 53.3) | 53.5 (38.6 – 62.4) | 0.0007 | |
| Age at asthma onset (years) | 10.0 (4.75–24) | 14.0 (5.0–35.0) | 0.0285 | |
| Sex (% Female) | 129 (76.8%) | 53 (57.6%) | 0.001 | |
| Asthma Severity (% Severe) | 106 (63.1%) | 52 (56.5%) | 0.299 | |
| Race (self-identified) n (%) | Asian | 7 (4%) | 7 (8%) | 0.022 |
| Black | 54 (32%) | 14 (15%) | ||
| Hispanic | 2 (1%) | 0 (0%) | ||
| Native American | 2 (1%) | 0 (0%) | ||
| White | 102 (61%) | 69 (75%) | ||
| More than 1 | 1 (1%) | 2 (2%) | ||
| BMI (kg/m 2 ) | 31.4 (27.4–38.5) | 28.9 (25.2–34.0) | 0.0370 | |
| ACQ6 Score | 1.17 (0.67–2.17) | 1.42 (0.83–2.33) | 0.4331 | |
| AQLQ Score | 5.06 (4.09–5.88) | 5.31(4.33–6.03) | 0.2270 | |
| FeNO (ppb) | 19.5 (12.0–32.5) | 27.5 (16.0–43.0) | 0.0086 | |
| IgE (IU/mL) | 157.8 (40.9–380.6) | 136.55 (37.5–377.4) | 0.4278 | |
| Blood Eosinophils (cells/ml) | 170.8 (113.1–295.2) | 281.0 (150.0–429.6) | 0.0002 | |
| FEV1 (% predicted) | 76.37 (61.61–88.08) | 69.93 (56.97 – 80.55) | 0.0117 | |
| FEV1/FVC | 72.06 (63.21–77.30) | 67.60 (61.92–73.73) | 0.0084 | |
| Maximum FEV1 Bronchodilator Reversibility (%) | 13.21 (7.04–22.73) | 15.58 (10.22–25.00) | 0.1398 | |
All Values reported as median (25% - 75%) for continuous values or n (%) for categorical values or counts. P-values are for Mann-Whitney U-test for continuous variables and Fisher’s exact test for categorical variables.
The CCL5 High subgroup was associated with a lower FEV1% predicted and worse obstruction when compared to the CCL5 Low subgroup, but after adjustment for significant clinical covariates including age, BMI and sex utilizing multivariate linear regression these findings were not significant (FEV1% predicted 69.93% [IQR 56.97–80.55%] vs. 76.37% [IQR 61.61–88.08%] adjusted p=0.134; FEV1/FVC 65.73[IQR 61.03–73.38] vs. 72.06[IQR 63.21–77.30], adjusted p=0.352, Table E3, A, Fig E3, B). As there was the potential that the relationship of CCL5 with airflow obstruction might be limited to the subset of subjects with elevated CCL5 expression, multivariate linear regression analyses including significant clinical variables (age, BMI and sex) were selectively and separately performed in the CCL5 High and CCL5 Low subgroups respectively (Table E3, B). CCL5 expression showed significant negative correlation with FEV1 % predicted (p=0.002, r2 = 0.205 for the model) and with FEV1/FVC (p=0.037, r2 = 0.1740 for the model) solely in the CCL5 High group while in CCL5 Low group no association was seen (FEV1 p=0.207, FVC p=0.925; Fig 1D).
CCL5 High asthma participants had increased T2 biomarkers with a mixed neutrophilic/eosinophilic phenotype.
While CCL5 associated strongly with T1 inflammatory markers and lymphocyte presence in sputum, we were interested in the association of CCL5 status with T2 biomarkers. Elevated sputum CCL5 levels were associated with greater blood eosinophil counts (Absolute eosinophil count 281 cells/ml [IQR 150–430] vs. 171 cells/ml [IQR 113–295], p<0.001, Fig 2A) and fraction of exhaled nitric oxide (FeNO) (27.5ppb [IQR 16.0–43.0] vs. 19.5ppb [IQR 12.0–32.5], p=0.009, Fig 2A). CCL5 High participants also had higher sputum eosinophils (0.9% [IQR 0.3–5.6] vs. 0.5% [IQR 0.0–1.7%], p=0.001, Fig 2B) and neutrophils (61.0% [IQR 43.0–77.4] vs. 46.7% [IQR 30.7–65.8], p<0.001, Fig 2C). When comparing sputum inflammatory groups, a greater proportion of CCL5 High participants had sputum eosinophilia (>2% eosinophils) (37% [n=36] vs. 23% [n=44], p=0.019 Fisher’s Exact) and sputum neutrophilia (above the median value) (63% [n=62] vs. 45% [n=85], p=0.004 Fisher’s Exact). Notably, mixed inflammation was also higher in the CCL5 High group (23% [n=23] vs. 11% [n=21], p=0.009) (Fig 2D).
Figure 2: CCL5 High Status is associated with clinical T2 biomarkers and both eosinophilic and neutrophilic sputum:

(A) Absolute blood eosinophil counts and fraction of exhaled nitric oxide (FeNO) are compared by CCL5 group, Mann-Whitney U test (B) Sputum cell differential for eosinophils shown by CCL5 High/Low status, Mann-Whitney U (C) Sputum cell differential for neutrophils shown by CCL5 High/Low status, Mann-Whitney U (D) Sputum eosinophilia (defined by >2% eosinophils), sputum neutrophilia (defined as above the median value) and mixed eosinophilic/neutrophilic (meeting both criteria) are tabulated against CCL5 High/Low status, values shown as percentages of the whole CCL5 group, Fisher’s exact test calculated using contingency tables based on subject numbers.
Given that CCL5 can signal via CCR1 and CCR3 to recruit eosinophils13, 24 and neutrophils in the setting of IFN-γ expression25, 26, these data suggest that CCL5 is mediating mixed inflammatory expression in these participants; however, it remained possible that CCL5 expression might be a surrogate measure for general T1 inflammation or that eosinophilia and neutrophilia may indirectly predispose to each other. To clarify if CCL5 associations were unique to CCL5 or a surrogate association for general T1 status or granulocytic inflammation, we performed a series of logistic regression analyses to test for the effect of CCL5, CXCL9 and CXCL10 expression along with sputum eosinophil/neutrophil percentages all as continuous variables for sputum eosinophilia (>2%) and neutrophilia (above median value). High CCL5 expression strongly predicted sputum eosinophilia (p=0.003) while sputum neutrophil differential as well as CXCL9 and CXCL10 were uninformative (Table IIA). For sputum neutrophilia, both high CCL5 (p=0.001) and high CXCL9 (p=0.010) expression predicted neutrophilia while CXCL10 and sputum eosinophilia were uninformative (Table IIB). Given that multiple variables met the cutoff for inclusion (p<0.10), a multivariate logistic regression was performed for sputum neutrophilia utilizing both CCL5 and CXCL9 expression. Here, only CCL5 was informative (p=0.033 by likelihood ratio test, CXCL9 p=0.444), suggesting that only CCL5 was predictive of sputum neutrophilia (Table IIC).
Table IIA:
Univariate Logistic Regression for Sputum Eosinophilia (sputum eosinophils >2%)
| Variable | β coefficient (95% CI) | p-value for the variable |
|---|---|---|
| CCL5 | 0.329 (0.109 – 0.548) | 0.003 |
| CXCL9 | 0.047 (−0.109 – 0.203) | 0.555 |
| CXCL10 | 0.031 (−0.113 – 0.174) | 0.676 |
| Sputum Neutrophil % | 0.001 (−0.010 – 0.012) | 0.799 |
Table IIB:
Univariate Logistic Regression for Sputum Neutrophilia (sputum neutrophils > median value)
| Variable | β coefficient (95% CI) | p-value for the variable |
|---|---|---|
| CCL5 | 0.323 (0.124 – 0.522) | 0.001 |
| CXCL9 | 0.190 (0.045 – 0.336) | 0.010 |
| CXCL10 | 0.104 (−0.028 – 0.236) | 0.124 |
| Sputum Eosinophil % | −0.020 (−0.059 – 0.019) | 0.307 |
Table IIC:
Multivariate Logistic Regression Analysis (Sputum Neutrophilia)
| Model | β coefficient (95% CI), p-value for variable in the model | p-value for likelihood ratio compared to univariate model without variable |
|---|---|---|
| CCL5 | 0.265 (0.018 – 0.512) | 0.033 |
| CXCL9 | 0.071 (−0.111 – 0.254) | 0.444 |
Taken together, this suggests that CCL5 independently predicts eosinophilia and neutrophilia outside of global T1 status, and may contribute to a mixed inflammatory profile in a subset of asthma patients.
CCL5 is associated with a unique inflammatory cell profile.
To confirm and expand on our findings, we utilized an independent asthma cohort (IMSA) consisting of 41 participants (7 non-smoking healthy controls, 15 participants with mild to moderate asthma and 17 participants with severe asthma) who underwent bronchoscopy and clinical testing. We observed similar profiles (Fig 3A) for CCL5 and IFNG expression in BAL by bulk RNAseq, as previously noted in sputum in SARP III (Fig 1A) and microarray analyses of BAL fluid from SARP I/II9. Although there were no differences in median values, increased variance was again observed in asthma compared to healthy controls. Utilizing similar cutoff thresholds of 1 and 1.5 standard deviations above the healthy control median value for CCL5 expression, we observed similar trends in clinical parameters, although many of these were not significant owing likely in part to the smaller number of individuals and resulting loss of statistical power (Table E4). BAL cell data from IMSA participants largely replicated the observations seen in sputum with the noted exception of significantly greater lymphocyte elevation in CCL5 High subjects (10.4% (6.3 – 18.0) vs. 3.4% (2.3 – 7.7), p=0.001) and a loss of significance for neutrophils. This likely owes in part to the nature of the differing compartments being measured between sputum (SARP III) and BAL (IMSA).
Figure 3: IFNG and CCL5 Expression differ among BAL inflammatory cellular profiles with differing clinical features.

(A) IFNG and CCL5 expression in BAL by bulk RNA sequencing show no significant differences when grouped by asthma severity, however when grouped by previously identified BAL cell profiles significant elevation is seen in the lymphocytic dominant group, Kruskal-Wallis with Dunn’s post-hoc testing when significant, exact p-values shown (B) Correlation of CCL5 expression with IFNG (T1 cytokine) and IL4 (T2 cytokine) (C) Correlation of CCL5 with Eosinophil percentage in blood as well as BAL; Spearman’s rho, simple linear regression (black) with 95% CI (shaded blue).
High dimensional profiling of BAL inflammatory cells using cytometry time of flight (CyTOF, mass cytometry with 40 surface and intracellular markers) as analyzed by unsupervised K-means clustering previously identified 3 inflammatory cellular groups11. These groups included: a largely healthy control group with a few mild asthma participants, a T2High/Innate cell dominant group and a T1High/T2variable/Lymphocyte dominant group. Re-sorting the 41 participants into these previously identified BAL immune cell defined groups, both IFNG and CCL5 BAL expression were significantly elevated in the T1High/T2variable/Lymphocyte dominant group compared to the T2High/Innate cell dominant group and a trend to higher levels compared to the healthy control group (Fig 3A). These findings confirmed a linkage between CCL5 expression and lymphocytic inflammation and confirmed a probable inflammatory profile linked to elevated CCL5 expression.
Confirmation of the relationship of CCL5 with T1 and T2 inflammation.
Next, we assessed the correlation of CCL5 with IFNG expression to confirm our hypothesis that CCL5 expression was T1 mediated and observed a strong correlation as expected (r=0.786, p<0.001, Fig 3B). Similar findings were also observed for CXCL9 (r=0.6868, p<0.001) and CXCL10 (r=0.6982, p<0.001). Interestingly, we also noted correlation of CCL5 with IL4 expression in BAL cells, although not as strong (r=0.339, p=0.038, Fig 3B). Finally, we observed correlation of traditional T2 biomarkers with CCL5 expression, noting significant correlation with blood eosinophils (r=0.440, p=0.006) and BAL eosinophils (r=0.371, p=0.022) (Fig 3C) and a similar pattern with fraction of exhaled NO, although this did not reach significance (r=0.247, p=0.135) (Fig E3, C).
The relation of IFNG expression to airway obstruction varies by inflammatory group.
Given the strong association of CCL5 with the T1High/T2Variable/Lymphocytic group, we next validated the previously observed association of T1 inflammation with airway obstruction (SARP III) in the IMSA cohort at large and whether it varied with inflammatory cell profile given our prior observations that high CCL5 expression associated with obstruction uniquely in the CCL5 High patient group (Fig 1D). When assessing by CyTOF groups, BAL CCL5 expression did not correlate or associate with obstructive measures in any group, which may be due to limitations in power or to unique compartmental differences between BAL and airway smooth muscle. Performing the same analysis with BAL IFNG, we noted opposing trends between the T1High/T2Var./Lymphocyte group and the T2High/Innate Cell group. Increasing IFNG expression correlated with worsening obstruction (FEV1% pred and FEV1/FVC) in the T1High/T2Var./Lymphocyte group, while a modest trend to improved FEV1% pred (but not FEV1/FVC) with increasing IFNG was observed in the T2High/Innate cell dominant group (Fig 4A). This suggests the nature of T1/T2 interactions vary between these inflammatory groups.
Figure 4: Associations of IFNG expression with measures of obstruction by inflammatory group and TRM receptor and cytokine expression:
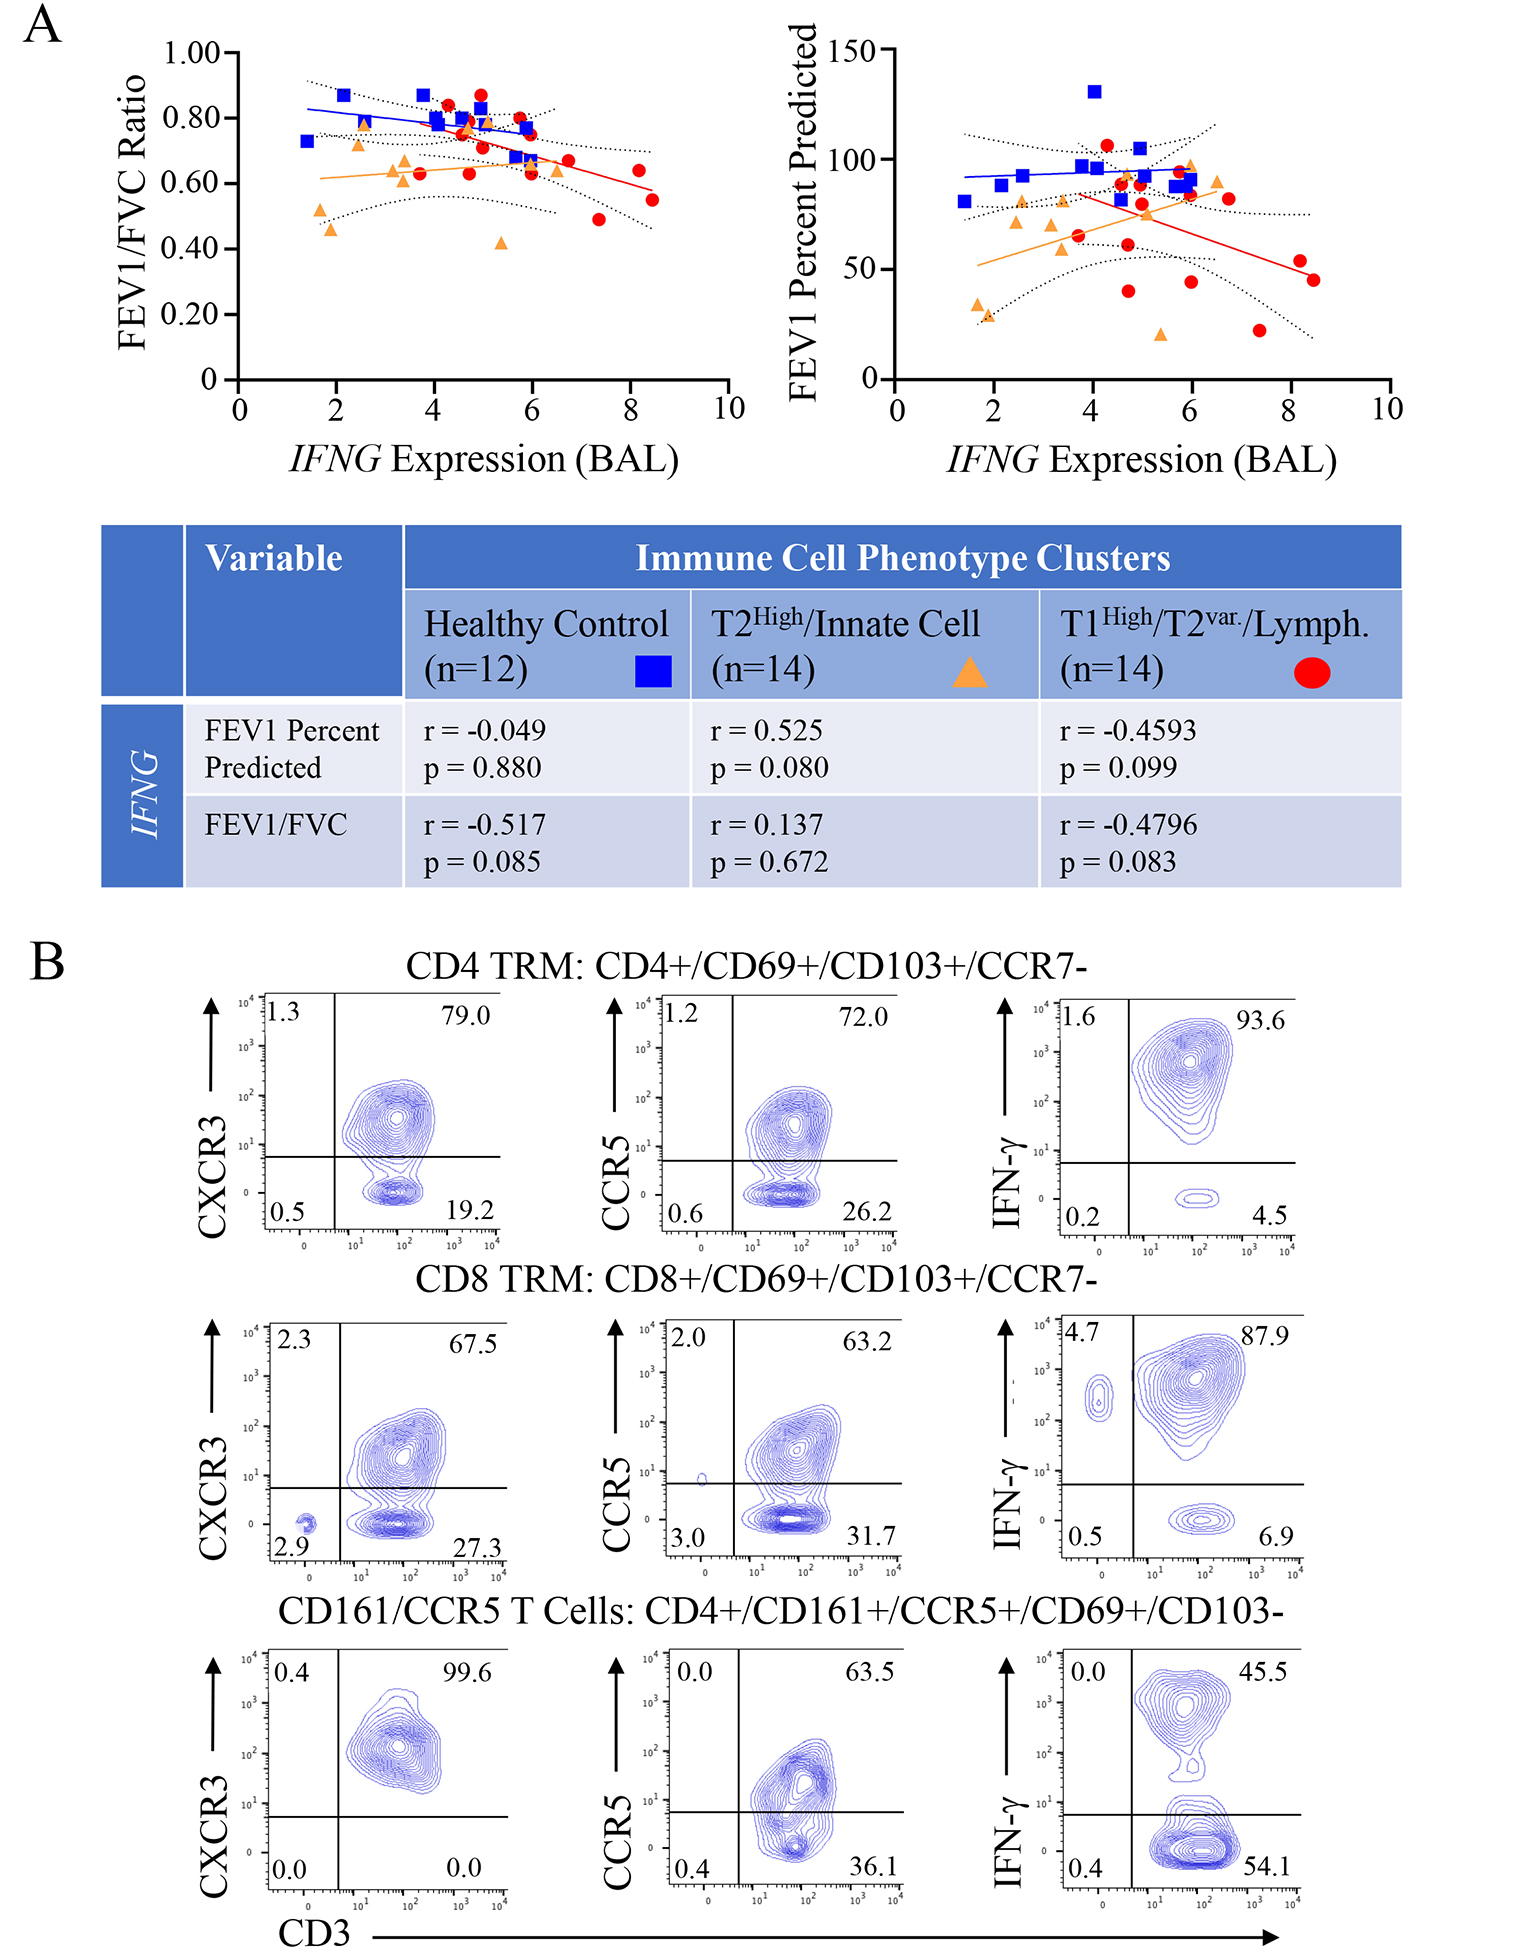
(A) BAL IFNG expression was correlated with forced expiratory volume at 1 second (FEV1) percent predicted and FEV1/Forced Vital Capacity (FVC) by BAL inflammatory cell phenotype group (Healthy Control, T2High/Innate Cell, T1High/T2Var./Lymphocyte). Spearman non-parametric correlation for each comparison by group are shown in the table below (B) Human BAL CD4 and CD8 TRMs, and CD4 CD161+/CCR5+ cells identified by CyTOF and machine learning with the R implementation of FlowSOM (see Fig E1) were assessed for expression of CXCR3, CCR5, and IFN-γ using conventional analysis via FlowJo software; representative plots from 1 participant shown.
Identification of CXCR3 and CCR5 receptors on IFN-γ expressing CD4 and CD8 TRMs and CD161/CCR5 T-cells:
As previously reported, the T1High/T2Var./Lymphocyte group was defined in part by BAL CD4 and CD8 TRMs11. Using conventional analysis (FlowJo) of BAL TRMs (for gating strategy see Fig E4) from T1High/T2variable participants identified previously by cytometry time of flight (CyTOF) and unbiased machine learning using the R implementation of FlowSOM (Fig E1)11, we found notable expression of both CXCR3 (mean 88.8±6.6% CD4 cells, 77.2±12.3% CD8 cells) and CCR5 (mean 36.4±23.6% CD4 cells, 27.1±20.1% CD8 cells) (Fig 4B) on these cell types. Notably, CD4 and CD8 TRMs strongly expressed IFN-γ (Fig 4B) and in the prior BAL RNAseq analysis utilizing ICLite deconvolution were also the most strongly associated with the gene module containing both CCL5 and CCR511. The T1High/T2Var./Lymphocyte group was also defined by a CD4 cluster positive for CD161 and CCR5 (CD161/CCR5 cells)11. Similarly, CD4 cells co-expressing CD161 and CCR5 (Fig E1, gating strategy Fig E5)11 also expressed CXCR3 and IFN-γ in T1High/T2variable individuals (Fig 4B).
A T1 high mouse severe asthma model shows evidence of CCR5 specific inflammatory cells.
To better understand the role of CCL5 in TRM activation, we turned to a T1 high mouse severe asthma model (Fig E2). This model utilizes house dust mite antigen (HDM) combined with the bacterial second messenger cyclic-di-GMP to generate an asthma phenotype with marked T1 expression characterized by IFN-γ dependent airway hyper-reactivity (AHR)6. This approach results in an asthma-like phenotype marked by substantial inflammatory lung infiltration, airway hyperresponsiveness (AHR) with minimal to no response to corticosteroid treatment analogous to some human severe disease6–8. Notably, our recent work showed that treatment with the CCR5 inhibitor maraviroc blunted both AHR and lung inflammation in the model, suggesting a critical role for CCL59, but the cellular mediators of this response remain unclear.
Given our findings related to CD4 and CD8 TRMs and CD161/CCR5 cells (Fig 4B) we first sought to determine the presence of these cells in the mouse model. To achieve this, we modified the model to include the initial sensitization and challenge phases as usual but then added a 4-week rest period to allow for the development of TRMs before a final re-stimulation challenge. This was done to ensure that cells observed were representative of TRMs and not a continuation of the primary adaptive immune response since recently or chronically activated T cells can also express CD6927, 28. Following rest and stimulation a single cell suspension was prepared from harvested lungs and analyzed by flow cytometry. We observed a significant increase in CD3+CD4+CD69+CD103+ and CD3+CD8+CD69+CD103+ cells indicative of TRMs29 in the severe asthma model compared to naïve mice (Fig 5A), similar to that observed in the human T1High/T2Var/Lymphocytic group (Fig 4B). As seen in this inflammatory group, when gating on these cells, an appreciable number were CXCR3+ consistent with T1 TRMs and within this population nearly three quarters of TRMs were double positive CXCR3+CCR5+ cells (Fig 5B). This was consistent with prior work that single receptor knockout of either CXCR3 or CCR5 was unable to effectively block the severe asthma model9 and support that a similar T1 dominant lymphocytic signal with CCR5 expression is present in the mouse model as seen in the comparable IMSA group.
Figure 5. Identification of Tissue Resident Memory T-cells and CD161+CCR5+ Cells in a Murine T1 severe asthma model:

(A) Cells isolated from the lung were stained and examined by flow cytometry; Gating on CD3+CD4+ (CD4) and CD3+CD8+ (CD8) cells, tissue resident memory T-cells (TRMs) were identified by expression of CD69+CD103+ with numbers of both CD4 and CD8 TRMs significantly expressed in the severe asthma model (SA) compared to naïve mice (Mann-Whitney U-test, data representative of two independent experiments) (B) Examination of CD4 and CD8 TRMs for surface staining for CXCR3 and CCR5 identified an abundance of CXCR3+ TRMs co-expressing CCR5 (C) Gating on CD161, a population of CD161+CCR5+ cells was identified (data pooled from 4 mice per group) (D/E) Mice underwent treatment with either the CCR5 inhibitor maraviroc (300mg/1L drinking water) or vehicle (water) beginning during the rest phase of the model (Fig E2); following reactivation challenge, cells were isolated from the lungs and underwent intracellular and surface staining for total lung cells and then gating on TRMs for IFN-γ+ and IL-17+ cells along with CXCR3+CCR5+ cells (E) (data pooled from two separate experiments, Student’s T-test with Welch’s correction).
Notably in IMSA, the cell type most correlated with obstruction was a cluster characterized by CD161+CCR5+ T cells11. While, as in humans, these cells were also found to be rare in mice, they were observed in the context of the severe asthma model, but not in naïve, untreated mice (Fig 5C), again consistent with the human T1High/T2Var/Lymphocytic asthma group.
CCR5 antagonism (Maraviroc) blocks T1 CD4 TRM reactivation in a mouse severe asthma model:
As noted above, IMSA BAL RNAseq analysis identified a module containing CCL5 and CCR5 that was strongly correlated with TRMs. TRMs have been previously reported to be rapidly reactivated after allergen re-exposure causing AHR without recruitment of peripheral cells30, raising the possibility that CCL5 may play an important role in TRM reactivation in the T1High/T2Var/Lymphocytic group that could contribute to disease. Given our observed efficacy for maraviroc (a CCR5 inhibitor) in the mouse severe asthma model9, we then investigated whether treatment with maraviroc could effectively blunt CD4 TRM reactivation. To ensure that the effect of maraviroc was limited to reactivation rather than primary establishment of TRMs, maraviroc was not introduced until mice had completed sensitization and initial challenge. A single reactivation challenge with HDM was performed at 4 weeks and lungs were harvested for single cell isolation with intracellular staining and flow cytometry analysis. Maraviroc treatment showed a small but non-significant decrease in total lung cells (Fig 5D, left hand panel) as well as CD3+ cells; however, numbers of IFN-γ+ (p=0.007, Student’s T-test with Welch’s correction) and IL-17+ (p=0.045, Student’s T-test with Welch’s correction) CD4 TRMs were significantly reduced in maraviroc treated mice compared to vehicle (Fig 5D middle and right-hand panels), suggesting maraviroc effectively impaired T1 TRM reactivation. To confirm that this was not due to a reduction in T1 TRM cells, we also examined CXCR3+CCR5+ cells in the lung and found no effect of maraviroc (p=0.873, Fig 5E) as expected given that dosing began following the initial sensitization and challenge phases.
Discussion
While T2 inflammation is well described in asthma and multiple biologic therapies have emerged to target T2-related pathways, there is a significant need to improve our understanding of non-T2 pathways and how these pathways both contribute to asthma as well as interact with T2 inflammation. Prior work has identified a novel immunophenotype in asthma consisting of mixed T1 and T2 signal10, 11 with a notable immune signature marked by the presence of T1 TRMs.11 Notably, in this study we show that CCL5 represents a unique bridge between T1 and T2 inflammation, playing a role in both T1 TRM reactivation and contributing to neutrophilia in addition to eosinophilia. As T1 inflammation is not steroid responsive7, 31, this interaction could explain steroid resistance in otherwise T2 high asthma patients with mixed disease. Importantly, as a unique bridge between T1 and T2 inflammation, CCL5 may provide a target for novel asthma therapeutics for this population.
The role of T1 inflammation is increasingly recognized in severe asthma, both in adults and children32–34, and may provide a target for future therapies35. IFN-γ expression can be identified in 30–40% of adult asthma participants6, 10 while a study of severe asthma in children also noted high percentage of IFN-γ+ memory T-cells in BAL samples33. Additionally, both CXCL9 and CXCL10 are known to recruit Th1 cells to sites of inflammation via the CXCR3 receptor36 and have been shown to be elevated in asthma7, 37, 38. Importantly, both chemokines are also induced by IFN-γ, leading to a feed forward loop for T1 inflammation39 that is resistant to corticosteroid treatment9, 31; however, CXCR3 signaling is not the sole mechanism for Th1 recruitment; while Th1 cells do not frequently express CCR5 in circulation, co-expression of CXCR3 and CCR5 by Th1 cells is seen at sites of inflammation in autoimmune disease16 and strong correlation has been observed in asthma9. In a mouse severe asthma model, T1 inflammation was not affected by genetic absence of CXCR3 or CCR5 individually suggesting dual receptor expression by Th1 cells; as expected CCR5 inhibition in Cxcr3−/− mice (effective dual blockade) was able to block Th1 and Th17 recruitment to the lung9. These findings suggest that dual expression of CXCR3 and CCR5 is important in T-cell recruitment to the lung. Notably, prior work showed that CCR5 inhibition with maraviroc in wild type mice was able to effectively block AHR and improve lung inflammation when given either prior to sensitization or post-sensitization but pre-challenge.9 These findings suggest that the CCL5-CCR5 pathway may directly affect asthmatic manifestations in the lung outside of just Th1 cell chemotaxis in T1-mediated asthma, and prompted further study focused on this chemokine-receptor pair.
In the setting of increased recognition of the importance of T1 inflammation in asthma, the role of T1 inflammation in modulating other asthma mediators require further elucidation to fully understand the potentially complex interplay between them. While T1 and T2 inflammation are classically thought to be counter-regulatory40, increasing evidence suggests that overlap exists where patients have increased expression of both T1 and T2 inflammatory networks and that these patients may be particularly challenging. Modena, et al., reported in SARP I/II that while 40% of severe asthma participants had evidence of T1 inflammation based upon BAL cell microarray, it was participants with evidence of combined T1 and T2 inflammation who had particularly severe disease10. Consistent with this, we observed that the correlation of airway obstruction with increased sputum CCL5 expression was unique to the CCL5 High group in the SARP III cohort, suggesting the negative impacts of T1 inflammation were not universal but isolated to specific participants. Furthermore, when we examined the correlation of IFNG expression and obstruction in IMSA, our findings differed across the immune-cell clustering defined patient groups with IFNG showing either no effect or a trend towards improved lung function in the T2High/Innate cell group while showing a consistent trend towards worse obstruction with higher IFNG expression in the T1High/T2var/Lymphocytic group. This suggests that the interaction of T1 and T2 inflammation may be variable depending on the underlying immune pathways involved with some asthmatics showing immunomodulatory effects of T1 inflammation on T2 related asthma and others showing a loss of this counter-regulatory nature and marked elevations in both T1 and T2 inflammation. Future work is needed to better understand how this counter-regulatory nature changes in certain individuals.
While elevated levels of T1 cytokines and chemokines can clearly be detected in BAL7, 9 and in sputum, the cutoffs for high and low expression are not well defined. Here we have used values of 1 (Table I) and 1.5 (Table E2A–B) standard deviations above healthy control median, but these cutoff values remain arbitrary in nature and there is not a clear cutoff point to determine High/Low values. We noted that defining the T1 High phenotype via immune cell profile in BAL showed a clear elevation of IFNG and CCL5 in the T1 High patient group, but some overlap still exists in CCL5 expression between participants in the T1High/T2Variable/Lymphocytic patient group and the T2High/Innate Cell dominant patient group (Fig 3A). Whether elevations in CCL5 in T2High/Innate cell patients represents a more classically described allergen-mediated or T2-mediated CCL5 elevation41 or the beginnings of T1 inflammation in these patients is not clear, and further research is needed to better understand the role of CCL5 in these differing immune contexts.
CCL5 represents a unique potential to bridge T1 and T2 inflammation. CCL5 is a strong recruiter of Th1 cells via the CCR5 receptor42 which is highly expressed on Th1 cells in association with CXCR343. Consistent with this, we noted strong correlation between expression of the traditional T1 chemokines CXCL9 and CXCL10 (ligands for CXCR3) and CCL5 expression in sputum, consistent with prior work in BAL9. This supports the hypothesis that CCL5 is a component of T1 inflammation in asthma. Despite this, we noted significant increases in eosinophilia and neutrophilia in CCL5 High participants with logistic regression confirming this to be unique to CCL5 expression. CCL5 is known to recruit eosinophils via the CCR1 and possibly CCR3 receptors44, 45 and has been shown to correlate with eosinophil recruitment in allergen challenge studies45. Eosinophils have also been shown to secrete CCL5 in response to IFN-γ exposure46, suggesting a potential further mechanism for T1:T2 crossover. Reciprocally, IFN-γ can promote the survival of human eosinophils via Jak2 activation47. The neutrophilic component is also of interest in the sense that while it is not a classic neutrophil chemotactic protein, CCL5 has been shown to have potential to stimulate neutrophil recruitment25, 26, particularly in the setting of IFN-γ exposure that can lead to expression of CCR1 and CCR3 on neutrophils26. As combined eosinophilia and neutrophilia are associated with greater corticosteroid requirements and worse disease48, CCL5 may represent a potential pathway for T1 inflammation to induce severe asthmatic changes in the airway.
In addition to its role in granulocyte recruitment, the potential interaction between CCL5 and TRMs is also becoming more apparent. In the IMSA cohort, the T1High/T2Var/Lymphocytic group was notably associated with lung CD4 and CD8 TRMs which expressed IFN-γ, and analysis of BAL RNAseq data from this same cohort associated these cells with the gene module containing CCL511. A bronchoscopy study in children also identified enrichment in CCR5+CD4+ memory T-cells in BAL samples33, and CCL5 nasal expression at the time of RSV infection in infants is a strong predictor of eventual asthma development.49 Overall expression of CCR5 in the TRM compartment is high,43 suggesting that T1 TRMs may be prone to reactivation via CCL5. As CCL5 is potently induced by viral infection14, 15, 50, this could represent a mechanism by which viral infection leads to asthma exacerbations. In our study, we show that re-exposure of TRMs to HDM following a prolonged rest period leads to reactivation with expression of IFN-γ and IL-17, a response that could be effectively blunted with CCR5 inhibition by maraviroc. While more investigation is needed, these results are highly promising in terms of a potential therapeutic role for CCR5 blockade as it relates to asthma exacerbations.
Our study is not without some limitations, which on the human side are inherent to the design of both SARP and IMSA. The human cohorts used in this study are necessarily cross-sectional at the timepoints used in these analyses, which limits the ability to comment on the longitudinal durability of this phenotype over time. Ideally, longitudinal studies of CCL5 and T1 expression over time are needed to fully understand this aspect, although the repeated demonstration of this phenotype across multiple independent cohorts argues for some degree of durability. As serial research bronchoscopies pose significant issues from a health and safety perspective for our participants, serial sputum studies may prove to be a plausible alternative. In the mouse studies, we have thus far examined antigen-specific reactivation of induced TRMs; however, there is strong data to suggest that bystander activation of TRMs via inflammatory milieu is an important part of the immune response in the lung51, a process which we hypothesize to extend to viral infection and as such to asthma exacerbations, but non-specific restimulation was beyond the scope of this study at this stage. However, the present study and the model used herein form the foundation for further work examining the interplay between viral reactivation and allergy in the generation of the complex immune phenotypes that are readily apparent in human participants. Specifically, the well described mouse severe asthma model will likely provide useful information on the nature of T1 TRM reactivation and how this may contribute to asthma severity, particularly in the case of concomitant T2 processes.
Supplementary Material
Clinical Implication:
CCL5 may be a unique therapeutic target which regulates both T1 and T2 inflammation in asthma.
Acknowledgements:
The following companies provided financial support for study activities at the Coordinating and Clinical Centers beyond the third year of patient follow-up: AstraZeneca, Boehringer-Ingelheim, Genentech, GlaxoSmithKline, Sanofi–Genzyme–Regeneron, and TEVA.
Funding Sources:
National Institutes of Health (AI 106684 (AR and SEW), F32 HL137089 (MG), HL113956(AR), AI048927(AR)), UPMC Competitive Medical Research Fund (MG) and the Parker B. Francis Foundation (MG);
COI:
The following companies provided financial support for the Severe Asthma Research Program (SARP) study activities at the Coordinating and Clinical Centers beyond the third year of patient follow-up: AstraZeneca, Boehringer-Ingelheim, Genentech, GlaxoSmithKline, Sanofi–Genzyme–Regeneron, and TEVA. These companies had no role in study design or data analysis, and the only restriction on the funds was that they be used to support the SARP initiative.
Abbreviations:
- AHR
Airway Hyperreactivity
- CCL5
C-C Ligand 5 (RANTES)
- CCR5
C-C chemokine receptor 5
- CXCL9
C-X-C Ligand 9 (MIG)
- CXCL10
C-X-C Ligand 10 (IP-10)
- CXCR3
C-X-C chemokine receptor 3
- HDM
House Dust Mite
- ICS
Intracellular Staining
- IFN-γ
Interferon-gamma
- MMA
Mild to Moderate Asthma
- SA
Severe Asthma
- TRM
Tissue Resident Memory T-cell
- WT
Wild Type
Footnotes
Publisher's Disclaimer: This is a PDF file of an unedited manuscript that has been accepted for publication. As a service to our customers we are providing this early version of the manuscript. The manuscript will undergo copyediting, typesetting, and review of the resulting proof before it is published in its final form. Please note that during the production process errors may be discovered which could affect the content, and all legal disclaimers that apply to the journal pertain.
References
- 1.Rose D, Mannino DM, Leaderer BP. Asthma Prevalence Among US Adults, 1998–2000: Role of Puerto Rican Ethnicity and Behavioral and Geographic Factors. American Journal of Public Health 2006; 96:880–8. [DOI] [PMC free article] [PubMed] [Google Scholar]
- 2.Hekking PP, Wener RR, Amelink M, Zwinderman AH, Bouvy ML, Bel EH. The prevalence of severe refractory asthma. J Allergy Clin Immunol 2015; 135:896–902. [DOI] [PubMed] [Google Scholar]
- 3.Gauthier M, Ray A, Wenzel SE. Evolving Concepts of Asthma. Am J Respir Crit Care Med 2015; 192:660–8. [DOI] [PMC free article] [PubMed] [Google Scholar]
- 4.Wenzel S Severe asthma: from characteristics to phenotypes to endotypes. Clin Exp Allergy 2012; 42:650–8. [DOI] [PubMed] [Google Scholar]
- 5.Brusselle GG, Koppelman GH. Biologic Therapies for Severe Asthma. New England Journal of Medicine 2022; 386:157–71. [DOI] [PubMed] [Google Scholar]
- 6.Raundhal M, Morse C, Khare A, Oriss TB, Milosevic J, Trudeau J, et al. High IFN-gamma and low SLPI mark severe asthma in mice and humans. J Clin Invest 2015; 125:3037–50. [DOI] [PMC free article] [PubMed] [Google Scholar]
- 7.Gauthier M, Chakraborty K, Oriss TB, Raundhal M, Das S, Chen J, et al. Severe asthma in humans and mouse model suggests a CXCL10 signature underlies corticosteroid-resistant Th1 bias. JCI Insight 2017; 2. [DOI] [PMC free article] [PubMed] [Google Scholar]
- 8.Oriss TB, Raundhal M, Morse C, Huff RE, Das S, Hannum R, et al. IRF5 distinguishes severe asthma in humans and drives Th1 phenotype and airway hyperreactivity in mice. JCI Insight 2017; 2. [DOI] [PMC free article] [PubMed] [Google Scholar]
- 9.Gauthier M, Kale SL, Oriss TB, Scholl K, Das S, Yuan H, et al. Dual role for CXCR3 and CCR5 in asthmatic type 1 inflammation. J Allergy Clin Immunol 2022; 149:113–24.e7. [DOI] [PMC free article] [PubMed] [Google Scholar]
- 10.Modena BD, Bleecker ER, Busse WW, Erzurum SC, Gaston BM, Jarjour NN, et al. Gene Expression Correlated with Severe Asthma Characteristics Reveals Heterogeneous Mechanisms of Severe Disease. Am J Respir Crit Care Med 2017; 195:1449–63. [DOI] [PMC free article] [PubMed] [Google Scholar]
- 11.Camiolo MJ, Zhou X, Oriss TB, Yan Q, Gorry M, Horne W, et al. High-dimensional profiling clusters asthma severity by lymphoid and non-lymphoid status. Cell Reports 2021; 35:108974. [DOI] [PMC free article] [PubMed] [Google Scholar]
- 12.Alam R, York J, Boyars M, Stafford S, Grant JA, Lee J, et al. Increased MCP-1, RANTES, and MIP-1alpha in bronchoalveolar lavage fluid of allergic asthmatic patients. American Journal of Respiratory and Critical Care Medicine 1996; 153:1398–404. [DOI] [PubMed] [Google Scholar]
- 13.Elsner J, Petering H, Höchstetter R, Kimmig D, Wells TNC, Kapp A, et al. The CC chemokine antagonist Met-RANTES inhibits eosinophil effector functions through the chemokine receptors CCR1 and CCR3. European Journal of Immunology 1997; 27:2892–8. [DOI] [PubMed] [Google Scholar]
- 14.Nakagome K, Bochkov YA, Ashraf S, Brockman-Schneider RA, Evans MD, Pasic TR, et al. Effects of rhinovirus species on viral replication and cytokine production. Journal of Allergy and Clinical Immunology 2014; 134:332–41.e10. [DOI] [PMC free article] [PubMed] [Google Scholar]
- 15.John AE, Berlin AA, Lukacs NW. Respiratory syncytial virus-induced CCL5/RANTES contributes to exacerbation of allergic airway inflammation. European Journal of Immunology 2003; 33:1677–85. [DOI] [PubMed] [Google Scholar]
- 16.Qin S, Rottman JB, Myers P, Kassam N, Weinblatt M, Loetscher M, et al. The chemokine receptors CXCR3 and CCR5 mark subsets of T cells associated with certain inflammatory reactions. The Journal of clinical investigation 1998; 101:746–54. [DOI] [PMC free article] [PubMed] [Google Scholar]
- 17.Chung KF, Wenzel SE, Brozek JL, Bush A, Castro M, Sterk PJ, et al. International ERS/ATS guidelines on definition, evaluation and treatment of severe asthma. Eur Respir J 2014; 43:343–73. [DOI] [PubMed] [Google Scholar]
- 18.Jiang H, Lei R, Ding S-W, Zhu S. Skewer: a fast and accurate adapter trimmer for next-generation sequencing paired-end reads. BMC Bioinformatics 2014; 15:182. [DOI] [PMC free article] [PubMed] [Google Scholar]
- 19.Kim D, Langmead B, Salzberg SL. HISAT: a fast spliced aligner with low memory requirements. Nature Methods 2015; 12:357–60. [DOI] [PMC free article] [PubMed] [Google Scholar]
- 20.Anders S, Pyl PT, Huber W. HTSeq--a Python framework to work with high-throughput sequencing data. Bioinformatics 2015; 31:166–9. [DOI] [PMC free article] [PubMed] [Google Scholar]
- 21.Love MI, Huber W, Anders S. Moderated estimation of fold change and dispersion for RNA-seq data with DESeq2. Genome Biology 2014; 15. [DOI] [PMC free article] [PubMed] [Google Scholar]
- 22.Wu W, Bleecker E, Moore W, Busse WW, Castro M, Chung KF, et al. Unsupervised phenotyping of Severe Asthma Research Program participants using expanded lung data. J Allergy Clin Immunol 2014; 133:1280–8. [DOI] [PMC free article] [PubMed] [Google Scholar]
- 23.Baan EJ, De Roos EW, Engelkes M, De Ridder M, Pedersen L, Berencsi K, et al. Characterization of Asthma by Age of Onset: A Multi-Database Cohort Study. The Journal of Allergy and Clinical Immunology: In Practice 2022. [DOI] [PubMed] [Google Scholar]
- 24.Li N, Mirzakhani H, Kiefer A, Koelle J, Vuorinen T, Rauh M, et al. Regulated on Activation, Normal T cell Expressed and Secreted (RANTES) drives the resolution of allergic asthma. iScience 2021; 24:103163. [DOI] [PMC free article] [PubMed] [Google Scholar]
- 25.Pan Z-Z, Parkyn L, Ray A, Ray P. Inducible lung-specific expression of RANTES: preferential recruitment of neutrophils. American Journal of Physiology-Lung Cellular and Molecular Physiology 2000; 279:L658–L66. [DOI] [PubMed] [Google Scholar]
- 26.Bonecchi R, Polentarutti N, Luini W, Borsatti A, Bernasconi S, Locati M, et al. Up-Regulation of CCR1 and CCR3 and Induction of Chemotaxis to CC Chemokines by IFN-γ in Human Neutrophils. The Journal of Immunology 1999; 162:474–9. [PubMed] [Google Scholar]
- 27.Julius P, Luttmann W, Knoechel B, Kroegel C, Matthys H, Virchow JC Jr. CD69 surface expression on human lung eosinophils after segmental allergen provocation. European Respiratory Journal 1999; 13:1253–9. [DOI] [PubMed] [Google Scholar]
- 28.Cibrián D, Sánchez-Madrid F. CD69: from activation marker to metabolic gatekeeper. European Journal of Immunology 2017; 47:946–53. [DOI] [PMC free article] [PubMed] [Google Scholar]
- 29.Szabo PA, Miron M, Farber DL. Location, location, location: Tissue resident memory T cells in mice and humans. Sci Immunol 2019; 4. [DOI] [PMC free article] [PubMed] [Google Scholar]
- 30.Turner DL, Goldklang M, Cvetkovski F, Paik D, Trischler J, Barahona J, et al. Biased Generation and In Situ Activation of Lung Tissue-Resident Memory CD4 T Cells in the Pathogenesis of Allergic Asthma. J Immunol 2018; 200:1561–9. [DOI] [PMC free article] [PubMed] [Google Scholar]
- 31.O’Connell D, Bouazza B, Kokalari B, Amrani Y, Khatib A, Ganther JD, et al. IFN-gamma-induced JAK/STAT, but not NF-kappaB, signaling pathway is insensitive to glucocorticoid in airway epithelial cells. Am J Physiol Lung Cell Mol Physiol 2015; 309:L348–59. [DOI] [PMC free article] [PubMed] [Google Scholar]
- 32.Duvall MG, Barnig C, Cernadas M, Ricklefs I, Krishnamoorthy N, Grossman NL, et al. Natural killer cell-mediated inflammation resolution is disabled in severe asthma. Sci Immunol 2017; 2. [DOI] [PMC free article] [PubMed] [Google Scholar]
- 33.Wisniewski JA, Muehling LM, Eccles JD, Capaldo BJ, Agrawal R, Shirley DA, et al. T(H)1 signatures are present in the lower airways of children with severe asthma, regardless of allergic status. J Allergy Clin Immunol 2018; 141:2048–60.e13. [DOI] [PMC free article] [PubMed] [Google Scholar]
- 34.Muehling LM, Heymann PW, Wright PW, Eccles JD, Agrawal R, Carper HT, et al. Human TH1 and TH2 cells targeting rhinovirus and allergen coordinately promote allergic asthma. Journal of Allergy and Clinical Immunology 2020; 146:555–70. [DOI] [PMC free article] [PubMed] [Google Scholar]
- 35.Damsky W, Wang A, Kim DJ, Young BD, Singh K, Murphy MJ, et al. Inhibition of type 1 immunity with tofacitinib is associated with marked improvement in longstanding sarcoidosis. Nature Communications 2022; 13. [DOI] [PMC free article] [PubMed] [Google Scholar]
- 36.Antonelli A, Ferrari SM, Giuggioli D, Ferrannini E, Ferri C, Fallahi P. Chemokine (C-X-C motif) ligand (CXCL)10 in autoimmune diseases. Autoimmun Rev 2014; 13:272–80. [DOI] [PubMed] [Google Scholar]
- 37.Brightling CE, Ammit AJ, Kaur D, Black JL, Wardlaw AJ, Hughes JM, et al. The CXCL10/CXCR3 axis mediates human lung mast cell migration to asthmatic airway smooth muscle. Am J Respir Crit Care Med 2005; 171:1103–8. [DOI] [PubMed] [Google Scholar]
- 38.Miotto D, Christodoulopoulos P, Olivenstein R, Taha R, Cameron L, Tsicopoulos A, et al. Expression of IFN-gamma-inducible protein; monocyte chemotactic proteins 1, 3, and 4; and eotaxin in TH1- and TH2-mediated lung diseases. J Allergy Clin Immunol 2001; 107:664–70. [DOI] [PubMed] [Google Scholar]
- 39.Antonelli A, Ferri C, Ferrari SM, Colaci M, Fallahi P. Immunopathogenesis of HCV-related endocrine manifestations in chronic hepatitis and mixed cryoglobulinemia. Autoimmun Rev 2008; 8:18–23. [DOI] [PubMed] [Google Scholar]
- 40.O’Garra A Cytokines induce the development of functionally heterogeneous T helper cell subsets. Immunity 1998; 8:275–83. [DOI] [PubMed] [Google Scholar]
- 41.Holgate ST, Bodey KS, Janezic A, Frew AJ, Kaplan AP, Teran LM. Release of RANTES, MIP-1 α , and MCP-1 into Asthmatic Airways Following Endobronchial Allergen Challenge. American Journal of Respiratory and Critical Care Medicine 1997; 156:1377–83. [DOI] [PubMed] [Google Scholar]
- 42.Chensue SW, Warmington KS, Allenspach EJ, Lu B, Gerard C, Kunkel SL, et al. Differential Expression and Cross-Regulatory Function of RANTES During Mycobacterial (Type 1) and Schistosomal (Type 2) Antigen-Elicited Granulomatous Inflammation. The Journal of Immunology 1999; 163:165–73. [PubMed] [Google Scholar]
- 43.Woodward Davis AS, Roozen HN, Dufort MJ, Deberg HA, Delaney MA, Mair F, et al. The human tissue-resident CCR5+ T cell compartment maintains protective and functional properties during inflammation. Science Translational Medicine 2019; 11:eaaw8718. [DOI] [PMC free article] [PubMed] [Google Scholar]
- 44.Chvatchko Y, Proudfoot AE, Buser R, Juillard P, Alouani S, Kosco-Vilbois M, et al. Inhibition of airway inflammation by amino-terminally modified RANTES/CC chemokine ligand 5 analogues is not mediated through CCR3. J Immunol 2003; 171:5498–506. [DOI] [PubMed] [Google Scholar]
- 45.Teran LM, Noso N, Carroll M, Davies DE, Holgate S, Schröder JM. Eosinophil recruitment following allergen challenge is associated with the release of the chemokine RANTES into asthmatic airways. The Journal of Immunology 1996; 157:1806–12. [PubMed] [Google Scholar]
- 46.Lacy P, Mahmudi-Azer S, Bablitz B, Hagen SC, Velazquez JR, Man SFP, et al. Rapid Mobilization of Intracellularly Stored RANTES in Response to Interferon-γ in Human Eosinophils. Blood 1999; 94:23–32. [PubMed] [Google Scholar]
- 47.Ochiai K, Tanabe E, Ishihara C, Kagami M, Sugiyama T, Sueishi M, et al. Role of JAK2 signal transductional pathway in activation and survival of human peripheral eosinophils by interferon-gamma (IFN-γ). Clinical and Experimental Immunology 2001; 118:340–3. [DOI] [PMC free article] [PubMed] [Google Scholar]
- 48.Teague WG, Lawrence MG, Shirley D-AT, Garrod AS, Early SV, Payne JB, et al. Lung Lavage Granulocyte Patterns and Clinical Phenotypes in Children with Severe, Therapy-Resistant Asthma. The Journal of Allergy and Clinical Immunology: In Practice 2019; 7:1803–12.e10. [DOI] [PMC free article] [PubMed] [Google Scholar]
- 49.Bacharier LB, Cohen R, Schweiger T, Yin-Declue H, Christie C, Zheng J, et al. Determinants of asthma after severe respiratory syncytial virus bronchiolitis. J Allergy Clin Immunol 2012; 130:91–100.e3. [DOI] [PMC free article] [PubMed] [Google Scholar]
- 50.Yuan X-H, Pang L-L, Yang J, Jin Y. Comparison of immune response to human rhinovirus C and respiratory syncytial virus in highly differentiated human airway epithelial cells. Virology Journal 2022; 19. [DOI] [PMC free article] [PubMed] [Google Scholar]
- 51.Ge C, Monk IR, Pizzolla A, Wang N, Bedford JG, Stinear TP, et al. Bystander Activation of Pulmonary Trm Cells Attenuates the Severity of Bacterial Pneumonia by Enhancing Neutrophil Recruitment. Cell Reports 2019; 29:4236–44.e3. [DOI] [PubMed] [Google Scholar]
Associated Data
This section collects any data citations, data availability statements, or supplementary materials included in this article.