

Abstract
Objectives:
Hearing loss (HL) is associated with imbalance and increased fall risk. The mechanism underlying this relationship and differences across types of hearing loss remains unclear. Head mounted displays (HMD) can shed light on postural control mechanisms via an analysis of head sway.
Purpose:
The purpose of this study was to evaluate head sway in response to sensory perturbations in individuals with bilateral (BHL) or unilateral hearing loss (UHL) and compare them to controls.
Materials and Methods:
We recruited 36 controls, 23 individuals with UHL and 14 with BHL. An HMD (HTC Vive) measured head sway while participants stood on the floor, hips-width apart. Stimuli included two levels of visuals and sound. Root Mean Square Velocity (RMSV) and Power Spectral Density (PSD) were used to quantify head sway.
Results:
Adjusting for age, individuals with BHL had significantly higher anterior-posterior and medio-lateral RMSV than controls and individuals with UHL. Individuals with UHL demonstrated significantly lower response to visual perturbations in RMSV AP and in all 3 frequency segments of PSD compared to controls. Individuals with UHL showed significantly lower movements at high frequencies compared to controls. Sounds or severity of HL did not impact head sway.
Conclusions:
Individuals with BHL demonstrated increased sway with visual perturbations and should be clinically assessed for balance performance and fall risk. Individuals with UHL exhibited reduced responses to visual stimuli compared with controls, which may reflect conscious movement processing. Additional studies are needed to further understand the mechanistic relationship between hearing loss and imbalance.
Keywords: sensory integration for balance, head-mounted display, virtual reality, head kinematics, head sway
1. INTRODUCTION
Hearing loss (HL) is known to be associated with impaired balance [1–3]. A US survey of 2017 participants (age 40-69) demonstrated that for every 10-dB increase in hearing deficit, there was a 1.4-fold (95% CI, 1.3-1.5) increased odds of the individual experiencing a fall within the next 12 months [4]. In addition to falls, hearing loss has been associated with a myriad of markers of decreased physical functioning, including slower gait speed, balance instability, frailty, depression, increased likelihood of dementia, and hospitalization [1,2,5,6]. The mechanisms underlying the relationship between hearing loss and imbalance are currently unclear [7].
Prior studies have shown that individuals with sensory loss (such as vestibular loss, blindness etc.) will allocate greater “weight” towards other sensory inputs as a mechanism to maintain postural control [8,9]. Few studies have examined sensory integration and postural sway in individuals with HL. Maheu et al. [10] compared postural stability between individuals with congenital bilateral deafness and healthy adults and found the bilateral deafness group demonstrated increased postural sway when standing on foam with eyes closed compared to age-matched controls. They attributed the postural instability of the HL group to an increased reliance on somatosensory input. Bang et al. [2], in a large-scale population-based study of older Korean adults, found that moderate or worse hearing deficit in at least 1 ear was associated with increased odds of postural instability, defined as an inability to stand on foam for at least 20 seconds with eyes closed.
Most studies reporting a relationship between hearing loss and balance have included people with bilateral hearing loss (BHL) but largely overlooked those with unilateral hearing loss (UHL). UHL has variable definitions in the literature, but typically implies one ear with normal hearing and the other with at least mild hearing loss [11,12]. An estimated 18 million Americans were affected by UHL from 2001-2008 [13]. UHL is unique because individuals are often able to hear normally in a quiet environment, but have impaired ability to localize sounds [14]. There is limited data on the relationship between balance and UHL. Lubetzky, Kelly, et al. [15] compared postural sway between UHL, unilateral vestibular hypofunction and controls and found that individuals with UHL did not change their postural sway with dynamic visual cues to the same extent as healthy controls or individuals with unilateral vestibular hypofunction. Such behavior suggests that rather than increasing the weight of visual cues to compensate for their sensory loss (such as occurs with vestibular dysfunction), individuals with UHL may use a “feed-forward” mechanism for postural control, i.e., they rely on prior expectation and motor planning rather than responding to dynamic sensory cues [16]. Further mechanistic studies focused on individuals with UHL and BHL are needed to clarify postural control mechanisms related to HL.
Mechanistic studies of postural control benefit from including a comprehensive set of both traditional and frequency-based metrics. Traditional metrics (e.g., velocity) allow for an analysis of postural steadiness [17], while frequency-based measures indicate differences in postural strategy [9,18]. It has been suggested that analyzing sway at specific frequency segments can indicate sensory integration strategies, namely low frequencies are associated with cortical loops and motor planning vs. high frequencies that reflect reactive/somatosensory loops [9,19]. Postural control analysis traditionally relied on laboratory force platforms [20–22] however, head sway data derived from Head Mounted Displays (HMDs) has been suggested as a sensitive, reliable [23] and valid [24,25] assessment. Force plate data has demonstrated strong cross-correlation with head sway data under different visual conditions [18,26] and can provide additional information for overall postural steadiness and strategy during static and dynamic balance tasks (i.e. standing, walking). Use of HMDs may have potential future translation to a portable clinical assessment of postural steadiness in individuals with HL.
The purpose of this study was to investigate head sway in varying sensory environments in adults with BHL or UHL, and healthy controls. To accomplish this, our study aimed to evaluate postural steadiness (via head velocity) and postural strategy (via frequency analysis) in people with BHL and UHL as compared to healthy controls. Based on prior literature, we hypothesized that people with BHL will demonstrate greater head sway as compared to healthy controls [2,10]. We also hypothesized, using this literature, that individuals with UHL will demonstrate decreased visual reliance to maintain standing in the presence of dynamic visuals in comparison to healthy controls [15].
2. MATERIALS & METHODS
2.1. Participants
Clinicians at the Ear Institute of Mount Sinai recruited participants with BHL and UHL and these participants underwent comprehensive behavioral audiometry. Recruitment of the control group with self-reported normal hearing was from the community. All participants denied dizziness and had no neurological, vestibular or orthopedic condition that could impact their balance; none used a cane or walker. All participants were screened for normal or corrected to normal vision. All participants with HL were evaluated by a neurotologist to confirm lack of vestibular complaints or concomitant vestibular diagnoses. All participants with hearing loss underwent comprehensive audiometry in a soundproof booth calibrated to American National Standards Institute (ANSI) standards [27]. Unaided pure-tone air (250- 8kHz) and bone (250- 4kHz) conduction thresholds were obtained for each ear and pure-tone averages (PTA) were calculated using air conduction thresholds at four frequencies (0.5, 1, 2 and 4kHz; 4fPTA) Based on the World Health Organization’s definition of hearing loss, UHL was defined as normal hearing (4fPTA of < 25 dB HL) in one ear and at least mild (> 26 dB HL 4fPTA) in the affected ear [11,12]. BHL was defined as at least mild hearing loss (>26 dB 4f PTA ) in the better hearing ear [28]. Level of hearing loss was categorized as mild (26-40 dB HL 4fPTA), moderate (>41-60 dB HL 4fPTA) severe (> 61-80 dB HL 4fPTA) and profound (81 dB or greater) across groups [29]. Hearing loss type was categorized as conductive, mixed, or sensorineural.
2.2. Protocol
The Mount Sinai Institutional Review Board and the New York University Committee on Activities Involving Research Subjects approved this study. Participants completed a balance assessment using a well-established protocol with a HMD with headphones (HTC Vive Pro Eye; HTC Corporation, Taoyuan City, Taiwan) which projected the virtual environment while measuring head sway [9,30]. Participants were provided the following instructions: stand hips-width apart on the floor, look straight ahead with arms by their sides, and do “whatever felt natural to them to maintain their balance”. The virtual environments (programmed in Unity version 5.2.1f; ©Unity Technologies, San Francisco, California) included 2 levels of visual stimuli combined with 2 levels of sound (none, rhythmic white noise at intensity increases from 0 to 3dB at 0.3Hz.) The visual environment incorporated a 3-wall display of ‘stars’ that was either static or moving anterior-posterior (AP) at 0.2 Hz and 0.032 meters [31]. An Alienware laptop 15 R3 (Round Rock, TX, USA) controlled the headset.
Our lab recruited twenty controls prior to the COVID-19 lockdown. 3 repetitions of each combination of sounds and visuals was completed by the control group at a research laboratory. 16 controls and the hearing loss groups were recruited after September 2020 when the study resumed. The study was converted into an in-clinic setup and was shortened to 2 repetitions of each condition (8 minutes total), as per institutional requirements to minimize in-person exposure. Testing met all additional pandemic precautions, including universal masking, previsit COVID-19 symptom screening, temperature check, and staff use of face-shields (Figure 1). Each participant completed the Simulator Sickness Questionnaire (SSQ) before and after the assessment to evaluate cybersickness in response to the HMD assessment [32]. All participants completed the Activities-Specific Balance Confidence Scale (ABC), and the Visual Vertigo Analog Scale (VVAS). The ABC asks participants to self-report their confidence in their ability to maintain their balance while completing various daily activities [33]. The VVAS questionnaire asks about dizziness induced by moving visuals during different daily situations, such as shopping in a grocery store [34].
Figure 1.

The experimental setup
Participants who were tested in the clinic also completed the Timed Up and Go (TUG) and the Four-Square Step Test (FSST). The TUG is a standardized walking test to measure walking ability and fall risk, in which participants are instructed to walk 10 feet around a cone and back to a chair. The FSST is a dynamic balance test that assesses coordination and ability to step over objects, in which patients step forward, sideways, and backward in clockwise and counterclockwise directions. A result over 12 seconds on the TUG and over 15 seconds on the FSST reflects increased fall risk in community-dwelling older adults [35].
2.3. Data Processing and Outcome Measures
The HMD at a frame rate of 90 Hz using custom-made Unity software written for HTC Vive was used to record head sway data [30]. MATLAB R2021a (MathWorks, Natick, MA) was used to process and analyze data. A low-pass 4th order Butterworth filter with a cutoff frequency at 10 Hz was applied [36]. After removal of the first 5 seconds, the last 55 seconds were used to quantify head Root Mean Square Velocity (RMSV, cm/s or Radians/s) [37] in 2 directions: anterior-posterior (AP) and medio-lateral (ML). RMSV is the difference in position between two consecutive data points divided by the average time interval. The velocity at each point is then squared and summed. The square root of the sum is then divided by the number of data points [38]. Power spectral Density (PSD) of the raw head kinematic time series was calculated using the MATLAB function periodogram with a boxcar window. The outcomes PSD1, PSD2, and PSD3 (each in cm2) refer to the sum of the power spectral density values across the following three ranges of frequencies (in Hz): [0, 0.25], [0.25, 0.5], [0.5, 1]. Low frequency movements (below 0.25 Hz) are indicative of long feedback loops, i.e., visual and cortical activity, which is due to longer latency of visual pathways [39] . Several studies suggested that low frequencies as below 0.5 Hz [36,40] fall within this category. Data from our lab demonstrated moderate to good intra-class correlations (ICCs) for raw data and good to excellent ICCs following a logarithmic transformation for PSD 1-3 between the head signal and a laboratory force platform.
2.4. Statistical Analysis
We generated descriptive statistics (mean, min, max, SD) for all outcome and descriptive measures. We then proceeded to select the model used for analysis through three steps. All models we consider in this analysis were linear mixed effects models due to the inherent structure in the dataset. Linear mixed effects models maximize the information we can obtain from the data arising from inherent multi-level study designs (in this case, person, conditions, repetitions). That is, since each person completes various trials for each condition, the linear mixed effects model accounts for these sources of variability through the inclusion of a random intercept for each participant in the study [41]. We calculated the P-values for any included fixed effects through the Satterthwaite approximation for the degrees of freedom for the T-distribution [42].
First, we fit models on the original outcome scale for all measures of interest (RMSV ML and AP, PSD1-3 AP) and inspected the residual versus fitted plots to assess model assumptions. To achieve homoscedasticity, we log transformed the outcome measures in all further models considered. Next, we fit 2 linear-mixed effect models for each of our included outcomes. The first model included interactions of sounds by group, visual and a main effect of age. The second included only the interactions group by visual and a main effect of age. We then compared AIC and BIC values between two models (as described below) to assess whether sound should be included as a predictor in the models. We found that for velocity measures, the AIC was close between the 2 models, but all BIC values selected the model that did not include sounds as a predictor. For all PSD measures, both AIC and BIC selected the models that did not include sound as a predictor. Using this data, we chose to use the models in which sound was not included as a variable.
While we did not have hearing severity measured for the control group, we investigated whether severity, as a continuous variable via 4f PTA, was a significant factor in the model for the UHL and BHL groups. To do this, we fit 2 models. The first included fixed effects of group, visual, and their two-way interactions, as well as main effects of age and hearing loss severity in each ear. The second model did not include the severity measures. As done above, we compared AIC and BIC values for these two models, which indicated that the models should not include severity of hearing loss as predictors for comparisons across the UHL and BHL groups.
Therefore, our final models use the logarithm of the outcome measure, main effects of group, visual and their two-way interaction, as well as a main effect of age and random intercepts for each participant. We report P-values from the model that used the logarithm of each outcome measure, point estimates for each group at each visual condition and the time points in the unit of measurement through the calculation of the estimated marginal means with their 95% confidence intervals. We also report difference in means (DIM) that can be interpreted as an effect size measure. Additionally, we report the ratio (in %) of static to dynamic visuals or between groups by using the exponent of the coefficient distinguishing dynamic and static or between groups for each metric of head sway we analyzed. We generated all figures and conducted all analyses using R version 4.1.2 (2021-11-01, The R project for Statistical Computing).
3. RESULTS
3.1. Sample
We recruited 36 controls (females: 18, mean age 41.97 yrs., SD: 17.42) 23 individuals with UHL (females: 11, mean age 46.74 yrs., SD: 17.45) and 14 with BHL (females: 7, mean age 70.71 yrs., SD: 8.1) (Table 1). Four participants used hearing aids in their daily living (Table 1), but all were tested unaided. No participants had a cochlear implant. For individuals with UHL, average 4fPTA of their worse hearing ear was in the severe range (61.77 dB HL, SD 18.48). Individuals with symmetric or near symmetric BHL fell into the mild (n=6), moderate (n=5), severe (n=2), and profound (n=1) range, determined by the 4fPTA for the better hearing ear. The HL groups scored similarly on standardized, subjective measures of dizziness and imbalance (ABC and VVAS), and globally demonstrated minimal balance impairment. The 3 groups did not differ on TUG and FSST and, on average, did not reach concern for falls. Refer to table 1 for demographic and descriptive measures for all three groups.
Table 1.
Descriptive Statistics of Demographic Variables.
| Control | UHL | BHL | |
|---|---|---|---|
| N | 36 | 23 | 14 |
| Gender | Female: 18 Male: 18 |
Female: 11 Male: 12 |
Female: 7 Male: 7 |
| Age in years (Mean, SD) | 41.97 (17.42) | 46.74 (17.45) | 70.71 (8.1) |
| Onset of HL in years (Mean, SD) | N/A | 14.12 (18.46) | 15.04 (16.61) |
| PTA* in dB (Mean, SD) | N/A | Better Ear:16.96 (8.21) Worse Ear: 60.97 (18.47) |
Better Ear:50.11 (20.27) Worse Ear :71.61 (27.11) |
| Severity of HL** (n) | N/A | Mild: 4 Moderate: 8 Severe: 8 Profound: 3 |
Mild: 6 Moderate: 5 Severe: 2 Profound: 1 |
| Hearing Aid Use in life | N/A | 1 | 3 |
| Timed Up and Go (Mean seconds, SD) | 6.54 (1.44) | 7.34 (1.89) | 8.61 (3.6) |
| Four-Square Step Test (mean seconds, SD) | 7.66 (2.60) | 9.14 (3.4) | 9.68 (3.99) |
| Activities Specific Balance Confidence Scale (Mean, SD) | 98.1 (0.42) | 90.06 (17.48) | 86.07 (13.74) |
|
Visual Vertigo Analog
Scale (Mean, SD) |
0.79 (2.78) | 8.22 (9.77) | 3.52 (7.89) |
C 4 frequency (500, 1k, 2k, 4kHz) air conduction pure tone average
Based on dB HL of the worse hearing ear for UHL and better hearing ear for BHL; classified by the World Health Organization (Olusanya et al., 2019).
20 controls are missing Time Up and Go and Four-Square Step Test scores because they were tested prior to protocol changes following the Covid-19 pandemic.
3.2. Root Mean Square Velocity (RMSV)
There were no observed significant differences in the RMSV ML and AP values across age range. Adjusting for age, BHL, but not UHL, had significantly higher head velocity than controls on the static scene (ML: DIM=0.23 cm/s, ratio=54.19%, P=0.003; AP: DIM=0.39 cm/s, ratio=54.81%, P<0.001). BHL also had significantly higher velocity than UHL on the static scene (ML: DIM=0.23 cm/s, ratio=55.58%, P=0.003; AP: DIM=0.4, ratio=57.78%, P<0.001). Controls showed a small but significant increase in head velocity between dynamic and static visuals (ML: DIM=0.02 cm/s, ratio=5.65%, P=0.01; AP: DIM=0.15 cm/s, ratio=21.77%, P<0.001). We observed a significant group by visual interaction for BHL and UHL in the AP direction, such that both groups did not increase with the visuals as much as controls did (P=0.011 and 0.001 respectively). In addition, we observed a significant group by visual interaction for BHL vs. UHL in the ML direction, such that BHL increased head velocity with the dynamic visuals significantly more than UHL did (P=0.015). Figure 2 plots the estimated marginal means and confidence intervals for the RMSV data. Refer to Table 2 for RMSV values across groups for static and dynamic visual conditions.
Figure 2.

Head Root Mean Square Velocity (cm/s) in the medio-lateral direction (ML, left -side) and anterior-posterior direction (AP, right-hand side) for the 3 groups (control, bilateral hearing loss [BHL], unilateral hearing loss [UHL] across 2 levels of visual load (static, dynamic). The BHL group showed significantly higher velocity than controls or UHL on the static scene. Both BHL and UHL groups did not increase velocity AP with the dynamic visuals as much as controls did.
Table 2.
Model Estimate [95% Confidence Interval] for all study outcome measures per group and visual condition
| UHL Static | UHL Dynamic | Control Static | Control Dynamic | BHL Static | BHL Dynamic | |
|---|---|---|---|---|---|---|
| Root Mean Square Velocity ML (cm/s) | 0.418 [0.356-0.491] | 0.416 [0.355-0.488] | 0.422 [0.369-0.482] | 0.445 [0.390-0.509] | 0.650 [0.513-0.824] | 0.729 [0.576-0.924] |
| Root Mean Square Velocity AP (cm/s) | 0.692 [0.614-0.781] | 0.765 [0.679-0.863] | 0.705 [0.637-0.779] | 0.858 [0.776-0.950] | 1.092 [0.914-1.304] | 1.215 [1.017-1.451] |
| PSD 1 AP (cm2) | 0.286 [0.209-0.391] | 0.285 [0.208-0.390] | 0.368 [0.286-0.474] | 0.482 [0.375-0.621] | 0.476 [0.301-0.752] | 0.614 [0.389-0.969] |
| PSD 2 AP (cm2) | 0.043 [0.033-0.055] | 0.046 [0.036-0.059] | 0.055 [0.046-0.067] | 0.084 [0.069-0.102] | 0.075 [0.052-0.108] | 0.081 [0.056-0.116] |
| PSD 3 AP (cm2) | 0.006 [0.004-0.008] | 0.006 [0.005-0.008] | 0.009 [0.007-0.011] | 0.015 [0.012-0.019] | 0.014 [0.009-0.021] | 0.016 [0.011-0.024] |
3.3. Power Spectral Density
3.3.1. PSD 1
There were no observed significant differences in PSD 1 values across the age range. There were no significant differences observed between groups on the static scene. We observed a significant increase between static and dynamic visuals for controls (DIM=0.114 cm2, ratio=31.00%, P<0.001, Figure 3), and BHL (DIM=0.138, ratio=29.18% P=0.037), but not for the UHL group. We observed a significant group by visual interaction for the UHL group, in that UHL did not increase as much with dynamic visuals as controls did (P=0.014).
Figure 3.
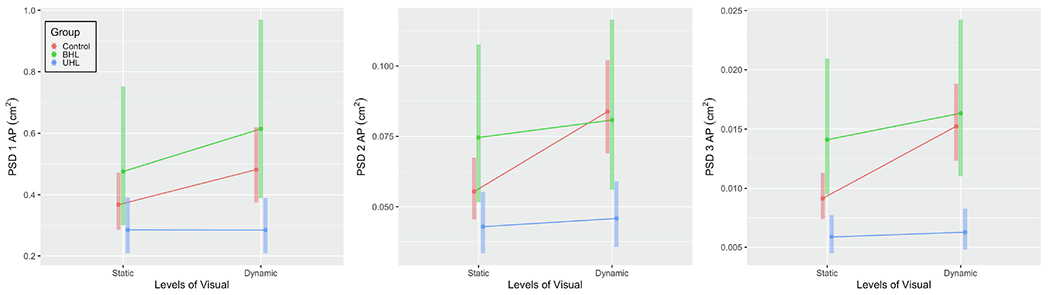
Head Power Spectral Density (PSD, cm2) in the anterior-posterior direction (AP) for the 3 groups (control, bilateral hearing loss [BHL], unilateral hearing loss [UHL] across 2 levels of visual load (static, dynamic). From left to right: PSD 1 [power at 0, 0.25 Hz]; PSD 2 [power at 0.25, 0.5 Hz]; and PSD 3 [power at 0.5, 1 Hz].
3.3.2. PSD 2
There were no observed significant differences in PSD 2 values across the age range. Adjusting for age, the BHL group was not significantly different than controls, but demonstrated significantly higher PSD 2 compared to the UHL group on the static scene (DIM=0.032 cm2, ratio=73.85, P=0.016, Figure 3). We observed a significant increase between static and dynamic visuals for controls (DIM=0.029 cm2, ratio=51.29, P<0.001), but not for the UHL group or the BHL group. We observed a significant group by visual interaction for the BHL and UHL groups for PSD 2 such that both groups did not increase with the visuals as much as controls did (P=0.013 and 0.002 respectively).
3.3.3. PSD 3
We observed a significant increase in PSD values across the age range (P=0.026). Adjusting for age, the BHL group was not significantly different than controls (Figure 3). The UHL group had significantly lower PSD 3 during static visuals than both controls (DIM=0.003, ratio= 35.60% lower, P=0.011) and the BHL group (DIM=0.008, ratio=58.19% lower, P<0.001). We observed a significant increase between static and dynamic visuals for all controls (DIM=0.006 cm2, ratio=66.36%, P<0.001). We also observed a significant group by visual interaction for the BHL and UHL groups for PSD 3, i.e., both groups did not increase with the visuals as much as controls did (P=0.013 and <0.001 respectively).
4. DISCUSSION
This study analyzed head sway in response to sensory perturbations in individuals with BHL, UHL and controls. Overall, head sway patterns in patients with hearing loss differed from controls. The BHL group had significantly higher ML RMSV than controls regardless of visual load and higher AP RMSV on the static scene. The UHL and BHL groups did not increase AP velocity with visuals as much as controls did. In addition, the UHL group showed significantly lower movements at high frequencies compared to the BHL group and controls. Although the BHL group was on average older, the model was adjusted for age, and age had little influence on head sway (only PSD 3 varied by age). Additionally, no observed differences in head sway were seen secondary to sound in this specific setup. Finally, severity of hearing loss did not contribute to our models, indicating that severity of hearing loss did not impact head sway RMSV or PSD.
Prior literature suggests that increased head sway velocity in the presence of dynamic visuals may be linked to balance impairment and increased fall risk. In our study, individuals with BHL did in fact demonstrate this increased head sway velocity. Individuals with BHL have also demonstrated balance impairment on a variety of postural assessments. Viljanen et al. [47] measured postural sway in 217 pairs of female twins with various levels of hearing acuity. They found that mean center-of-pressure velocity in both AP and ML directions during semi-tandem stance increased with increasing severity of hearing loss in the better hearing ear. The worst hearing group (>27dB in the better hearing ear) was noted to have the highest fall rate, with 30% of individuals in this group reporting two or more falls in the prior 12-month period. The BHL group in our study demonstrated significantly larger head ML sway than controls or the UHL group. Multiple studies have linked increased ML postural sway, measured through force plates, to an increased risk of falls. A retrospective study showed that individuals with a history of falls demonstrated increased ML center of pressure excursions measured through force plates [44]. Additionally, a prospective study using a laboratory-based assessment of ML postural sway accurately identified individuals prone to future falls falling with a success rate of 77% [45].
Although individuals with BHL in this study had no vestibular complaints or dizziness (including normal standardized measures of balance such as the ABC and VVAS), their objective head sway results indicate they are at higher risk for falling than controls or those with UHL. These findings support prior literature and suggest that screening of individuals with BHL for falls may be clinically warranted, regardless of age and lack of balance complaints. At present, there are numerous well-validated fall risk assessments that can be employed clinically, but it is not clear which may be most appropriate for those with hearing loss. While the TUG and FSST have been used to screen for fall risk, performance of our sample of people with BHL fell within the normal range for their age despite higher-than-normal head sway values. This suggests that no test in isolation can be used for fall prediction [46] and that a more comprehensive battery may be warranted, especially in individuals with HL. Specifically, instrumented assessments of balance may be needed to highlight specific aspects of balance deficits, but replication in larger samples is needed to confirm these findings.
There is minimal data in the literature reporting postural sway in individuals with UHL, compared to BHL. In the present study, participants with UHL, and to a certain extent those with BHL, appeared less responsive to dynamic visual stimulation than healthy controls (i.e., their head sway did not change to the same extent when the visual scene changed from static to dynamic). This is consistent with Lubetzky et al. [15], who found minimal increase in AP postural sway when visual load changed from static to dynamic in individuals with UHL using a similar paradigm. PSD analysis in the current study provides additional insight into postural patterns. Specifically, compared with controls, adults with UHL showed significantly lower power in mid-high and high frequency, typically considered to be characteristic of short, feedback loops, i.e., somatosensory activity, but not in low-frequencies, typically associated with feed-forward cortical loops. Prior studies on PSD have shown that somatosensory patterns of postural control predominate in patients with vestibular dysfunction. Specifically, Yoneda et al. [47] demonstrated that individuals with vestibular neuritis showed an increase in high frequency components in comparison to controls in eyes closed conditions suggesting increased somatosensory weight. Likewise, Baloh et al. [48] showed that individuals with bilateral vestibular dysfunction tended to show an increase in postural sway at higher frequencies (>2Hz) while standing on a moving platform with eyes closed. Our findings in the UHL group, namely reduced head sway in the presence of dynamic visuals compared to controls and the BHL group, are different than those observed in vestibular dysfunction. The strategy seen in people with UHL is consistent with a feed-forward strategy of planned postural behavior rather than reaction to sensory inputs [37]. Prior literature has suggested that some individuals with sensory loss may use a feed-forward mechanism, in which they rely on prior expectation and motor planning rather than responding to dynamic sensory cues. This conscious movement processing strategy, or the “Bayesian model theory”, has been exemplified in people with phobic postural vertigo or persistent postural-perceptual dizziness [16]. These individuals are symptomatic in complex visual environments and therefore overly attend to their motor plan rather than respond to changing visual cues, resulting in reduced sway in high frequencies or lack of changes with sensory perturbations [49]. Relatively little is known about postural performance of those with UHL and prior studies on head movement have focused primarily on behaviors related to sound localization. While disparate in methodology, Pastore et al., demonstrated increased head movement led to more accurate localization of sound in single sided deaf patients with their cochlear implant off compared to on or to controls [50]. In theory, known challenges related to sound location in those with UHL might suggest an overall predilection for increased head movement in this population. Even if true, it does not seem that behaviors related to sound localization could account for the head sway results of the UHL group. The present study intentionally utilized non-localizing, sinusoidal sound stimuli presented binaurally and did not present a localization challenge. More importantly, the UHL group demonstrated less head movement, not more, suggesting explanations based on localization behavior alone could not account for the study results. Further research needs to be performed in varying sensory environments to gain a greater understanding of the role of sensory integration on postural strategy in individuals with UHL and possible functional implications of conscious movement processing.
4.1. Limitations
This pilot study had a small sample size, and the results need to be replicated in larger studies to be generalized. In addition, the control and UHL groups were younger than the BHL group which may have contributed to RMSV ML differences, however our analysis adjusted for age and found that, other than for PSD 3, age was not a significant predictor of head sway. While severity of HL was also not influential in our models, additional studies are needed to investigate the role of severity and etiology of HL in balance function and dysfunction. Additionally, although they were asymptomatic, controls did not undergo comprehensive audiometry and therefore the model could not account for severity of HL in this group. To maintain consistency, all testing was performed in the unaided condition; while few participants used amplification in everyday listening, it is possible that testing in best aided or everyday listening condition would have influenced results. Additionally, it is possible that balance performance of individuals receiving appropriate hearing amplification may differ from those who chose not to use hearing aids. More data on the impact of amplification on postural control in individuals with hearing loss is necessary and warranted. Though patients completed standardized subjective balance questionnaires (notably the ABC and VVAS), none underwent vestibular diagnostic testing. As indicated above participants with hearing loss were evaluated by a neurotologist to rule out any vestibular involvement and had no vestibular complaints.
5. Conclusions
In conclusion, this study demonstrates that individuals with HL can have impaired balance in comparison with controls, even when controlled for age and HL severity. Adults with BHL demonstrated a pattern of balance impairment (increased head sway, particularly in the ML direction) suggestive of increased fall risk and encourages clinical assessment of fall risk in this population with sensitive tools. Despite mounting evidence regarding balance dysfunction and fall risk in people with BHL [43–45,51], these individuals are not typically referred to fall prevention programs or balance training. Further understanding of the mechanism underlying postural instability in individuals with BHL is needed to guide intervention, prevent falls and ultimately improve quality of life. The present study showed individuals with UHL demonstrate reduced responses to sensory stimuli, a unique pattern of sensory integration difficulty that does not mimic the patterns seen in BHL or normal controls. Implications for fall risk and functional mobility in the UHL population remain unknown and warrant further investigation. Further studies are needed to confirm and understand differences in postural strategies between those with BHL and UHL so as to ultimately guide interventions that are sensitive and tailored to each patient’s needs.
Highlights.
Head sway may provide further information for balance impairment.
People with Bilateral Hearing Loss increased head sway during dynamic visuals.
People with Unilateral Hearing Loss increased head sway to a lesser extent.
Clinicians should evaluate Bilateral Hearing Loss for possible fall risk.
Acknowledgements
The authors wish to acknowledge Zhu Wang, PhD, New York University, Post-doctoral fellow Courant Institute of Mathematical Sciences, for developing the virtual reality application and technical support.
Funding and Role of Funding Source
This study was funded by an R21DC018101 Early Career Researcher grant from the National Institute on Deafness and Other Communication Disorders (NIDCD). The sponsors had no role in the study design, collection, analysis and interpretation of data; in the writing of the manuscript; or in the decision to submit the manuscript for publication. The content is solely the responsibility of the authors and does not necessarily represent the official views of the National Institutes of Health.
Abbreviations
- HL
Hearing loss
- HMD
Head mounted display
- BHL
Bilateral hearing loss
- UHL
Unilateral hearing loss
- RMSV
Root Mean Square Velocity
- PSD
Power Spectral Density
- AP
Anterior-Posterior
- ML
Medio-Lateral
- SSQ
Simulator Sickness Questionnaire
- ABC
Activities Balance Confidence
- DHI
Dizziness Handicap Inventory
- VVAS
Visual Vertigo Analog Scale
- TUG
Timed Up and Go
- FSST
Four Square Step Test
- ANSI
American National Standards Institute
- AIC
Akaike information criterion
- BIC
Bayesian information criterion
- Min
Minimum
- Max
Maximum
- SD
Standard Deviation
- DIM
Difference in means
Footnotes
Publisher's Disclaimer: This is a PDF file of an unedited manuscript that has been accepted for publication. As a service to our customers we are providing this early version of the manuscript. The manuscript will undergo copyediting, typesetting, and review of the resulting proof before it is published in its final form. Please note that during the production process errors may be discovered which could affect the content, and all legal disclaimers that apply to the journal pertain.
Declaration of interest
None.
Dr. Cosetti is an unpaid consultant for Cochlear Americas and reported unpaid participation in research on cochlear implants and other implantable devices manufactured by Cochlear Ltd and, MED-El outside the submitted work.
Compliance with Ethical Standards
We declare that this manuscript is original, has not been published before, and is not currently being considered for publication elsewhere.
References
- [1].Agmon M, Lavie L, Doumas M. The Association between Hearing Loss, Postural Control, and Mobility in Older Adults: A Systematic Review. J Am Acad Audiol 2017;28:575–88. 10.3766/jaaa.16044. [DOI] [PubMed] [Google Scholar]
- [2].Bang S-H, Jeon J-M, Lee J-G, Choi J, Song J-J, Chae S-W. Association Between Hearing Loss and Postural Instability in Older Korean Adults. JAMA Otolaryngol Head Neck Surg 2020;146:530. 10.1001/jamaoto.2020.0293. [DOI] [PMC free article] [PubMed] [Google Scholar]
- [3].Carpenter MG, Campos JL. The Effects of Hearing Loss on Balance: A Critical Review. Ear and Hearing 2020;41:107S. 10.1097/AUD.0000000000000929. [DOI] [PubMed] [Google Scholar]
- [4].Lin FR, Ferrucci L. Hearing Loss and Falls Among Older Adults in the United States. Arch Intern Med 2012;172:369–71. 10.1001/archinternmed.2011.728. [DOI] [PMC free article] [PubMed] [Google Scholar]
- [5].Chen DS, Betz J, Yaffe K, Ayonayon HN, Kritchevsky S, Martin KR, et al. Association of Hearing Impairment with Declines in Physical Functioning and the Risk of Disability in Older Adults. J Gerontol A Biol Sci Med Sci 2015;70:654–61. 10.1093/gerona/glu207. [DOI] [PMC free article] [PubMed] [Google Scholar]
- [6].Cunningham LL, Tucci DL. Hearing Loss in Adults. N Engl J Med 2017;377:2465–73. 10.1056/NEJMral616601. [DOI] [PMC free article] [PubMed] [Google Scholar]
- [7].Lubetzky AV, Gospodarek M, Arie L, Kelly J, Roginska A, Cosetti M. Auditory Input and Postural Control in Adults: A Narrative Review. JAMA Otolaryngology–Head & Neck Surgery 2020;146:480–7. 10.1001/jamaoto.2020.0032. [DOI] [PubMed] [Google Scholar]
- [8].Sozzi S, Decortes F, Schmid M, Crisafulli O, Schieppati M. Balance in Blind Subjects: Cane and Fingertip Touch Induce Similar Extent and Promptness of Stance Stabilization. Front Neurosci 2018;12. 10.3389/fnins.2018.00639. [DOI] [PMC free article] [PubMed] [Google Scholar]
- [9].Lubetzky AV, Harel D, Kelly J, Hujsak BD, Perlin K. Weighting and reweighting of visual input via head mounted display given unilateral peripheral vestibular dysfunction. Human Movement Science 2019;68:102526. 10.1016/j.humov.2019.102526. [DOI] [PubMed] [Google Scholar]
- [10].Maheu M, Sharp A, Pagé S, Champoux F. Congenital Deafness Alters Sensory Weighting for Postural Control. Ear and Hearing 2017;38:767–70. 10.1097/AUD.0000000000000449. [DOI] [PubMed] [Google Scholar]
- [11].Choi JS, Wu F, Park S, Friedman RA, Kari E, Volker CCJ. Factors Associated With Unilateral Hearing Loss and Impact on Communication in US Adults. Otolaryngol Head Neck Surg 2021;165:868–75. 10.1177/0194599821995485. [DOI] [PubMed] [Google Scholar]
- [12].Golub JS, Lin FR, Lustig LR, Lalwani AK. Prevalence of adult unilateral hearing loss and hearing aid use in the United States. Laryngoscope 2018;128:1681–6. 10.1002/lary.27017. [DOI] [PubMed] [Google Scholar]
- [13].Lin FR, Niparko JK, Ferrucci L. Hearing Loss Prevalence in the United States. Arch Intern Med 2011; 171:1851–2. 10.1001/archinternmed.2011.506. [DOI] [PMC free article] [PubMed] [Google Scholar]
- [14].Nelson E, Reeder RM, Holden LK, Firszt JB. Front- and rear-facing horizontal sound localization results in adults with unilateral hearing loss and normal hearing. Hearing Research 2019;372:3–9. 10.1016/j.heares.2018.03.016. [DOI] [PubMed] [Google Scholar]
- [15].Lubetzky AV, Kelly JL, Harel D, Roginska A, Hujsak BD, Wang Z, et al. Insight into postural control in unilateral sensorineural hearing loss and vestibular hypofunction. PLOS ONE 2022; 17:e0276251. 10.1371/journal.pone.0276251. [DOI] [PMC free article] [PubMed] [Google Scholar]
- [16].Edwards MJ, Adams RA, Brown H, Pareés I, Friston KJ. A Bayesian account of ‘hysteria.’ Brain 2012;135:3495–512. 10.1093/brain/awsl29. [DOI] [PMC free article] [PubMed] [Google Scholar]
- [17].Mochizuki L, Duarte M, Amadio AC, Zatsiorsky VM, Latash ML. Changes in Postural Sway and Its Fractions in Conditions of Postural Instability. Journal of Applied Biomechanics 2006;22:51–60. 10.1123/jab.22.1.51. [DOI] [PubMed] [Google Scholar]
- [18].Lubetzky AV, Coker E, Arie L, Aharoni MMH, Krasovsky T. Postural Control under Cognitive Load: Evidence of Increased Automaticity Revealed by Center-of-Pressure and Head Kinematics. Journal of Motor Behavior 2022;54:466–79. 10.1080/00222895.2021.2013768. [DOI] [PubMed] [Google Scholar]
- [19].Powell GM, Dzendolet E. Power Spectral Density Analysis of Lateral Human Standing Sway. Journal of Motor Behavior 1984;16:424–41. 10.1080/00222895.1984.10735330. [DOI] [PubMed] [Google Scholar]
- [20].Meshkati Z, Namazizadeh M, Salavati M, Mazaheri M. Reliability of Force-Platform Measures of Postural Sway and Expertise-Related Differences. Journal of Sport Rehabilitation 2011;20:442–56. 10.1123/jsr.20.4.442. [DOI] [PubMed] [Google Scholar]
- [21].Geurts A, Nienhuis B, Mulder T. Intrasubject variability of selected Force-Platform parameters in the quantification of postural control. Archives of Physical Medicine and Rehabilitation 1993;74:1144–50. [PubMed] [Google Scholar]
- [22].Røgind H, Lykkegaard JJ, Bliddal H, Danneskiold-Samsøe B. Postural sway in normal subjects aged 20–70 years. Clinical Physiology and Functional Imaging 2003;23:171–6. 10.1046/j.1475-097X.2003,00492.x. [DOI] [PubMed] [Google Scholar]
- [23].Saldana SJ, Marsh AP, Rejeski WJ, Haberl JK, Wu P, Rosenthal S, et al. Assessing balance through the use of a low-cost head-mounted display in older adults: a pilot study. Clin Interv Aging 2017;12:1363–70. 10.2147/CIA.S141251. [DOI] [PMC free article] [PubMed] [Google Scholar]
- [24].Ribo M, Pinz A, Fuhrmann AL. A new optical tracking system for virtual and augmented reality applications. IMTC 2001. Proceedings of the 18th IEEE Instrumentation and Measurement Technology Conference. Rediscovering Measurement in the Age of Informatics; (Cat. No.01CH 37188), vol. 3, 2001, p. 1932–6 vol.3. 10.1109/IMTC.2001.929537. [DOI] [Google Scholar]
- [25].Lubetzky AV, Wang Z, Krasovsky T. Head mounted displays for capturing head kinematics in postural tasks. J Biomech 2019;27:175–82. 10.1016/jjbiomech.2019.02.004. [DOI] [PubMed] [Google Scholar]
- [26].Marchetto J, Wright WG. The Validity of an Oculus Rift to Assess Postural Changes During Balance Tasks. Hum Factors 2019;61:1340–52. 10.1177/0018720819835088. [DOI] [PubMed] [Google Scholar]
- [27].Dobie RA, Hemel SV, National Research Council (US) Committee on Disability Determination for Individuals with Hearing Impairments. American National Standards on Acoustics. National Academies Press; (US: ); 2004. [Google Scholar]
- [28].Goman AM, Lin FR. Prevalence of Hearing Loss by Severity in the United States. Am J Public Health 2016;106:1820–2. 10.2105/AJPH.2016.303299. [DOI] [PMC free article] [PubMed] [Google Scholar]
- [29].Olusanya BO, Davis AC, Hoffman HJ. Hearing loss grades and the International classification of functioning, disability and health. Bull World Health Organ 2019;97:725–8. 10.2471/BLT.19.230367. [DOI] [PMC free article] [PubMed] [Google Scholar]
- [30].Lubetzky AV, Wang Z, Krasovsky T. Head mounted displays for capturing head kinematics in postural tasks. Journal of Biomechanics 2019;86:175–82. 10.1016/jjbiomech.2019.02.004. [DOI] [PubMed] [Google Scholar]
- [31].Polastri PF, Barela JA. Adaptive visual re-weighting in children’s postural control. PLoS ONE 2013;8:e82215. 10.1371/journal.pone.0082215. [DOI] [PMC free article] [PubMed] [Google Scholar]
- [32].Kennedy R, Fowlkes J, Berbaum K, Lilienthal M. Use of a motion sickness history questionnaire for prediction of simulator sickness. Aviation, Space, and Environmental Medicine 1992;63:588–593. [PubMed] [Google Scholar]
- [33].Lusardi MM, Fritz S, Middleton A, Allison L, Wingood M, Phillips E, et al. Determining Risk of Falls in Community Dwelling Older Adults: A Systematic Review and Meta-analysis Using Posttest Probability. Journal of Geriatric Physical Therapy 2017;40:1–36. 10.1519/JPT.0000000000000099. [DOI] [PMC free article] [PubMed] [Google Scholar]
- [34].Dannenbaum E, Chilingaryan G, Fung J. Visual vertigo analogue scale: An assessment questionnaire for visual vertigo. Journal of Vestibular Research: Equilibrium & Orientation 2011;21:153–9. 10.3233/ves-2011-0412. [DOI] [PubMed] [Google Scholar]
- [35].Shumway-Cook A, Brauer S, Woollacott M. Predicting the Probability for Falls in Community-Dwelling Older Adults Using the Timed Up & Go Test. Physical Therapy 2000;80:896–903. 10.1093/ptj/80.9.896. [DOI] [PubMed] [Google Scholar]
- [36].Soames RW, Atha J. The spectral characteristics of postural sway behaviour. Europ J Appl Physiol 1982;49:169–77. 10.1007/BF02334065. [DOI] [PubMed] [Google Scholar]
- [37].Palmieri RM, Ingersoll CD, Stone MB, Krause BA. Center-of-Pressure Parameters Used in the Assessment of Postural Control. Journal of Sport Rehabilitation 2002;11:51–66. 10.1123/jsr.11.1.51. [DOI] [Google Scholar]
- [38].Pau M, Kim S, Nussbaum MA. Does load carriage differentially alter postural sway in overweight vs. normal-weight schoolchildren? Gait & Posture 2012;35:378–82. 10.1016/j.gaitpost.2011.10.354. [DOI] [PubMed] [Google Scholar]
- [39].Bronstein AM. Chapter 4-Multisensory integration in balance control. In: Furman JM, Lempert T, editors. Handbook of Clinical Neurology, vol. 137, Elsevier; 2016, p. 57–66. 10.1016/B978-0-444-63437-5.00004-2. [DOI] [PubMed] [Google Scholar]
- [40].Fujimoto C, Egami N, Demura S, Yamasoba T, Iwasaki S. The effect of aging on the center-of-pressure power spectrum in foam posturography. Neuroscience Letters 2015;585:92–7. 10.1016/j.neulet.2014.ll.033. [DOI] [PubMed] [Google Scholar]
- [41].Gelman A, Hill J. Data Analysis Using Regression and Multilevel/Hierarchical Models. Cambridge University Press; 2006. [Google Scholar]
- [42].Kackar RN, Harville DA. Approximations for Standard Errors of Estimators of Fixed and Random Effect in Mixed Linear Models. Journal of the American Statistical Association 1984;79:853–62. 10.2307/2288715. [DOI] [Google Scholar]
- [43].Viljanen A, Kaprio J, Pyykkö I, Sorri M, Pajala S, Kauppinen M, et al. Hearing as a Predictor of Falls and Postural Balance in Older Female Twins. The Journals of Gerontology Series A: Biological Sciences and Medical Sciences 2009;64A:312. 10.1093/gerona/gln015. [DOI] [PMC free article] [PubMed] [Google Scholar]
- [44].Maki BE, Holliday PJ, Topper AK. A Prospective Study of Postural Balance and Risk of Falling in An Ambulatory and Independent Elderly Population. Journal of Gerontology 1994;49:M72–84. 10.1093/geronj/49.2M72. [DOI] [PubMed] [Google Scholar]
- [45].Brauer SG, Burns YR, Galley P. A Prospective Study of Laboratory and Clinical Measures of Postural Stability to Predict Community-Dwelling Fallers. The Journals of Gerontology: Series A 2000;55:M469–76. 10.1093/gerona/55.8M469. [DOI] [PubMed] [Google Scholar]
- [46].Barry E, Galvin R, Keogh C, Horgan F, Fahey T. Is the Timed Up and Go test a useful predictor of risk of falls in community dwelling older adults: a systematic review and meta-analysis. BMC Geriatrics 2014;14:14. 10.1186/1471-2318-14-14. [DOI] [PMC free article] [PubMed] [Google Scholar]
- [47].Yoneda S, Tokumasu K. Frequency Analysis of Body Sway in the Upright Posture Statistical Study in Cases of Peripheral Vestibular Disease. Acta Oto-Laryngologica 1986;102:87–92. 10.3109/00016488609108650. [DOI] [PubMed] [Google Scholar]
- [48].Baloh RW, Jacobson KM, Beykirch K, Honrubia V. Static and Dynamic Posturography in Patients With Vestibular and Cerebellar Lesions. Archives of Neurology 1998;55:649–54. 10.1001/archneur.55.5.649. [DOI] [PubMed] [Google Scholar]
- [49].Lubetzky AV, Aharoni MMH, Arie L, Krasovsky T. People with persistent postural-perceptual dizziness demonstrate altered postural strategies in complex visual and cognitive environments. J Vestib Res 2021. 10.3233/VES-201552. [DOI] [PubMed] [Google Scholar]
- [50].Pastore MT, Natale SJ, Clayton C, Dorman MF, Yost WA, Zhou Y. Effects of Head Movements on Sound-Source Localization in Single-Sided Deaf Patients With Their Cochlear Implant On Versus Off. Ear Hear 2020;41:1660–74. 10.1097/AUD.0000000000000882. [DOI] [PMC free article] [PubMed] [Google Scholar]
- [51].Jiam NT-L, Li C, Agrawal Y. Hearing loss and falls: A systematic review and meta-analysis. Laryngoscope 2016;126:2587–96. 10.1002/lary.25927. [DOI] [PubMed] [Google Scholar]