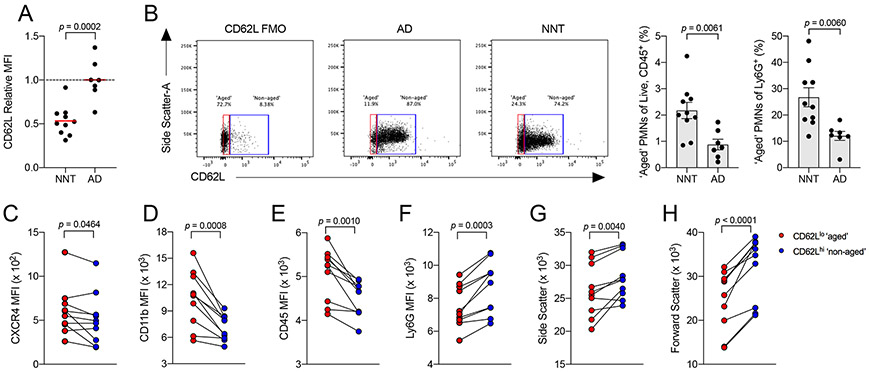
Figure 3: Circulating neutrophils in neonatal mice bias towards an ‘aged’ phenotype.
[A] MFI of CD62L on peripheral blood neutrophils from NNT (n = 10) versus AD mice (n = 7).
[B] Frequency of CD62Llo ‘aged’ neutrophils from peripheral blood of NNT (n = 10) versus AD mice (n = 7) as proportion of all hematopoietic cells [Live, CD45+ cells] (left) and of all neutrophils [Ly6G+ cells] (right); FMO, fluorescence-minus-one control.
[C-H] MFI analysis of known markers between CD62Llo ‘aged’ (red dots) and CD62Lhi ‘non-aged’ (blue dots) neutrophils in neonatal blood (n = 10). Each data point represents a biological replicate (refer to STAR Methods for number of mice pooled), and data are representative of experiments repeated three times. Data with error bars are presented as mean ± SEM. N.S., not significant. See also Figure S2.

