Abstract
Background:
Abnormal brain growth in tuberous sclerosis complex (TSC) reflects abnormalities in cellular proliferation and differentiation, and results in epilepsy and other neurological manifestations. Head circumference (HC) as a proxy for brain volume may provide an easily tracked clinical measure of brain overgrowth and neurological disease burden. This study investigated the relationship between HC and epilepsy severity in infants with TSC.
Methods:
Prospective multicenter observational study of children from birth to 3 years with tuberous sclerosis complex. Epilepsy data was collected from clinical history and HC were collected at study visits at age three, six, nine, 12, 18, 24, and 36 months. Epilepsy severity was classified as: no epilepsy, low epilepsy severity (1 seizure type and 1 or 2 anti-epileptic drugs (AEDs)), moderate epilepsy severity (either 2–3 seizure types and 1–2 AEDs; or 1 seizure type and 3+ AEDs), or high epilepsy severity (2–3 seizure types and 3+ AEDs).
Results:
As a group, children with TSC had HCs approximately 1 standard deviation above the mean World Health Organization (WHO) reference by one year of age and demonstrated more rapid growth than the normal population reference. Males with epilepsy had larger HCs than those without. Compared to the WHO reference population, infants with TSC and no epilepsy or low or moderate epilepsy had an increased early HC growth rate, while those with severe epilepsy had an early larger HC but did not have a faster growth rate.
Conclusions:
Infants and young children with TSC have larger head circumferences than typical growth norms and have differing rates of head growth depending on the severity of epilepsy.
Keywords: tuberous sclerosis complex, epilepsy, head circumference, growth curve
Introduction
Tuberous sclerosis complex (TSC) is a genetic disorder characterized by cellular overgrowth that produces hamartomas, or benign tumors, throughout the body. Hamartomas form most commonly in the brain parenchyma where they are termed tubers. TSC is associated with a lifetime epilepsy prevalence of 70–90% and an autism spectrum disorder (ASD) prevalence of 40–50% (Portocarrero LKL, 2018). The abnormal cells in tubers take the place of healthy cells, rather than adding to the total number of cells in the brain (Crino, 2010), and reports on increased head circumference (HC) and macrocephaly (HC greater than 2 standard deviations above the mean) in TSC are sparse (Fidler DJ, 2000). Increased HC may reflect increased cerebral parenchymal volume and/or cerebrospinal fluid (CSF) volume (Bartholomeusz HH, 2002). Macrocephaly occurs at a rate of 14–29.7% in TSC and other developmental disorders together, but the rate of macrocephaly in the TSC population alone has not previously been reported (Fidler DJ, 2000) (Webb DW, 1996). The relationship between HC and epilepsy in TSC has also not been previously studied.
Approximately 90% of all TSC patients experience seizures (Vignoli, 2015) (Chu-Shore, 2010). The number of tubers in the brain is correlated to the frequency of seizures and tuber location is known to play a role in the type of seizure in an individual with epilepsy and TSC (Doherty C, 2005). However, there is no single location in the brain that is necessarily associated with having infantile spasms. Tubers associated with infantile spams are more likely to be connected to the globi pallidi and cerebellar vermis; tubers not associated with infantile spasms are not found to have this same connection. This connection has been demonstrated as a stronger predictor of infantile spasms than tuber burden (Cohen AL, 2021). In the TSC population, 74.5% of individuals who had infantile spasms in infancy later developed refractory epilepsy (Chu-Shore, 2010). The longer infantile spasms go unrecognized and untreated the more likely the child is to develop refractory epilepsy and developmental disorders (Shields, 2018). When seizures are untreated or refractory to treatment, individuals are at greater risk for an epileptic encephalopathy and worse neurodevelopmental outcomes (Capal JK, 2017). Early recognition and treatment of seizures is likely associated with better clinical outcomes. In a recent study, patients with TSC but without seizures were monitored monthly by EEG and randomized to preventative treatment of epilepsy once epileptiform EEG activity was detected, but before the first clinical seizure. Patients who receive preventative treatment had significantly longer until their first clinical seizure compared to their counterparts who did not receive preventative treatment (Kotulska K, 2021).
In this study, we evaluated the relationship between HC and epilepsy severity in infants with TSC. We hypothesized that cerebral overgrowth, reflecting tuber burden, is likely to affect both HC and epilepsy severity (Doherty C, 2005). If so, increased HC or acceleration in HC growth rates in infants with TSC may correlate with epilepsy risk or severity.
Methods
Participants in this study were enrolled in the TSC Autism Center of Excellence Network (TACERN) at five sites across the United States (Boston Children’s Hospital, Cincinnati Children’s Hospital Medical Center, University of Alabama at Birmingham, University of California at Los Angeles, and University of Texas at Houston). Infants were eligible for the TACERN study if they were diagnosed with TSC before 12 months of age. Infants were followed longitudinally at 3, 6, 9, 12, 18, 24, and 36 months of age. Because infants could be enrolled into the TACERN study any time before their first birthday, some did not have early study visits. At each study visit, EEG, clinical history, seizure diaries, and physical exam including head circumference measurement were collected. Yearly clinical neuroimaging MRI on each participant were also collected (full study design, inclusion and exclusion criteria and collected information is reported in (Davis P. E.-D., 2017)). From the large set of available data, we used age, epilepsy history, head circumference, MRIs, and available genetic testing results. Subjects were excluded based on the following criteria: premature birth (before 37 weeks estimated gestational age), lack of documented clinical epilepsy history, or lack of head circumference measurements. We also excluded three subjects with documented hydrocephalus or large cysts on imaging. All other participants in the cohort were included, a total of 153 individuals. Table 1 lists subject demographics.
Table 1.
Patient Characteristics
| No epilepsy | Low | Moderate | High | Total | P | |
|---|---|---|---|---|---|---|
| Female | 14 | 14 | 20 | 31 | 79 | |
| Male | 21 | 11 | 21 | 21 | 74 | |
| Total | 35 | 25 | 41 | 52 | 153 | 0.31 |
| TSC1 | 10 | 2 | 3 | 1 | 16 | |
| TSC2 | 17 | 18 | 25 | 44 | 104 | |
| NMI | 4 | 3 | 3 | 4 | 14 | |
| Total | 31 | 23 | 31 | 49 | 134 | 0.005 |
| Age at first seizure onset (months) Median (Min, Max) | n/a | 6.3 (0.8, 20.1) | 5.8 (1.2, 22.8) | 4.2 (0.03, 11.1) | All seizure patients 4.8 (0.03, 22.8) | 0.03 |
First 2 P values are chi-square, last is Kruskal-Wallis ANOVA
NMI = No Mutation Identified
All head circumference (HC) measurements were individually reviewed for possible errors. Study sites were queried for any measurement with a greater than 1 standard deviation change from one timepoint to the next, as well as measurements that appeared likely to be erroneous (e.g. a smaller head circumference at older age, or a single outlying measurement in a sequence of consecutive measurements). If the site could not confirm that the measurement was accurate or provide a corrected measurement, that data point was excluded from analysis.
World Health Organization (WHO) head circumference data for healthy children from birth to age five was used as a normal reference. The WHO collected data on 8,440 healthy infants from diverse ethnic backgrounds to create growth curves (World Health Organization, 2014). This data was used to calculate head circumference z-scores for each subject’s head circumference measurement at each time point based on their age and sex. Z-scores were used to compare male and female subjects directly.
Epilepsy history was reviewed by clinician interview at each study visit. Parents were also asked to keep seizure diaries indicating the frequency and types of their child’s seizures. We used the number of seizure types in combination with the number of anti-epileptic drugs (AEDs) used by each participant experienced as a proxy for epilepsy severity (counting all focal seizures as one type, epileptic spasms as a second type, and all other seizure types as a third type). Number of seizure types and number of AEDs have previously been a part of standardized epilepsy severity scales (Humphrey, 2008). The following classification was used: no epilepsy, low epilepsy severity (1 seizure type and 1 or 2 AEDs), moderate epilepsy severity (either 2–3 seizure types and 1–2 AEDs; or 1 seizure type and 3+ AEDs), or high epilepsy severity (2–3 seizure types and 3+ AEDs). There were three subjects who had a history of taking 1–2 AEDs but never developed epilepsy. It is possible they were treated preventively for an abnormal EEG without clinical seizures (Kotulska K, 2021). These three subjects were included in the no epilepsy group.
Brain MRIs were read clinically by radiologists at each participant’s respective site, and they were volumetrically analyzed by the Warfield lab at Boston Children’s Hospital. Volumetric analysis calculated total brain volume and volume of different tissue types (white matter, subcortical grey matter, and cortical grey matter, and ventricular and extracerebral cerebrospinal fluid) based on image signal intensity (Tomas-Fernandez, 2015). The volume of white matter, cortical, and subcortical grey matter, including any tubers, were combined into a single parenchymal volume. Ventricular and extracerebral spinal fluid (CSF) volumes were combined into a single CSF volume. Subject brain MRI volumetric measures were excluded if they had epilepsy surgery or another potentially confounding condition (e.g. hydrocephalus), that could potentially skew these measures. The clinical radiologists reported other notable brain abnormalities that would be grounds for exclusion. We previously found in a subset of individuals from this cohort with MRI data (n=115) that 94% had tubers reported on brain MRI (Davis P. E.-D., 2017).
Data were fitted to linear mixed-effects models to identify significant associations between covariates and outcomes of interest while adjusting for log-transformed age and sex. These models allow use of longitudinal measures collected at different ages (Diggle P, 2002). Models were estimated using the fitlme function in MATLAB R2019b (The MathWorks Inc., Natick, MA) and compared using likelihood ratio test, Akaike information criterion, and Bayesian information criterion. Fixed-effects covariates were log-transformed age in years, sex, epilepsy severity (None, Low, Moderate, and High as described above), and presence or absence of infantile spasms, focal seizures, or both. The interaction between epilepsy severity and log-transformed age was also included as a fixed effect. Subject-specific effects of age were included as random effects in the model. Models were fitted using response variables of HC z-score and HC in centimeters. For volumetric analysis models, response variables were parenchymal or CSF volume with HC in centimeters as the only fixed-effect covariate. Age was not included as a fixed effect in these models; however, age was included as a random effect.
Results
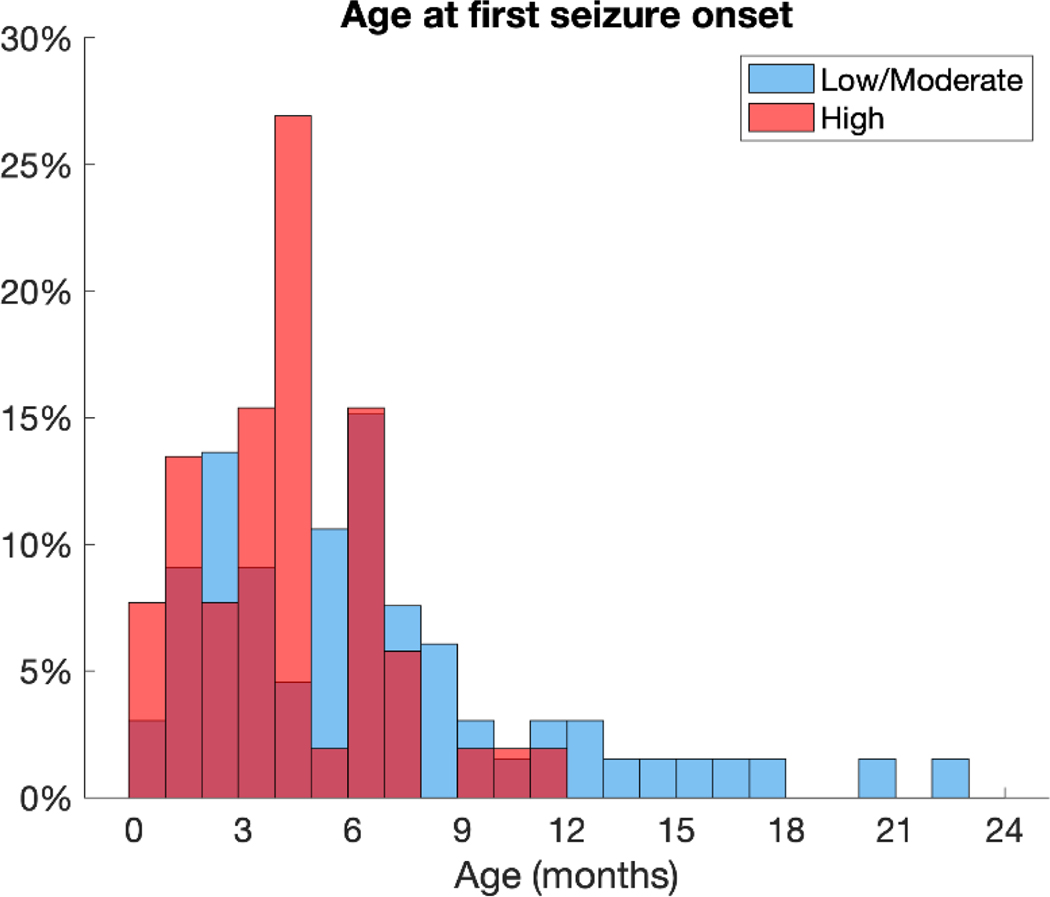
The TACERN study initially enrolled 169 infants and toddlers and 153 met inclusion criteria for this study (79 females, 74 males). The population was skewed towards individuals with a more severe epilepsy phenotype: there were 52 patients with high epilepsy severity, 41 with moderate epilepsy severity, 25 with low epilepsy severity, and 35 with no epilepsy. Those with a TSC2 variant were more likely to have high epilepsy severity than those with a TSC1 variant or no mutation identified (NMI). There were no significant differences in the number of males and females with each genetic variant. The mean age at seizure onset was 168 days (5.6 months), with a median of 144 days (4.8 months) and a range of 1–685 days (22.8 months). Age at first seizure onset was younger in the high epilepsy severity group (mean 129 days, median 126 days, range 1–332 days) than in the moderate epilepsy severity group (mean 188 days, median 174 days, range 35–685 days) or the low epilepsy severity group (mean 218 days, median 188 days, range 23–603) (Figure 1). Subject characteristics are summarized in Table 1.
Figure 1:
Histogram of age at first seizure shows that epilepsy onset was within the first year of life for most individuals and skewed to younger ages. The mean age at onset was 168 days (5.6 months), with a median of 144 days (4.8 months) and a range of 1–685 days (22.8 months). Age at first seizure onset was younger in the high epilepsy severity group (mean 129 days [4.3 months], median 126 days [4.2 months], range 1–332 days [0.03 – 11.1 months]) than in the moderate epilepsy severity group (mean 188 days [6.3 months], median 174 days [5.8 months], range 35–685 days [1.2 – 22.8 months]) or the low epilepsy severity group (mean 218 days [7.3 months], median 188 days [6.3 months], range 23–603 days [0.8 – 20.1 months]). The low and moderate severity groups are combined in the figure for clearer visualization.
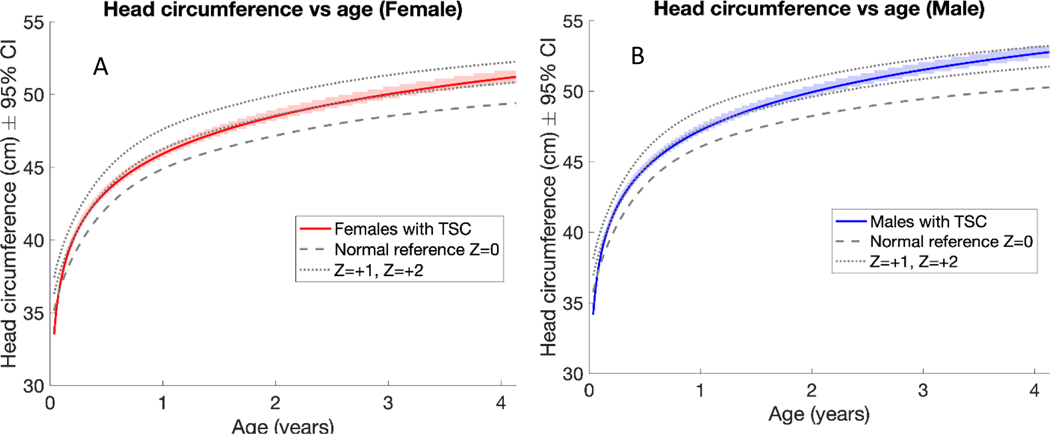
The HCs of individuals with TSC were approximately 1 standard deviation above the mean WHO reference by one year of age (Figure 2). At one year of age, females with TSC had an average HC of 45.9 cm, while females in the general population had an average HC of about 44.9 cm (Figure 2A). At one year of age, males with TSC had an average HC of 47.2 cm, while males in the general population had an average HC of about 46.1 cm (Figure 2B). As in the general population, males with TSC had larger HCs than females with TSC at the same ages. The rate of HC growth did not differ significantly between females and males with TSC (3.7 and 3.9 cm/log year, respectively), and both had a faster growth rate than the WHO reference population (3.4 cm/log year).
Figure 2:
Linear mixed effects model estimates of female patients with TSC (A) and male patients with TSC (B) compared to the normal WHO reference, revealed both sexes were almost 1 standard deviation above the normal WHO reference by one year of age. Males and females with TSC did not differ significantly in head circumference growth rate but had a higher growth rate than the normal population. As in the general population, males with TSC had larger head circumferences than females with TSC at the same ages.
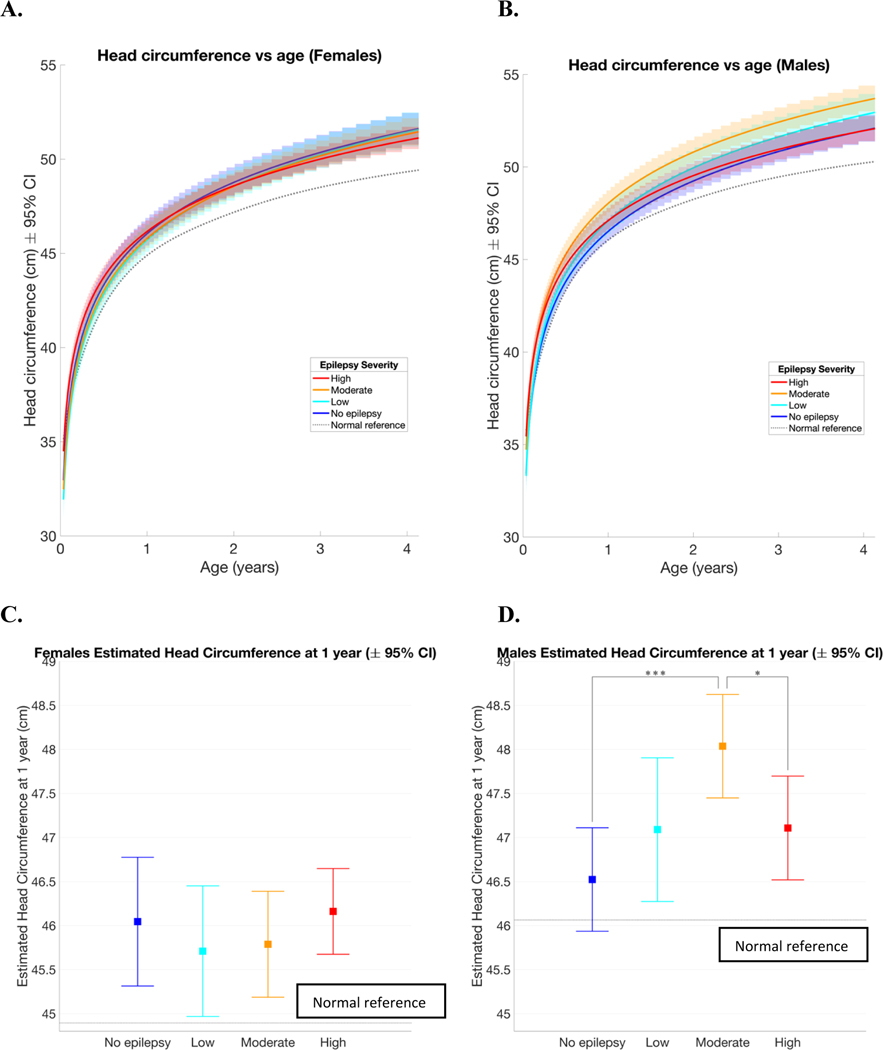
As seen in Figure 3, including epilepsy severity in the model showed small differences in head circumference in each group depending on sex. Males with TSC and moderate epilepsy severity had larger HCs than other males, whereas females did not differ significantly across epilepsy severity groups (Figure 3 A and B). At 1 year of age, females with TSC and no epilepsy had an average estimated HC of 46.04 cm, females with low epilepsy severity had an average estimated HC of 45.71 cm, females with moderate epilepsy severity had an average estimated HC of 45.79 cm, and females with high epilepsy severity had an average estimated HC of 46.16 cm. None of these groups had HC that were significantly different from each other (Figure 3C). All 4 groups were significantly larger than the normal WHO reference (when α =0.05). At 1 year of age, males with TSC and no epilepsy had an average HC of 46.52 cm, males with low epilepsy severity had an average estimated HC of 47.09 cm, males with moderate epilepsy severity had an average estimated HC of 48.04 cm, and males with high epilepsy severity had an average estimated HC of 47.11 cm. The HC of males with moderate epilepsy severity was significantly greater than males without epilepsy and males with severe epilepsy (when α =0.05; Figure 3D). Additionally, males with all epilepsy severities had significantly larger HC than the normal WHO reference (when α =0.05; Figure 3D).
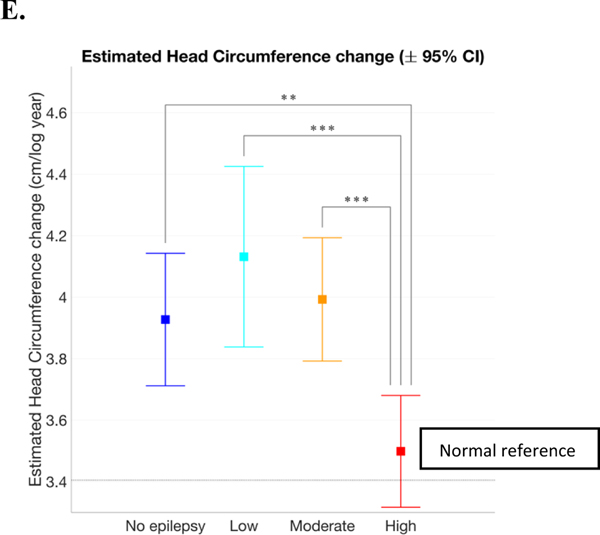
Figure 3:
Linear mixed effects model estimates of head circumference versus age of females and males. Females had more overlap between the groups (A) than males (B). There was no significant difference between all female seizure groups head circumference at 1 year of age, but all were significantly larger than the normal reference (C). Males with moderate severity epilepsy had larger head circumferences at 1 year of age than males without epilepsy and males with severe epilepsy. Males with all severities of epilepsy were significantly larger than the normal reference (D). The same rate of head growth was estimated for males and females within each seizure group. The group with the highest severity epilepsy had a lower rate of head circumference growth than the other groups and was the only group whose growth rate did not differ significantly from the normal reference (E). In all figures, the dotted line represents the WHO normal reference. *p<.05, **p<.01, ***p<.001
The same rate of growth was estimated for males and females within each seizure group. The group with high epilepsy severity had a lower rate of head circumference growth than the no epilepsy, low, and moderate severity epilepsy groups (when α =0.05; Figure 3E). Model values are in Table 2.
Table 2.
| Female HC at 1 year (cm) with 95% CI | Male HC at 1 year (cm) with 95% CI | Female & Male HC growth (cm / log years) with 95% CI | |
|---|---|---|---|
| No epilepsy | 46.04 (45.31, 46.78) | 46.52 (45.94, 47.11) | 3.93 (3.71, 4.14) |
| Low | 45.71 (44.97, 46.45) | 47.09 (46.27, 47.9) | 4.13 (3.84, 4.43) |
| Moderate | 45.79 (45.19, 46.39) | 48.04 (47.45, 48.62) | 3.99 (3.79, 4.19) |
| High | 46.16 (45.67, 46.65) | 47.11 (46.52, 47.7) | 3.5 (3.32, 3.68) |
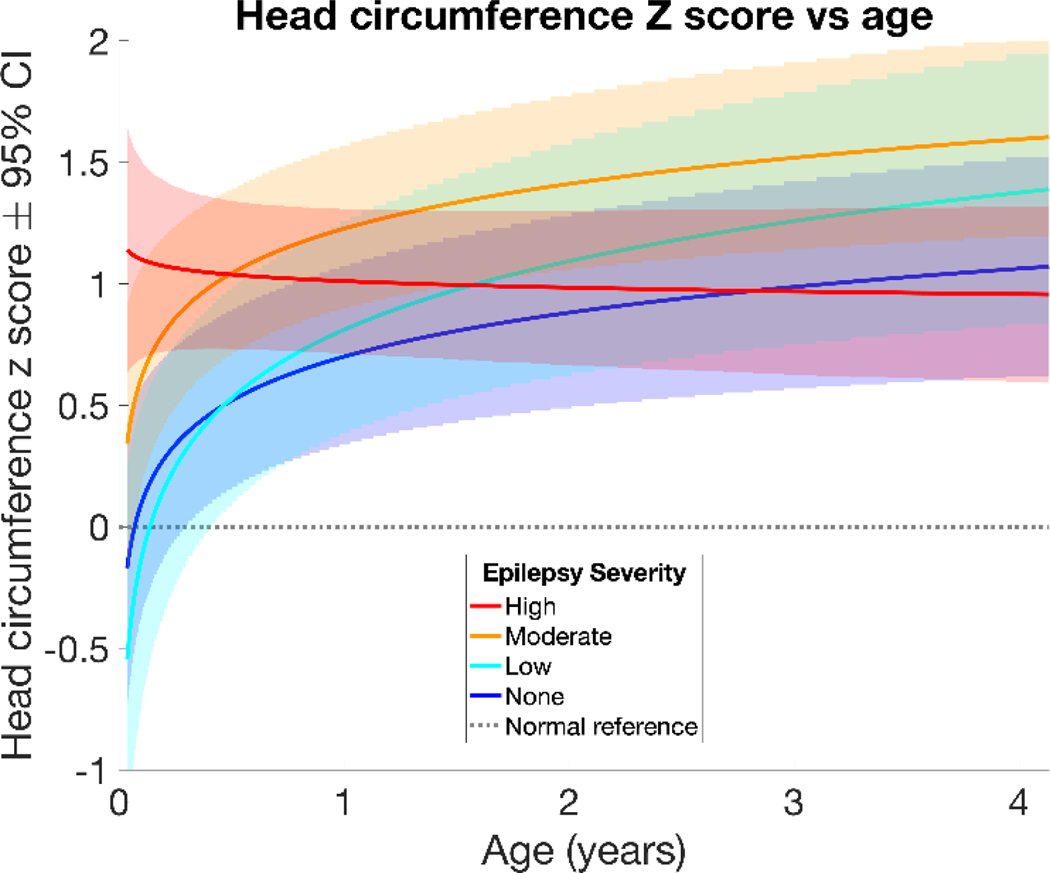
To analyze males and females together, HCs were converted to z-scores based on the WHO reference values. The mean HC for a specific age and sex has a z-score of zero with a standard deviation of 1, and z-scores remain constant over time if HC growth follows a typical growth trajectory. Results of the linear mixed effects models of HC z-scores by age and number of seizure types are listed in Table 3 and displayed in Figure 4. Children with TSC and no epilepsy had an estimated HC z-score of 0.70 at one year of age (95% confidence interval or CI 0.33 – 1.07, p<.001) and an estimated z-score increase of 0.26 per log year (95% CI 0.11 – 0.42, p<.001). Children with TSC and low epilepsy severity had an estimated HC z-score of 0.81 at one year of age (95% CI 0.38 – 1.25, p<.001) and an increase in z-score of 0.41 per log year (95% CI 0.2 – 0.62, p<.001). Children with TSC and moderate epilepsy severity had an estimated HC z-score of 1.23 at one year of age (95% CI 0.89 – 1.56, p<.001) and an increase in z-score of 0.27 per log year (95% CI 0.12 – 0.41, p<.001). Children with TSC and high epilepsy severity had an estimated HC z-score of 1.01 at one year of age (95% CI 0.71 – 1.31, p<.001) and no significant change in z-score over time. The high epilepsy severity group, while initially having larger HC z-scores than the no epilepsy and low epilepsy severity groups, was the only group to have a growth rate that was not significantly different from typical growth (zero). The no epilepsy and high epilepsy severity groups converged to similar z-scores about 1 standard deviation above the normal reference by 2–3 years of age, however the low and moderate severity epilepsy groups remained slightly higher (Figure 4). Findings were similar when HC Z-score was corrected by length/height, and length/height Z-scores were not significantly different from the normal population.
Table 3.
| Estimated z-score at 1 year with 95% CI | p-value | Estimated slope (z-score change per log year) with 95% CI | p-value | |
|---|---|---|---|---|
| No epilepsy | 0.70 (0.33, 1.07) | <.001 *** | 0.26 (0.11, 0.42) | <.001 *** |
| Low | 0.81 (0.38, 1.25) | <.001 *** | 0.41 (0.2, 0.62) | <.001 *** |
| Moderate | 1.23 (0.89, 1.56) | <.001 *** | 0.27 (0.12, 0.41) | <.001 *** |
| High | 1.01 (0.71, 1.31) | <.001 *** | −0.04 (−0.17, 0.09) | 0.56 |
p<.001
Figure 4:
Linear mixed effects model of HC z-score versus age shows relationships between epilepsy severity groups and HC z-score and growth. Those with TSC and high epilepsy severity had larger HCs early in life but did not have a significant increase in z-score with age. Those with TSC and moderate epilepsy severity also had larger HCs than the low severity and no epilepsy groups at 1 year of age. The no epilepsy, low, and moderate epilepsy severity groups experienced a higher rate of growth (increasing z-score) when compared to the normal reference population.
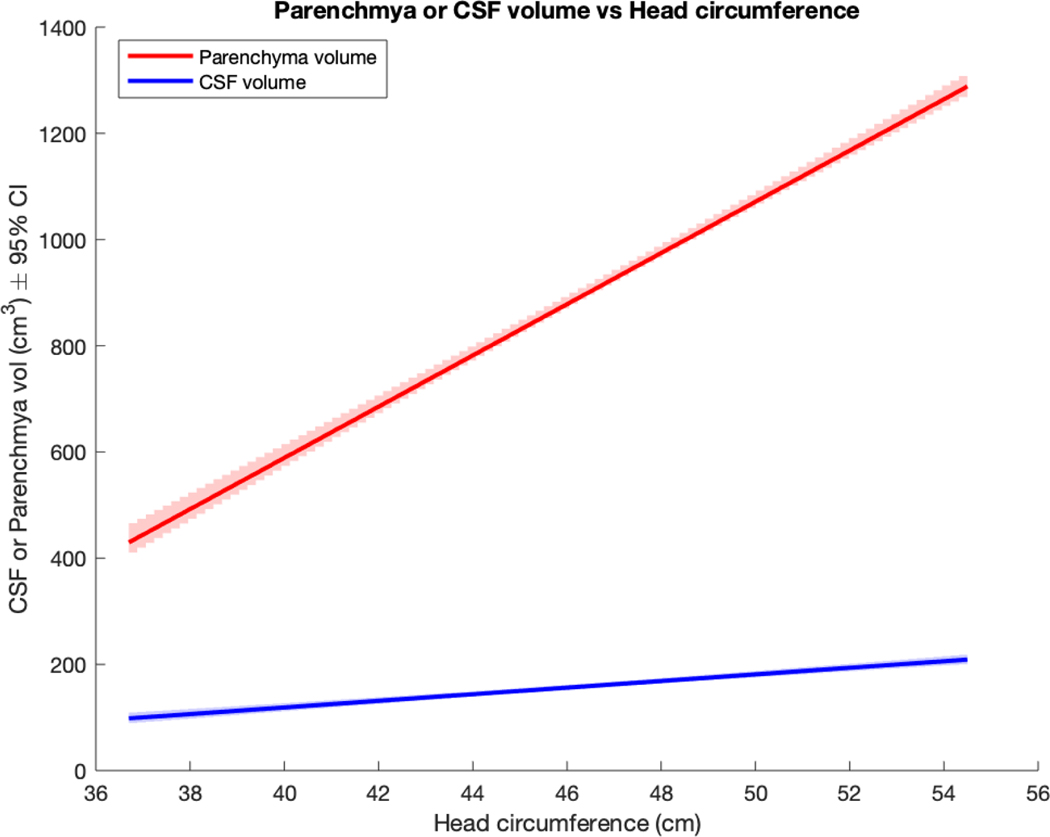
HC was significantly associated with brain parenchyma volume and CSF volume. Each centimeter increase in HC was associated with a 48 cm3 increase in parenchyma volume and a 6 cm3 increase in CSF volume (Figure 5).
Figure 5:
Brain parenchymal or CSF volume as predicted by HC (univariate models)
Discussion
In this study, we demonstrate that children with TSC show an accelerated HC growth rate and have an HC about 1 standard deviation above population norms by one year. Children with TSC did not have length/height measurements and growth rates that differed from the normal population, indicating that overgrowth was confined to the head. It is not yet known whether these differences in HC in TSC persist into adolescence and adulthood. TSC is a disorder of cellular overgrowth and abnormal brain development, which may contribute to increased brain volume and subsequent larger HC. Larger brain sizes are also present in rodent models of TSC (Meikle L, 2008) and other mTOR related disorders such as PTEN Hamartoma Tumor Syndrome (Tan MH, 2011). Possible mechanisms include increased cellular size, increased cell numbers, increased number or volume of tubers, abnormal white matter development, or a combination (Goto J, 2011) (Rensing N, 2015).
Infants with TSC and no epilepsy, low, or moderate epilepsy severity showed a similar pattern of more rapid early HC growth than WHO norms leading to larger HC than normal by 1 year of age. In contrast, infants with high epilepsy severity had larger HC than normal from an early age that remained large over time but did not show a more rapid rate of growth than WHO norms (Figure 4, Table 3). Similar results were obtained when the groups were categorized instead by epileptic spasms or focal seizures, indicating that the specific type of seizure was less important than the severity of epilepsy (see supplemental data). This raises questions about the relationship between early brain overgrowth and epilepsy in TSC. It is possible that severe epilepsy is associated with early brain overgrowth in the fetal or early infantile period. This may be due to increased cellular growth, aberrant neuronal migration, or a higher tuber burden (Tsai V, 2014). All groups showed larger HCs than the general population, which may be due to the cumulative effects of microstructural abnormalities seen in TSC (Marcotte L, 2012) (Ruppe V, 2014). The severe epilepsy group did not have the higher growth rate seen in the other TSC groups, which may be an effect of greater seizure burden or increased AED use.
While both males and females with TSC showed larger HC than WHO norms, they had different patterns of HC growth when divided into groups with differing numbers of seizures. Females showed similar HC measurements across all seizure groups (Figures 3A and 3C), while males showed larger HC in infants with epilepsy than in those without (Figures 3B and 3D). There was no significant difference in HC growth rate between males and females. When male and female HC z-scores were analyzed separately, there was more variability between the sexes in the no epilepsy and moderate epilepsy groups (see supplemental data). This may be related to heterogeneity among individuals and fewer subjects in these groups compared to the high severity epilepsy group (Table 1). Further investigation into how sex affects brain growth and epilepsy in TSC is needed.
Because data were collected longitudinally across multiple sites, HC measurements were subject to inter-observer differences and confounders including measurement error and amount of hair and other scalp tissues. Additionally, there may be a recruitment bias: TSC is a highly variable condition, and this study may have a paucity of patients with a milder neurological phenotype of TSC who present later in life. There are ongoing studies of TSC manifestations in older individuals that may demonstrate if head circumference and brain volume differences persist into adolescence and adulthood, and if they continue to be affected by epilepsy severity. While there is a strong correlation between HC and brain parenchymal volume, future studies will investigate the volumes of tubers, brain tissue subtypes and regions and their relationship to epilepsy and other neurologic manifestations of TSC.
Conclusions
Children with TSC have larger head circumferences than typical growth norms and have differing rates of head growth depending on the presence and severity of epilepsy. Head circumference in infants with TSC should be monitored closely, and larger head circumference may be associated with an increased risk of more severe epilepsy. Infants with TSC and larger head circumferences may be candidates for preventive epilepsy treatments.
Supplementary Material
Table 4.
| Estimate (95% CI) | P | |
|---|---|---|
| Parenchyma | 48.25 (45.82, 50.67) | <.001 |
| CSF | 6.22 (5.31, 7.14) | <.001 |
Acknowledgments:
Elaina Little for data collection and cleaning, Kush Kapur for statistical analysis, and Xavier Tomas-Fernandez for providing MRI volumetric data. We are sincerely indebted to the generosity of the families and patients in TSC clinics across the United States who contributed their time and effort to this study. We would also like to thank the TSC Alliance for their continued support in TSC research.
Conflicts of interest:
Dr. Jamie Capal consults and receives travel funding from Roche.
Funding:
Research reported in this publication was supported by the National Institute of Neurological Disorders and Stroke of the National Institutes of Health (NINDS) and Eunice Kennedy Shriver National Institute of Child Health & Human Development (NICHD) under Award Numbers U01-NS082320, P20-NS0801999, and U54-NS092090. The content is solely the responsibility of the authors and does not necessarily represent the official views of the National Institutes of Health.
Footnotes
Declaration of interests
The authors declare that they have no known competing financial interests or personal relationships that could have appeared to influence the work reported in this paper.
Publisher's Disclaimer: This is a PDF file of an unedited manuscript that has been accepted for publication. As a service to our customers we are providing this early version of the manuscript. The manuscript will undergo copyediting, typesetting, and review of the resulting proof before it is published in its final form. Please note that during the production process errors may be discovered which could affect the content, and all legal disclaimers that apply to the journal pertain.
References:
- Bartholomeusz HH CE (2002). Relationship between head circumference and brain volume in healthy normal toddlers, children, and adults. Neuropediatrics, 239–241. doi: 10.1055/s-2002-36735 [DOI] [PubMed] [Google Scholar]
- Capal JK B-CB (2017). Influence of seizures on early development in tuberous sclerosis complex. Epilepsy Behavior, 245–252. doi: 10.1016/j.yebeh.2017.02.007 [DOI] [PMC free article] [PubMed] [Google Scholar]
- Chu-Shore CJ (2010). The natural history of epilepsy in tuberous sclerosis complex. Epilepsia, 1236–1241. doi: 10.1111/j.1528-1167.2009.02474.x [DOI] [PMC free article] [PubMed] [Google Scholar]
- Cohen AL MB (2021). Tuber Locations Associated with Infantile Spasms Map to a Common Brain Network. Ann Neurol, 726–739. doi: 10.1002/ana.26015 [DOI] [PMC free article] [PubMed] [Google Scholar]
- Crino PM (2010). Pathogenesis of TSC in the Brain. In Kwiatkowski DJ, Tuberous sclerosis complex: Genes, clinical features, and therapeutics. (pp. 176–179). Weinheim, Germany: Wiley- Blackwell. [Google Scholar]
- Davis PE-D (2017). Presentation and Diagnosis of Tuberous Sclerosis Complex in Infants. Pediatrics, e20164040. doi: 10.1542/peds.2016-4040 [DOI] [PMC free article] [PubMed] [Google Scholar]
- Davis PP (2015). Tuberous Sclerosis: A New Frontier in Targeted Treatment of Autism. Neurotherapeutics, 572–583. doi: 10.1007/s13311-015-0359-5 [DOI] [PMC free article] [PubMed] [Google Scholar]
- Diggle P DP (2002). Analysis of longitudinal data. Oxford university press, All. [Google Scholar]
- Doherty C GS (2005). Prognostic Significance of Tuber Count and Location in Tuberous Sclerosis Complex. Journal of Child Neurology, 837–841. doi: 10.1177/08830738050200101301 [DOI] [PubMed] [Google Scholar]
- Fidler DJ BJ (2000). Macrocephaly in autism and other pervasive developmental disorders. Developmental Medicine & Child Neurology, 737–40. doi: 10.1017/s0012162200001365 [DOI] [PubMed] [Google Scholar]
- Goto J TD. (2011). Regulable neural progenitor-specific Tsc1 loss yields giant cells with organellar dysfunction in a model of tuberous sclerosis complex. Proceedings of the National Academy of Sciences of the United States of America, E1070–1079. doi: 10.1073/pnas.1106454108 [DOI] [PMC free article] [PubMed] [Google Scholar]
- Humphrey AP (2008). The Early Childhood Epilepsy Severity Scale (E-Chess). Epilepsy Research, 139–45. doi: 10.1016/j.eplepsyres.2008.01.007 [DOI] [PubMed] [Google Scholar]
- Kotulska K KD-W-P (2021). Prevention of Epilepsy in Infants with Tuberous Sclerosis Complex in the EPISTOP Trial. Ann Neurol, 304–314. doi: 10.1002/ana.25956 [DOI] [PMC free article] [PubMed] [Google Scholar]
- Lainhart JE-F (2006). Head circumference and height in autism: a study by the collaborative program of excellence in autism. American journal of medical genetics, 2257–2274. doi: 10.1002/ajmg.a.31465 [DOI] [PMC free article] [PubMed] [Google Scholar]
- Marcotte L AE (2012). Cytoarchitectural alterations are widespread in cerebral cortex in tuberous sclerosis complex. Acta Neuropathol. [DOI] [PubMed] [Google Scholar]
- Meikle L PK (2008). Response of a neuronal model of tuberous sclerosis to mammalian target of rapamycin (mTOR) inhibitors: effects on mTORC1 and Akt signaling lead to improved survival and function. Journal of Neuroscience, 5422–5432. doi: 10.1523/JNEUROSCI.0955-08.2008 [DOI] [PMC free article] [PubMed] [Google Scholar]
- Ohtsuka Y OI (1998). Long- Term Follow- Up of Childhood Epilepsy Associated with Tuberous Sclerosis. Epilepsia, 1158–1163. doi: 10.1111/j.1528-1157.1998.tb01306.x [DOI] [PubMed] [Google Scholar]
- Portocarrero LKL QK-M (2018). Tuberous sclerosis complex: review based on new diagnostic criteria. An Brasileiros De Dermatologia, 323–331. doi: 10.1590/abd1806-4841.20186972 [DOI] [PMC free article] [PubMed] [Google Scholar]
- Rensing N HL (2015). Intermittent dosing of rapamycin maintains antiepileptogenic effects in a mouse model of tuberous sclerosis complex. Epilepsia, 1088–1097. doi: 10.1111/epi.13031 [DOI] [PMC free article] [PubMed] [Google Scholar]
- Ruppe V DP (2014). Developmental brain abnormalities in tuberous sclerosis complex: A comparative tissue analysis of cortical tubers and perituberal cortex. Epilepsia. [DOI] [PubMed] [Google Scholar]
- Shields D. (2018). Infantile spasms. Retrieved from Child neurology foundation. [Google Scholar]
- Tan MH MJ (2011). A clinical scoring system for selection of patients for PTEN mutation testing is proposed on the basis of a prospective study of 3042 probands. American Journal of Human Genetics, 42–56. doi: 10.1016/j.ajhg.2010.11.013 [DOI] [PMC free article] [PubMed] [Google Scholar]
- Tomas-Fernandez X. &. (2015). A Model of Population and Subject (MOPS) Intensities with Application to Multiple Sclerosis Lesion Segmentation. IEEE Transactions on Medical Imaging, 1349–1361. doi: 10.1109/TMI.2015.2393853 [DOI] [PMC free article] [PubMed] [Google Scholar]
- Tsai V PW (2014). Fetal Brain mTOR Signaling Activation in Tuberous Sclerosis Complex. Cereb Cortex. [DOI] [PMC free article] [PubMed] [Google Scholar]
- Vignoli AB (2015). Autism spectrum disorder in tuberous sclerosis complex: Searching for risk markers. Orphanet Journal of Rare Diseases, 10:154. doi: 10.1186/s13023-015-0371-1 [DOI] [PMC free article] [PubMed] [Google Scholar]
- Wataya-Kaneda M TM (2013). Trends in the Prevalence of Tuberous Sclerosis Complex Manifestations: An Epidemiological Study of 166 Japanese Patients. Plos One, 8(5):e63910. doi: 10.1371/journal.pone.0063910 [DOI] [PMC free article] [PubMed] [Google Scholar]
- Webb DW FA. (1996). Morbidity associated with tuberous sclerosis: a population study. Developmental medicine and child neurology, 146–155. doi: 10.1111/j.14698749.1996.tb12086.x [DOI] [PubMed] [Google Scholar]
- World Health Organization. (2014, January 15). Child growth standards: methods and development. Retrieved from World Health Organization. [Google Scholar]
Associated Data
This section collects any data citations, data availability statements, or supplementary materials included in this article.


