

Abstract
Background:
Ancillary analyses from clinical trials have suggested reduced efficacy for neurohormonal antagonists among patients with heart failure and preserved ejection fraction (HFpEF) and higher range EF.
Methods:
621 patients with HFpEF were grouped into those with low-normal LVEF (HFpEF<65%, n=319, 50%≤LVEF<65%) or HFpEF≥65% (n=302, LVEF≥65%), and compared with 149 age-matched controls undergoing comprehensive echocardiography and invasive cardiopulmonary exercise testing. A sensitivity analysis was performed in a second noninvasive community-based cohort of patients with HFpEF (n=244) and healthy controls without cardiovascular disease (n=617).
Results:
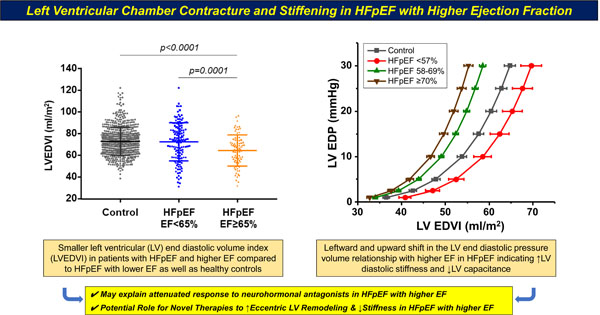
Patients with HFpEF≥65% had smaller LV end diastolic volume (LVEDV) than HFpEF<65%, but LV systolic function assessed by preload recruitable stroke work and stroke work/EDV was similarly impaired. Patients with HFpEF≥65% displayed an end diastolic pressure volume relationship (EDPVR) that was shifted leftward, with increased LV diastolic stiffness constant β in both invasive and community-based cohorts. Cardiac filling pressures and pulmonary artery pressures at rest and during exercise were similarly abnormal in all EF subgroups. While patients HFpEF≥57% displayed leftward shifted EDPVR, those with HFpEF<57% had a rightward shifted EDPVR more typical of HFrEF.
Conclusion:
Most pathophysiologic differences in patients with HFpEF and higher EF are related to smaller heart size, increased LV diastolic stiffness, and leftward shift in the EDPVR. These findings may help to explain the absence of efficacy for neurohormonal antagonists in this group and raise a new hypothesis, that interventions to stimulate eccentric LV remodeling and enhance diastolic capacitance may be beneficial for patients with HFpEF and EF in the higher range.
Keywords: heart failure, heart failure with preserved ejection fraction, ventricular function, cardiac remodeling, hemodynamics
GRAPHICAL ABSTRACT
Introduction
Heart failure (HF) with preserved ejection fraction (EF, HFpEF) affects over half of all patients with HF but there are few effective treatments.1, 2 Secondary analyses from clinical trials have shown that within the broader spectrum of HFpEF, patients with EF falling in the lower range appear to respond more favorably to neurohormonal antagonists compared to those with EF falling within the higher range.3–7 This has led to questions about where the border between HFpEF and HF with reduced EF should be drawn.8, 9 A recent study observed that patients with HFpEF and EF>60% had smaller hearts, increased left ventricular (LV) chamber stiffness during systole and diastole, and differential responses to acute load alterations compared to those with EF 50–59%.10 The latter study utilized robust LV pressure-volume relationships, but was small, highly selected, and importantly lacked a control group free of HF, and there was no assessments of aerobic capacity or cardiac reserve during dynamic exercise.
To address these knowledge gaps, we performed a detailed, multimodality comparison of cardiovascular structure and function, hemodynamics, and aerobic capacity in patients with HFpEF separated into those with EF falling into the higher and lower normal ranges, along with HF-free controls included to provide additional context. We hypothesized that patients with HFpEF and higher EF would display smaller LV chamber volumes resulting in an effective increase in diastolic chamber stiffness as compared to HFpEF<65%, and that this may explain many of the pathophysiologic features in this cohort.
Methods
Study Population
The data, analytic methods, and study materials will be made available to other researchers based upon reasonable request for purposes of reproducing the results. This is a retrospective analysis of consecutive patients referred for assessment at the Mayo Clinic for the evaluation of exertional dyspnea. HFpEF was defined by the presence of clinical HF (dyspnea and fatigue), LVEF ≥50% with elevated LV filling pressures [pulmonary capillary wedge pressure (PCWP) ≥15 mmHg at rest or ≥25 mmHg with exercise). Patients with HFpEF were divided in two groups according to LVEF for the primary analysis: 1) HFpEF<65% (50%≤EF<65%) or 2) HFpEF≥65%. A convenience sample of consecutively evaluated patients without HF (normal rest/exercise PCWP) with dyspnea related to deconditioning or psychogenic causes were used as controls. Patients with unstable coronary artery disease, significant valvular heart disease (greater than moderate mitral regurgitation, greater than mild stenosis), non-Group 2 pulmonary hypertension, constrictive pericarditis, and hypertrophic or amyloid cardiomyopathy were excluded. The Mayo Clinic Institutional Review Board approved this study, and informed consent was provided by all subjects to use their data for research purposes.
To complement the main analysis from the invasive cohort and include a healthier control group without cardiovascular disease, we also analyzed a separate cohort of patients with and without HFpEF from a community-based sample, in which most of patients with HFpEF had been previously hospitalized, while controls were healthy volunteers recruited by random sampling from the community who also underwent echocardiographic evaluation but no invasive assessment. Some data from this cohort has been published previously11, 12 but not examining the impact of different EF cohorts. This cohort underwent additional evaluation of LV systolic properties, including end systolic elastance (Ees) using the single-beat technique, and determination of stress-corrected midwall fractional shortening (sc-MFS), an independent measure of LV myocardial contractility, as previously described.11, 12
Assessment of Cardiac Structure, Function and Hemodynamics
Right heart catheterization was carried out using high fidelity micromanometer catheters at rest and during supine exercise to the point of volitional exhaustion as previously described.13 Full details are provided in the Supplementary Material.
Comprehensive 2-D, M-mode, Doppler and tissue Doppler echocardiography was performed according to the current guidelines.14 Left atrial volume was indexed to height as recently recommended.15 Left ventricular volumes at end systole and end diastolic (LVEDV) and LVEF were determined using Simpson’s method, and were also indexed to body surface area. In the community-based cohort LVEDV was assessed using the Doppler method assuming absent mitral regurgitation, as previously described.11, 12 Myocardial deformation analyses were performed offline from 2D images, using commercially available software (Image Arena, TomTec Imaging Systems, Unterschleissheim, Germany). LV global longitudinal strain (GLS), global longitudinal peak systolic strain rate and global longitudinal early diastolic strain rate were measured using 2D speckle tracking, determined as the average of the two apical views (4- and 2-chamber views).16
Because measures of strain and myocardial velocities vary with heart size, geometry, and loading conditions, LV contractility was assessed separately using load-independent measures that also account for afterload and preload, including preload recruitable stroke work (PRSW) and LV stroke work (LVSW). PRSW was determined according to single beat method validated by Lee and colleagues: PRSW = SBMw*(LVEDV–Vw), where SBMw presents slope of the single beat preload recruitable stroke work relationship [SBMw=SW/(LVEDV – k*LVEDV + (1-k) * LVM/1.05)], with k defined by the ratio of epicardial shell volumes corresponding to the volume-axis intercept and baseline LVEDV, calculated as k=[0.0004*LVM]+0.6408, with Vw presenting volume within the epicardial shell [Vw=k*(LVEDV+LVM/1.05)–LVM/1.05].12, 17 LVSW was calculated as [(mean arterial pressure – PCWP)*SV*0.0136]18 and then divided by LVEDV to minimize preload sensitivity.19
Total blood volume (TBV) and plasma volume (PV) were estimated using validated formulas as PV = (1−hematocrit) × (a+[b×weight in kg]), where a=1530 for men and 864 for women, and b=41 for men and 47.9 for women.20 TBV was then calculated as =PV/(1-hematocrit). The probability of underlying undiagnosed cardiac amyloid in patients was assessed using the ATTR-CM score (range −1 to 10), where higher scores indicate greater likelihood of amyloid, and scores ≥6 are considered high risk and warrant further testing.21
End-diastolic pressure/volume relationship
The LV end-diastolic pressure/volume relationship (EDPVR) is described by the following equation: P = αVβ. The values of α and β were calculated according to the single-beat approach developed and validated by Klotz et al, where β reflects LV diastolic stiffness.22 This method allows estimation of the entire EDPVR from a single set of pressure–volume coordinates based on the premise that volume-normalized EDPVRs share a common shape. Because α and β are covariant and derived from a highly nonlinear equation, group differences in the EDPVR were compared using the LVEDV at a common LVEDP of 15 mmHg and 30 mmHg (V15 and V30, respectively).22
Statistical Analysis
Data are presented as median (interquartile range) or mean (standard deviation). Categorical data are expressed as numbers and percentages. The Chi-square test assessed differences in categorical data. Analysis of variance (one way ANOVA, ANCOVA and Kruskal Wallis) was used to assess differences in key variables between study groups, with post hoc comparisons performed using Bonferroni’s method. Linear regression was used to adjust for baseline group differences (sex and BMI) that may influence cardiac structure and function, except for cardiac structural measures that were separately indexed for body size (BSA-normalized LVEDV, V15 and V30, and height-normalized LV mass and LA volume), which were only adjusted for sex in linear regression analyses to avoid overadjustment. SPSS 28.0 (IBM, Armonk, New York) was used for all analyses. All tests with a 2-sided p-value <0.05 were considered statistically significant.
RESULTS
Of 621 patients with HFpEF, 319 (51%) had 50%≤EF<65% (HFpEF<65%), and 302 (49%) had EF≥65% (HFpEF≥65%). Compared with age-matched controls (n=149), both HFpEF groups had higher BMI and NTproBNP levels, poorer kidney function, lower hemoglobin, and were more likely to have hypertension and atrial fibrillation (Table 1). Patients with HFpEF≥65% were more likely to be women and hypertensive as compared to HFpEF<65%, but less likely to have atrial fibrillation. There were no differences in the prevalence of obesity, diabetes, or coronary disease, and no differences in renal function, hemoglobin, or NT-proBNP levels. ATTR-CM score was lower in patients with HFpEF≥65%, suggesting lower probability of undiagnosed cardiac amyloid, though the prevalence of high risk scores was low in all groups. Estimated blood and plasma volumes were higher in both HFpEF groups compared with controls, but there were no differences between HFpEF≥65% and HFpEF<65%. (Table 1)
Table 1:
Baseline Characteristics
| Controls (n=149) |
HFpEF<65% (n=319) |
HFpEF≥65% (n=302) |
P value | |
|---|---|---|---|---|
| Age, y | 67 ± 8 | 68 ± 11 | 68 ± 11 | 0.372 |
| Women, n (%) | 75 (50) | 153 (48) | 196 (65)1, 2 | <0.001 |
| BMI, kg/m2 | 29.4 ± 5.8 | 33.2 ± 7.41 | 34.0 ± 7.61 | <0.001 |
| Estimated plasma volume, l | 2.9 ± 0.6 | 3.3 ± 0.71 | 3.4 ± 0.71 | 0.001 |
| Estimated blood volume, l | 4.9 ± 1.0 | 5.5 ± 1.11 | 5.4 ± 1.01 | 0.003 |
| Comorbidities | ||||
| Diabetes, n (%) | 29 (20) | 78 (24) | 82 (27) | 0.203 |
| Hypertension, n (%) | 115 (77) | 259 (81) | 280 (93)1, 2 | <0.001 |
| Coronary disease, n (%) | 52 (35) | 107 (34) | 86 (28) | 0.267 |
| Atrial fibrillation, n (%) | 8 (5) | 132 (41)1 | 94 (31)1, 2 | <0.001 |
| Medications | ||||
| Beta blockers, n (%) | 53 (36) | 174 (54)1 | 150 (50)1 | 0.004 |
| ACE-inhibitor or ARB, n (%) | 51 (34) | 142 (44)1 | 153 (51)1 | 0.004 |
| CCB, n (%) | 27 (18) | 58 (18) | 57 (19) | 0.980 |
| Diuretic, n (%) | 42 (28) | 182 (57)1 | 169 (56)1 | <0.001 |
| Laboratories | ||||
| NT-proBNP, pg/ml | 80 (40,193) | 257 (106, 987)1 | 272 (74, 763)1 | <0.001 |
| eGFR, ml/min/1.73 m2 | 68 ± 16 | 64 ± 191 | 63 ± 191 | 0.019 |
| Hemoglobin, g/dL | 13.0 ± 1.4 | 12.5 ± 1.51 | 12.3 ± 1.51 | <0.001 |
| ATTR-CM score ≥ 6, n (%) | 6 (4) | 22 (7) | 4 (1) | 0.129 |
| ATTR-CM score | 3 (1,4) | 3 (2,5)1 | 2 (1,4)2 | <0.001 |
ACE = angiotensin converting enzyme, ARB = angiotensin II receptor blocker, ATTR-CM = transthyretin amyloid cardiomyopathy, where higher scores indicate greater probability of undiagnosed cardiac amyloid, and scores ≥6 are considered “high risk” patients that warrant additional testing; BMI = body mass index, CCB = calcium channel blocker, eGFR = glomerular filtration rate, NT-pro-BNP = N-terminal pro-B type natriuretic peptide. Values are expressed as mean ± SD, median (IQR) or numbers (%). Final column shows the p value by analysis of variance for any difference between groups. Significant individual group differences (corrected for multiple hypothesis testing) are then shown by superscripts
(p<0.05 vs. Controls)
(p<0.05 vs. HFpEF<65%).
Cardiac Structure
LV diastolic dimension and LVEDV were smaller in HFpEF≥65% than HFpEF<65%, but LV volumes did not significantly differ between HFpEF≥65% and controls (Table 2). LV mass indexed for height was greater in both HFpEF groups than in controls but did not differ between HFpEF≥65% and HFpEF<65%. Left atrial (LA) volume was greater in both HFpEF groups than controls, but LA volume was lower in HFpEF≥65% compared with HFpEF<65% (Table 2). Each of these differences remained significant after adjusting for sex.
Table 2:
Cardiac Structure and Function
| Controls (n=149) |
HFpEF<65% (n=319) |
HFpEF≥65% (n=302) |
P valuea | |
|---|---|---|---|---|
| LV end diastolic diameter, mm | 48 ± 5 | 50 ± 5 | 48 ± 52 | 0.003 |
| LV end diastolic volume, ml | 107 ± 29 | 118 ± 321 | 109 ± 262 | 0.003 |
| LV end-diastolic volume index, ml/m2 | 54 ± 12 | 57 ± 13 | 53 ± 112 | 0.001 |
| LV mass, g | 174 ± 53 | 204 ± 611 | 186 ± 522 | <0.001 |
| LV mass index, g/m2 .7 | 41 ± 11 | 48 ± 131 | 46 ± 131 | 0.002 |
| Relative wall thickness | 0.41 ± 0.07 | 0.42 ± 0.07 | 0.42 ± 0.07 | 0.148 |
| LA volume, ml | 56 ± 14 | 82± 381 | 72± 261, 2 | <0.001 |
| LA volume index, ml/m2.7 | 13 ± 3 | 19 ± 91 | 18 ± 71,2 | <0.001 |
| TR velocity, m/s | 2.5 ± 0.3 | 2.7 ± 0.51 | 2.7 ± 0.51 | <0.001 |
| LV GLS, % | 15.9 ± 2.2 | 14.0 ± 3.31 | 15.6 ± 2.92 | <0.001 |
| LV systolic strain rate, s−1 | 0.66 ± 0.10 | 0.57 ± 0.151 | 0.66 ± 0.132 | <0.001 |
| LV diastolic strain rate, s−1 | 0.53 ± 0.14 | 0.49 ± 0.15 | 0.55 ± 0.152 | <0.001 |
| LV s’, cm/s | 8.2 ± 1.5 | 6.9 ± 1.61 | 7.3 ± 1.41 | <0.001 |
| LV E/e’ | 8.4 ± 3.1 | 12.8 ± 6.31 | 12.7 ± 4.21 | <0.001 |
| RV s’, cm/s | 11.8 ± 3.2 | 10.0 ± 3.21 | 10.6 ± 2.21 | 0.002 |
| TAPSE, mm | 21 ± 5 | 17 ± 51 | 19 ± 5 | 0.005 |
LA=left atrial; LV=left ventricle; LVGLS=left ventricular global longitudinal strain; s’=annular systolic velocity; RV=right ventricle; TAPSE=tricuspid annular plain systolic excursion; TR=tricuspid regurgitation.
Values are expressed as mean ± SD, median (IQR) or numbers (%). Final column shows the p value by analysis of variance for any difference between groups.
Significant individual group differences (corrected for multiple hypothesis testing) are then shown by superscripts 1 (p<0.05 vs. Controls)
(p<0.05 vs. HFpEF<65%).
Adjusted for sex and BMI, except for LV end diastolic volume index, LV mass index, and LA volume index, which are only adjusted for sex
Cardiac Function and Functional Reserve
LV function assessed by global longitudinal strain, systolic strain rate, and diastolic strain rate was reduced in HFpEF<65% as compared to both HFpEF≥65% and controls (Table 2). None of the strain-based measures were significantly different between HFpEF≥65% and controls. Tissue Doppler LV systolic tissue velocity was lower in both HFpEF groups compared with controls, while E/e’ ratio was higher in the HFpEF groups compared with controls, with no between-group difference in either tissue-Doppler based measure of LV function between HFpEF≥65% and HFpEF<65%.
As compared to controls, both HFpEF≥65% and HFpEF<65% displayed chamber-level LV systolic dysfunction, with lower preload recruitable stroke work and stroke work/EDV, but there were no differences between HFpEF≥65% and HFpEF<65% in systolic performance (Table 3), despite poorer systolic function in HFpEF<65% when assessed by speckle-tracking strain and EF (Table 2).
Table 3:
Resting Hemodynamics
| Controls (n=149) |
HFpEF<65% (n=319) |
HFpEF≥65% (n=302) |
P valuea | |
|---|---|---|---|---|
| Heart rate, beats/min | 70 ± 11 | 70 ± 12 | 70 ± 13 | 0.799 |
| Mean arterial pressure, mmHg | 96 ± 13 | 99 ± 14 | 99 ± 15 | 0.474 |
| Cardiac output, l/min | 5.4 ± 1.5 | 5.3 ± 1.61 | 5.3 ± 1.61 | 0.010 |
| AVO2 diff, ml/dl | 4.3 ± 0.8 | 4.7 ± 1.01 | 4.5 ± 1.02 | 0.001 |
| Central pressures | ||||
| RA pressure, mmHg | 5 ± 3 | 11 ± 51 | 10 ± 51,2 | <0.001 |
| PA systolic pressure, mm Hg | 28 ± 6 | 42 ± 141 | 41 ± 141 | <0.001 |
| PA mean pressure, mmHg | 17 ± 4 | 28 ± 91 | 27 ± 91 | <0.001 |
| PCWP, mmHg | 9 ± 3 | 17 ± 51 | 17 ± 61 | <0.001 |
| Vascular function | ||||
| PVR, dyn·s·cm−5 | 125 ± 57 | 183 ± 1281 | 171 ± 1241 | <0.001 |
| PA compliance, ml/mmHg | 4.5 ± 1.7 | 3.7 ± 1.81 | 3.7 ± 1.81 | <0.001 |
| SVR, dyn·s·cm−5 | 1446 ± 430 | 1452 ± 460 | 1460 ± 502 | 0.271 |
| TAC, ml/mm Hg | 1.2 ± 0.5 | 1.1 ± 0.51 | 1.1 ± 0.51 | 0.001 |
| Ea, mm Hg/ml | 1.8 (1.6, 2.3) | 2.0 (1.6, 2.4)1 | 2.0 (1.5, 2.6)1 | 0.001 |
| LV EDPVR | ||||
| V15, ml | 110 (96, 131) | 113 (94, 134) | 102 (90, 121)1,2 | 0.001 |
| V15/BSA, ml/m2 | 57 (49, 65) | 53 (46, 62)1 | 50 (44, 57)1,2 | <0.001 |
| V30, ml | 124 (108, 146) | 128 (106, 150) | 115 (101, 136)1,2 | 0.001 |
| V30/BSA, ml/m2 | 64 (55, 73) | 60 (52, 69)1 | 56 (49, 64)1,2 | <0.001 |
| LV stiffness β | 5.90 (5.86, 5.95) | 6.08 (5.93, 6.52)1 | 6.15 (5.95, 6.52)1,2 | <0.001 |
| LV systolic function | ||||
| PRSW, mmHg | 94 (77, 117) | 89 (65, 115)1 | 89 (69, 114)1 | <0.001 |
| LVSW/EDV (g/ml) | 0.85 (0.69, 1.07) | 0.70 (0.54, 0.95)1 | 0.70 (0.59, 0.99)1 | <0.001 |
AVO2 diff = arterial-venous oxygen content difference; BSA=body surface area; Ea=systemic effective arterial elastance; EDV=LV end diastolic volume; LVSW=left ventricular stroke work; PA=pulmonary artery; PCWP=pulmonary capillary wedge pressure; PRSW=pre-load recruitable stroke work; PVR=pulmonary vascular resistance; RA=right atrial; SVR=systemic vascular resistance; TAC=total arterial compliance; V15=LVEDV at a common LV end-diastolic pressure of 15 mmHg; V30=LVEDV at a common LV end-diastolic pressure of 30 mmHg. Values are expressed as mean ± SD or median (IQR). Final column shows the p value by analysis of variance for any difference between groups.
Significant individual group differences (corrected for multiple hypothesis testing) are then shown by superscripts 1 (p<0.05 vs. Controls)
(p<0.05 vs. HFpEF<65%).
Adjusted for sex and BMI, except V15/BSA and V15/BSA, which are only adjusted for sex
Rest Hemodynamics and Pressure-Volume Relationships
There were no differences in heart rate or blood pressure at rest among the 3 groups (Table 3). As compared with controls, both HFpEF groups displayed higher resting right and left heart filling pressures, higher pulmonary artery (PA) pressures, pulmonary vascular resistance (PVR) and systemic arterial elastance, and lower PA and total arterial compliance, with lower cardiac output (CO). However, there were no differences in resting hemodynamics between patients with HFpEF≥65% and HFpEF<65% (Table 3).
As compared to patients with HFpEF<65% and controls, those with HFpEF≥65% displayed an EDPVR that was shifted to the left, along with the highest LV stiffness coefficient β, indicating increased LV diastolic chamber stiffness, with lower LVEDV at common LVEDPs of 15 mmHg and 30 mmHg (V15 and V30) (Figure 1, Table 3).
Figure 1:

Mean end diastolic pressure volume relationships (EDPVR) for patients with HFsnEF (blue triangles), HFlnEF (red circles), and controls (black squares). The dashed lines denote mean resting left ventricular filling pressures measured at cardiac catheterization in the two HFpEF groups (upper horizontal line, 17 mmHg) and in the control patients (bottom horizontal line, 9 mmHg). LVEDV, left ventricular end diastolic volume; LVEDP, left ventricular end diastolic pressure.
V15 and V30 did not differ in HFpEF<65% and controls. Using V15 and V30 indexed to BSA, both HFpEF<65% and HFpEF≥65% displayed leftward shifted EDPVR as compared to controls, and patients with HFpEF≥65% again displayed increased stiffness compared with HFpEF<65%. V15 had a modest but significant inverse relationship with EF (r= -0.30, p<0.0001) that did not differ between groups.
Exercise Hemodynamics and Cardiac Function
Increases in mean arterial pressure with exercise were similar in all groups, but patients with HFpEF had lower peak heart rate (Table 4). As compared with controls, patients with HFpEF≥65% and HFpEF<65% displayed higher exercise right and left heart filling pressures, higher PA pressures, PVR, and systemic vascular resistance (SVR), lower PA compliance, and lower CO. However, there were no significant differences in the severity of exercise hemodynamic abnormalities between patients with HFpEF≥65% and HFpEF<65% (Table 4). Comparisons during exercise were similar at matched submaximal workload (20 W, Table S1). Peak VO2 was similarly impaired in HFpEF≥65% and HFpEF<65% compared with controls, with no difference between the two HFpEF groups (Table 4).
Table 4:
Exercise Hemodynamics
| Controls (n=149) |
HFpEF<65% (n=319) |
HFpEF≥65% (n=302) |
P valuea | |
|---|---|---|---|---|
| Heart rate, beats/min | 107 ± 22 | 102 ± 191 | 92 ± 231 | <0.001 |
| Mean BP, mmHg | 113 ± 17 | 115 ± 20 | 117 ± 22 | 0.954 |
| CO, l/min | 10.2 ± 2.8 | 8.8 ± 3.31 | 9.1 ± 3.21 | <0.001 |
| AVO2 diff, ml/dl | 9.3 ± 2.9 | 10.0 ± 2.71 | 9.3 ± 2.92 | 0.002 |
| VO2, ml/min/kg | 11.8 ± 4.0 | 9.5 ± 3.51 | 9.2 ± 3.31 | <0.001 |
| RER | 1.0 ± 0.1 | 1.0 ± 0.1 | 1.0 ± 0.1 | 0.508 |
| Lactate, mmol/L | 4.3 ± 2.1 | 3.7 ± 2.2 | 3.3 ± 1.9 | 0.310 |
| Central pressures | ||||
| RA pressure, mmHg | 10 ± 5 | 20 ± 71 | 20 ± 71 | <0.001 |
| PA systolic pressure, mmHg | 47 ± 11 | 66 ± 161 | 66 ± 171 | <0.001 |
| PA mean pressure, mmHg | 31 ± 8 | 46 ± 101 | 46 ± 111 | <0.001 |
| PCWP, mmHg | 18 ± 6 | 31 ± 61 | 31 ± 71 | <0.001 |
| Vascular function | ||||
| PVR, dyn·s·cm−5 | 110 ± 53 | 165 ± 1601 | 159 ± 1291 | <0.001 |
| PA compliance, ml/mmHg | 3.3 ± 1.3 | 2.8 ± 1.51 | 2.9 ± 1.51 | <0.001 |
| SVR, dyn·s·cm−5 | 903 ± 324 | 948 ± 3241 | 944 ± 3981 | 0.005 |
| TAC, ml/mm Hg | 1.0 ± 0.8 | 1.0 ± 0.6 | 1.0 ± 0.5 | 0.223 |
| Ea, mm Hg/ml | 1.8 (1.4, 2.3) | 1.8 (1.5, 2.4) | 1.8 (1.4, 2.4) | 0.083 |
AVO2 diff = arterial-venous oxygen content difference; CO=cardiac output; Ea=systemic effective arterial elastance. PA=pulmonary artery; PCWP=pulmonary capillary wedge pressure; PVR=pulmonary vascular resistance; RA=right atrial; RER = respiratory exchange ratio; SVR=systemic vascular resistance; TAC=total arterial compliance; VO2=Oxygen consumption;
Values are expressed as mean ± SD or median (IQR). Final column shows the p value by analysis of variance for any difference between groups.
Significant individual group differences (corrected for multiple hypothesis testing) are then shown by superscripts 1 (p<0.05 vs. Controls)
(p<0.05 vs. HFpEF<65%).
Adjusted for sex and BMI
A subgroup of patients underwent exercise echocardiography simultaneous with the invasive hemodynamic exercise testing (99/319 HFpEF<65%, 40/302 HFpEF≥65% and 38/149 controls). LV and right ventricular (RV) systolic velocities were impaired at rest and during exercise in both HFpEF groups compared with controls, while E/e’ ratio was higher in the two HFpEF groups (Table S2). There were no significant differences between HFpEF≥65% and HFpEF<65% in biventricular function during exercise.
Sensitivity Analyses
Sensitivity analyses were conducted to explore differing LVEF cutpoints (50–57%, 58–69%, and ≥70%) in a more granular fashion, and to evaluate women and men separately, given the well-known differences in heart size and EF in the sexes (Tables S3–S8). Consistent with the primary analyses, LV dimension and LVEDV were lower in both women and men with HFpEF with higher LVEF (Tables S3, S6). Men with HFpEF in the highest LVEF category had lower LV mass, along with smaller LVEDV, and greater RWT than men with HFpEF and LVEF in the lower ranges. LV strain was higher in both men and women in the higher LVEF ranges compared to lower LVEF ranges, and the EDPVR was shifted to the left in both women and men when evaluated separately and at these more granular LVEF cutpoints above (Tables S3–S8).
Similar to the primary analyses, there were no differences in rest or exercise hemodynamics in men and women with HFpEF in differing EF categories. Differences in the LV EDPVR were more evident using comparisons across HFpEF groups defined in this way, where patients with HF and EF≤57% displayed an EDPVR that was shifted to the right vs controls, while patients with HFpEF and increasing EF displayed EDPVR that was shifted progressively more leftward (Figure 2). These results were apparent in men and women when evaluated separately (Figures S1–S2).
Figure 2:

Mean end diastolic pressure volume relationships (EDPVR) for patients with for patients with HFpEF separated into those with lower EF (≤57%, red circles), middle EF (58–69%, blue triangles), and the highest EF (≥70%, pink triangles) as compared to controls (black squares). Abbreviations as in Figure 1.
Community-Based Cohort
In sensitivity analyses where a separate cohort of patients with HFpEF (n=244) were compared with healthy controls without cardiovascular disease (n=617) from a community-based cohort, we again observed lower V15 and V30, and increased LV stiffness constant β in HFpEF≥65% as compared with both HFpEF<65% and controls (Table 5, Figure 2). Left ventricular EDV was significantly lower in HFpEF≥65% compared with both HFpEF<65% and healthy controls. Ees was higher in HFpEF≥65% compared to both HFpEF<65% and controls, but sc-MFS was lower in both HFpEF groups compared to controls, being lowest in HFpEF<65% (Table 5, Figure 3).
Table 5.
Cardiac Structure and Function in the Community-Based Sample
| Controls (n=617) |
HFpEF<65% (n=156) |
HFpEF≥65% (n=88) |
p | |
|---|---|---|---|---|
| LVEDV (ml) | 134±31 | 141±40 | 119±301,2 | <0.0001 |
| LVEDVI (ml/m2) | 73.1±13.0 | 72.6±17.6 | 64.5±14.31,2 | <0.0001 |
| LV mass (g/m2.7) | 39.6±7.7 | 50.4±15.71 | 53.7±18.51 | <0.0001 |
| LVEF (%) | 63±5 | 59±41 | 69±41,2 | <0.0001 |
| Ees (mmHg/ml) | 1.99±0.59 | 2.18±0.761 | 2.72±0.921,2 | <0.0001 |
| Sc-mFS (%) | 100±10 | 89±141 | 97±91,2 | <0.0001 |
| LV stiffness β | 6.03 (6.01, 6.09) | 6.06 (5.94, 6.57) | 6.31 (6.01, 6.95)1,2 | <0.0001 |
| V15 (ml) | 108±23 | 108±33 | 93±251,2 | <0.0001 |
| V15/BSA (ml/m2) | 59.2±10.9 | 55.3±14.81 | 50.8±12.11,2 | <0.0001 |
| V30 (ml) | 121±26 | 121±37 | 105±281,2 | <0.0001 |
| V30/BSA (ml/m2) | 66.5±12.2 | 62.3±16.61 | 57.2±13.61,2 | <0.0001 |
BSA = body surface area; EF = ejection fraction; Ees = LV end-systolic elastance; LV = left ventricular; LVEDV = LV end diastolic volume; LVEDVI = left ventricular volume index; LVM = Left ventricular mass; Sc-mFS = stress corrected mid-wall fractional shortening; V15 = LVEDV at a common LV end-diastolic pressure of 15 mmHg; V30 = LVEDV at a common LV end-diastolic pressure of 30 mmHg.
Values are expressed as mean ± SD or median (IQR). Final column shows the p value by analysis of variance for any difference between groups.
Significant individual group differences by the Tukey HSD test are then shown by superscripts 1 (p<0.05 vs. Controls)
(p<0.05 vs. HFpEF<65%).
Figure 3:

Left ventricular structure and function in the community-based cohort. Patients with HFpEF≥65% displayed lower left ventricular (LV) end diastolic volume index (LVEDVI) compared with HFpEF<65% and healthy controls. Estimated LV volume indexed to body surface area at an EDP of 15 mmHg (V15 index) was lower in HFpEF<65% than controls, and lower in HFpEF≥65% than both HFpEF<65% and controls. LV end systolic elastance (Ees) increased from controls to HFpEF≥65% and HFpEF≥65%, but LV myocardial contractility assessed by stress-corrected midwall fractional shortening (Sc-MFS) was lower in both HFpEF groups than controls.
Additional sensitivity analyses were conducted to explore differing LVEF cutpoints used in the literature (50–59% and ≥60%, Tables S9–S11). Consistent with the primary analyses, LV dimension and LVEDV were lower in HFpEF with higher LVEF and leftward shifted EDPVR (lower V15 and V30).
Discussion
We performed a detailed evaluation of cardiac structure, function, and hemodynamics in patients with HFpEF with higher EF (≥65%) and lower EF (50–64%), comparing these groups to one another and to controls without HF. As compared to HFpEF<65%, patients with HFpEF≥65% were more likely to be women and hypertensive, and less likely to have atrial fibrillation. Left ventricular and LA volumes were lower in HFpEF≥65% than HFpEF<65%, even after accounting for sex and BMI. LV volumes in HFpEF≥65% did not differ from controls in the invasive cohort, but LVEDV was lower in HFpEF≥65% than controls in the community-based cohort. Strain-based measures of LV deformation were more impaired in HFpEF<65% than HFpEF≥65% and controls, but LV systolic function assessed by load-independent measures was impaired in both HFpEF≥65% and HFpEF<65%, despite higher Ees. The EDPVR was leftward shifted and LV β was higher in HFpEF≥65% compared to both HFpEF<65% and controls, indicating greater LV diastolic stiffness. Despite these differences, patients with HFpEF<65% and HFpEF≥65% displayed similar hemodynamic derangements at rest and with exercise, with similar impairments in aerobic capacity. Collectively, these data indicate that the most consistent and fundamental defining feature of patients with HF and EF in the higher range is a smaller, stiffer LV chamber with both diastolic and systolic myocardial dysfunction. The reduction in LV chamber size in HFpEF≥65% may explain the less impressive benefit from neurohormonal antagonists in these patients observed in secondary analyses from trial data, and suggests a new hypothesis, that therapies that promote LV eccentric remodeling and improved diastolic capacitance, such as exercise training or interventions to reduce external LV constraint, might be effective to improve outcomes for patients with HF and EF falling in the higher range.
Systolic Properties in HFpEF with Higher EF
Nearly 40 years ago, Topol and colleagues described a form of HF characterized by LV hypertrophy, supranormal EF, and diastolic dysfunction.23 More recently, Rosch et al. observed that LV end-systolic stiffness (elastance, Ees) was higher in HFpEF with EF>60% compared with EF 50–60%.10 However, increases in both EF and Ees should not necessarily be interpreted as evidence of heightened contractility. Ees is a load-independent measure of systolic properties, but it is also influenced by diastolic LV stiffness and chamber size. 24 Indeed, Ees is characteristically elevated in patients with HFpEF25 even in the presence of significant contractile dysfunction.12
Here, utilizing measures of LV systolic function that are independent of diastolic stiffening, loading conditions, and that account for chamber volume, such as PRSW and LVSW/EDV, we found that patients with HFpEF≥65% and HFpEF<65% have similar impairment in systolic function. The impairments in contractility by LV systolic velocities, PRSW, SW/EDV, and Sc-MFS in HFpEF≥65% were relatively modest at rest, but prior studies have shown that even mild impairments in systolic function may lead to marked impairments during exercise, and the lower contractility observed in HFpEF≥65% compared with controls does not support the idea that these patients present with a hypercontractile state, as recently stated, which would make negative inotropic interventions such as cardiac myosin inhibitors less likely to be effective.
Remodeling and Chamber Stiffening in HFpEF with Higher EF
The most conspicuous feature we observed in HFpEF≥65% was a smaller, stiffer LV as compared to HFpEF<65%. This difference is partly related to the higher proportion of women in HFpEF≥65%, as noted in other studies,3, 10, 23 and is consistent with the fact that women have smaller hearts than men.26 However, both LVEDV and LVEDVI remained lower in HFpEF≥65% compared with HFpEF<65% even after adjusting for sex, and LA volumes were also lower, further evidence for a reduction in cardiac size in HFpEF≥65%. Lower LA volume may be a consquence of the same chamber contracture and stiffening processes that affect the LV, potentially leading to a greater increase in pulmonary vascular pressures relative to LVEDP due to impairments in LA reservoir function. In the community-based sample, LV volumes were lower in HFpEF≥65% compared to both HFpEF≥65% and controls, whereas there was no difference in heart volumes compared to controls in the invasive cohort. This may be due to the fact that controls in the invasive arm were not truly normal, as they presented with exertional dyspnea, and had other indicators of preclinical HFpEF, such as reduced GLS.27, 28
In agreement with Rosch et al,10 we also observed that patients with HFpEF≥65% displayed a leftward shifted EDPVR compared to patients with lower EF. However, the study from Rosch et al. did not include a control group without HFpEF. Here, we observed that patients with HFpEF≥65% are characterized by a small, stiffer LV chamber filling on the steeper portion of its EDPVR (Figures 1 and 2). Conversely, the EDPVR was shifted to the right in patients with HFpEF and the lowest EF as compared to HFpEF with higher EF and controls, indicating eccentric remodeling (Figure 2).
Rosch et al. identified a greater increase in LVEDP in those with higher EF during isometric handgrip, despite less ability to augment LVEDV, resulting in a blunted increase in cardiac output.10 In the present study we observed that PCWP was similarly elevated in HFpEF≥65% and HFpEF<65%, both at rest and with exercise. Impairments in cardiac output reserve were also similarly abnormal, as were exercise-induced pulmonary hypertensive responses, right heart filling pressures, LV and RV functional reserve by simultaneous stress echocardiography (Table S2) and peak VO2. The reasons for the discrepant results may relate to the types of stress tested. Rosch and colleagues evaluated isometric handgrip, which increases blood pressure and heart rate, but induces much less dramatic changes in cardiac preload and afterload when compared with dynamic cycle ergometry.
The present data may help reconcile discrepant results from prior studies, which have variably shown that LV volumes are increased,29, 30 similar to,11 or even decreased31 in HFpEF compared to controls. Similar discrepancies have been reported in the EDPVR in prior studies, where patients with HFpEF have been shown to display a leftward shift in some,11, 32 as here in HFpEF≥65%, but not others.25, 33 The present data suggest that these between-study differences may relate at least partly to degree of inclusion of HFpEF patients with smaller and larger hearts and EF in these prior studies. Patients with HFpEF and lower EF did not display leftward shift in the EDPVR, and in the group with EF≤57% the EDPVR was rightward shifted (Figure 2), consistent with remodeling rather than volume contracture. This finding is more typical of HFrEF and is consistent with the observation that neurohormonal antagonists appear to have greater efficacy in HFpEF with lower EF.3–5
Mechanisms for Lack of Benefit with Neurohormonal Antagonists
In HFrEF the LV is dilated, and treatment with neurohormonal antagonists leads to reverse remodeling.34 Here, we show that in HFpEF≥65%, the ventricle is contracted, which would suggest that therapies that work in large part through reverse remodeling would be less efficacious. There could also be safety concerns that might blunt benefits from some neurohormonal antagonists in HFpEF≥65%. Vasodilators may be poorly tolerated in these patients,23 and are known to produce greater hypotensive effects in patients with higher EF, due in part to excessive reduction in preload from venodilation.10, 35 The lack of benefit from reverse remodeling and poor tolerability to preload reduction may partly explain a lack of benefit in some patients.
Potential New Treatments for Patients with Higher EF
More importantly, the present data suggest a new hypothesis, that perhaps LV volume is too small in many patients with HFpEF ang higher EF, and it may be that these patients might benefit from modest eccentric remodeling—the opposite of what is desired with conventional neurohormonal antagonists.34
One intervention that elicits this type of physiologic eccentric remodeling is exercise training. There is shrinkage in LVEDV with normal aging in humans, which this is associated with compensatory increases in EF.36 Age-associated LVEDV contraction is greatest among individuals with increasing resistive and pulsatile arterial loading,37 vascular abnormalities that are also common in patients with HFpEF.38 Sedentary behavior is a strong risk factor for HFpEF39 which may also promote volume contraction. Howden et al. showed that sustained increases in activity levels increase LV volume and diastolic capacitance (higher EDV with similar PCWP), changes that would be expected to reduce risk for HFpEF.40 Changes in EF were not reported with training in this study, but proportional increases in EDV were more than two-fold greater than increases in stroke volume, which would imply a decrease in EF with training.
In contrast, among patients with HFpEF, exercise training has not been shown to promote eccentric remodeling,41 which suggests a potential role for other approaches. In this light, pericardiotomy may be another potential treatment for HFpEF≥65%. We did not observe that pericardial restraint was greater in HFpEF patients with higher EF, but because pericardiectomy or pericardiotomy leads to eccentric remodeling and rightward shift in animals and humans,42–44 along with improvements in LV diastolic reserve with volume loading,45, 46 we hypothesize that patients with HFpEF≥65% may be positioned to derive greater benefit from this intervention based upon the present data. Increases in LVEDV during exercise are often blunted in HFpEF, despite marked elevation in PCWP, suggesting greater pericardial restraint on the heart limiting filling but augmenting LVEDP.47, 48
In adults undergoing pericardiotomy for cardiac surgery, there is a mild, balanced increase in LV volume and mass that develops in the weeks following surgery, very similar to the morphologic changes observed with exercise training.43 Preliminary studies in animal models and patients at risk for HFpEF indicate that increases in LV filling pressure with volume loading are markedly attenuated through pericardiotomy,45, 46 suggesting that targeting this external constraint could improve diastolic reserve. In tandem with these studies, the present data suggest that even modest increases in LVEDV and reductions in external constraint may be even more helpful in patients with HFpEF≥65.
Limitations
The present data come from a single center leading to selection and referral bias. The observational nature of these data does not permit ascription of causality. The invasive control group were not completely healthy controls as they were referred for invasive testing because of exertional dyspnea, and they displayed other findings of cardiac dysfunction such as reduced GLS. However, the main results were confirmed in the sensitivity analysis using healthy controls free of cardiovascular disease drawn from a community-based sample (Table 5).11, 12 While LV filling pressures were measured using high fidelity micromanometers, LV mass and volume were measured by transthoracic echocardiography, which is less precise compared to cardiac MRI. However, this limitation would only be expected to reduce sensitivity to detect group differences rather than the specificity of the findings, and the limited precision related to echocardiography assessments applies equally to cases and controls, so there is no bias.
Conclusion
Patients with HFpEF and LVEF falling in the higher range display similar impairments in hemodynamics and functional capacity as those with HFpEF and lower EF. Left ventricular volume is lower and chamber stiffness is higher in HFpEF≥65% than HFpEF<65% and healthy controls without cardiovascular disease. Collectively, these data indicate that small left ventricular size and increased stiffness are defining features of HFpEF and higher EF. This may partially explain the differential responses to a number of treatments observed in clinical trials to date, and also raises a new hypothesis that interventions to increase LV cavity volume and improve diastolic capacitance may be effective to improve clinical status for patients with HFpEF and higher EF.
Supplementary Material
Acknowledgements
The authors thank the staff of the Mayo Clinic Earl Wood Catheterization Laboratory and the patients who agreed to participate in research, allowing for this study to be completed.
Sources of Funding
Dr. Borlaug is supported by R01 HL128526 and U01 HL160226, from the National Institutes of Health (NIH), and W81XWH2210245 from the United States Department of Defense (DoD).
Abbreviations
- HFpEF
heart failure of preserved ejection fraction
- HFpEF<65%
heart failure and low-normal ejection fraction (50%≤LVEF<65%)
- HFpEF≥65%
heart failure of higher ejection fraction (LVEF≥65%)
- LA
left atrium
- LV
left ventricle
- LVEDP
left ventricular end-diastolic pressure
- LVEDV
left ventricular end-diastolic volume
- EDPVR
end-diastolic pressure/volume relationship
- PA
pulmonary artery
- PCWP
pulmonary capillary wedge pressure
- PRSW
single-beat pre-load recruitable stroke work
- V15
LVEDV at a common LVEDP of 15 mmHg
- V30
LVEDV at a common LVEDP of 30 mmHg
Footnotes
Disclosures
Dr. Borlaug has received research support from NIH and the Dept of Defense, as well as research grants from AstraZeneca, Axon, GlaxoSmithKline, Medtronic, Mesoblast, Novo Nordisk, and Tenax Therapeutics, consulting fees from Actelion, Amgen, Aria, Axon Therapies, BD, Boehringer Ingelheim, Cytokinetics, Edwards Lifesciences, Eli Lilly, Imbria, Janssen, Merck, Novo Nordisk, NGM, NXT, and VADovations. Dr. Borlaug is named inventor on an issued patent (US Patent no. 10,307,179) for the tools and approach for a minimally invasive pericardial modification procedure to treat heart failure. Dr. Burkhoff has served as a consultant to Axon Therapies and Corvia. The other authors have nothing to disclose.
References
- 1.Pfeffer MA, Shah AM and Borlaug BA. Heart Failure With Preserved Ejection Fraction In Perspective. Circ Res 2019;124:1598–1617. [DOI] [PMC free article] [PubMed] [Google Scholar]
- 2.Borlaug BA. Evaluation and management of heart failure with preserved ejection fraction. Nat Rev Cardiol 2020;17:559–573. [DOI] [PubMed] [Google Scholar]
- 3.Solomon SD, Claggett B, Lewis EF, Desai AS, Anand IS, Sweitzer NK, Shah SJ, McKinlay S, Fleg JL, Sopko G, Pitt B and Pfeffer MA. Influence of Ejection Fraction on Outcomes and Efficacy of Spironolactone in Patients with Heart Failure and Preserved Ejection Fraction. Eur Heart J 2016;37:455–62. [DOI] [PMC free article] [PubMed] [Google Scholar]
- 4.Lund LH, Claggett B, Liu J, Lam CS, Jhund PS, Rosano GM, Swedberg K, Yusuf S, Granger CB, Pfeffer MA, McMurray JJV and Solomon SD. Heart failure with mid-range ejection fraction in CHARM: characteristics, outcomes and effect of candesartan across the entire ejection fraction spectrum. Eur J Heart Fail 2018. [DOI] [PubMed] [Google Scholar]
- 5.Solomon SD, Vaduganathan M, B LC, Packer M, Zile M, Swedberg K, Rouleau J, M AP, Desai A, Lund LH, Kober L, Anand I, Sweitzer N, Linssen G, Merkely B, Luis Arango J, Vinereanu D, Chen CH, Senni M, Sibulo A, Boytsov S, Shi V, Rizkala A, Lefkowitz M and McMurray JJV. Sacubitril/Valsartan Across the Spectrum of Ejection Fraction in Heart Failure. Circulation 2020;141:352–361. [DOI] [PubMed] [Google Scholar]
- 6.Butler J, Packer M, Filippatos G, Ferreira JP, Zeller C, Schnee J, Brueckmann M, Pocock SJ, Zannad F and Anker SD. Effect of empagliflozin in patients with heart failure across the spectrum of left ventricular ejection fraction. Eur Heart J 2022;43:416–426. [DOI] [PMC free article] [PubMed] [Google Scholar]
- 7.Vaduganathan M, Claggett BL, Inciardi RM, Fonarow GC, McMurray JJV and Solomon SD. Estimating the Benefits of Combination Medical Therapy in Heart Failure With Mildly Reduced and Preserved Ejection Fraction. Circulation 2022;145:1741–1743. [DOI] [PubMed] [Google Scholar]
- 8.Paulus WJ. Border Disputes Between Heart Failure Phenotypes. Circulation 2022;145:1374–1376. [DOI] [PubMed] [Google Scholar]
- 9.Borlaug BA. Defining HFpEF: where do we draw the line? Eur Heart J 2016;37:463–5. [DOI] [PubMed] [Google Scholar]
- 10.Sebastian Rosch K- PK, Christian Besler, Karl Fengler, Anne Rebecca Schöber, Maximilian von Roeder, Christian Lücke, Matthias Gutberlet, Karin Klingel, Holger Thiele, Karl-Philipp Rommel and Philipp Lurz. Characteristics of Heart Failure With Preserved Ejection Fraction Across the Range of Left Ventricular Ejection Fraction. Circulation 2022. [DOI] [PubMed] [Google Scholar]
- 11.Lam CS, Roger VL, Rodeheffer RJ, Bursi F, Borlaug BA, Ommen SR, Kass DA and Redfield MM. Cardiac structure and ventricular-vascular function in persons with heart failure and preserved ejection fraction from Olmsted County, Minnesota. Circulation 2007;115:1982–90. [DOI] [PMC free article] [PubMed] [Google Scholar]
- 12.Borlaug BA, Lam CS, Roger VL, Rodeheffer RJ and Redfield MM. Contractility and ventricular systolic stiffening in hypertensive heart disease insights into the pathogenesis of heart failure with preserved ejection fraction. J Am Coll Cardiol 2009;54:410–8. [DOI] [PMC free article] [PubMed] [Google Scholar]
- 13.Borlaug BA, Kane GC, Melenovsky V and Olson TP. Abnormal right ventricular-pulmonary artery coupling with exercise in heart failure with preserved ejection fraction. Eur Heart J 2016;37:3293–3302. [DOI] [PMC free article] [PubMed] [Google Scholar]
- 14.Lang RM, Badano LP, Mor-Avi V, Afilalo J, Armstrong A, Ernande L, Flachskampf FA, Foster E, Goldstein SA, Kuznetsova T, Lancellotti P, Muraru D, Picard MH, Rietzschel ER, Rudski L, Spencer KT, Tsang W and Voigt JU. Recommendations for cardiac chamber quantification by echocardiography in adults: an update from the American Society of Echocardiography and the European Association of Cardiovascular Imaging. J Am Soc Echocardiogr 2015;28:1–39 e14. [DOI] [PubMed] [Google Scholar]
- 15.Jeyaprakash P, Moussad A, Pathan S, Sivapathan S, Ellenberger K, Madronio C, Thomas L, Negishi K and Pathan F. A Systematic Review of Scaling Left Atrial Size: Are Alternative Indexation Methods Required for an Increasingly Obese Population? J Am Soc Echocardiogr 2021;34:1067–1076 e3. [DOI] [PubMed] [Google Scholar]
- 16.Shah AM, Claggett B, Sweitzer NK, Shah SJ, Anand IS, Liu L, Pitt B, Pfeffer MA and Solomon SD. Prognostic Importance of Impaired Systolic Function in Heart Failure With Preserved Ejection Fraction and the Impact of Spironolactone. Circulation 2015;132:402–14. [DOI] [PMC free article] [PubMed] [Google Scholar]
- 17.Lee WS, Huang WP, Yu WC, Chiou KR, Ding PY and Chen CH. Estimation of preload recruitable stroke work relationship by a single-beat technique in humans. Am J Physiol Heart Circ Physiol 2003;284:H744–50. [DOI] [PubMed] [Google Scholar]
- 18.Borlaug BA, Koepp KE and Melenovsky V. Sodium Nitrite Improves Exercise Hemodynamics and Ventricular Performance in Heart Failure With Preserved Ejection Fraction. J Am Coll Cardiol 2015;66:1672–82. [DOI] [PubMed] [Google Scholar]
- 19.Kass DA, Maughan WL, Guo ZM, Kono A, Sunagawa K and Sagawa K. Comparative influence of load versus inotropic states on indexes of ventricular contractility: experimental and theoretical analysis based on pressure-volume relationships. Circulation 1987;76:1422–36. [DOI] [PubMed] [Google Scholar]
- 20.Ling HZ, Flint J, Damgaard M, Bonfils PK, Cheng AS, Aggarwal S, Velmurugan S, Mendonca M, Rashid M, Kang S, Papalia F, Weissert S, Coats CJ, Thomas M, Kuskowski M, Cohn JN, Woldman S, Anand IS and Okonko DO. Calculated plasma volume status and prognosis in chronic heart failure. Eur J Heart Fail 2015;17:35–43. [DOI] [PubMed] [Google Scholar]
- 21.Davies DR, Redfield MM, Scott CG, Minamisawa M, Grogan M, Dispenzieri A, Chareonthaitawee P, Shah AM, Shah SJ, Wehbe RM, Solomon SD, Reddy YNV, Borlaug BA and AbouEzzeddine OF. A Simple Score to Identify Increased Risk of Transthyretin Amyloid Cardiomyopathy in Heart Failure With Preserved Ejection Fraction. JAMA Cardiol 2022. [DOI] [PMC free article] [PubMed] [Google Scholar]
- 22.Klotz S, Hay I, Dickstein ML, Yi GH, Wang J, Maurer MS, Kass DA and Burkhoff D. Single-beat estimation of end-diastolic pressure-volume relationship: a novel method with potential for noninvasive application. Am J Physiol Heart Circ Physiol 2006;291:H403–12. [DOI] [PubMed] [Google Scholar]
- 23.Topol EJ, Traill TA and Fortuin NJ. Hypertensive hypertrophic cardiomyopathy of the elderly. N Engl J Med 1985;312:277–83. [DOI] [PubMed] [Google Scholar]
- 24.Chen CH, Nakayama M, Nevo E, Fetics BJ, Maughan WL and Kass DA. Coupled systolic-ventricular and vascular stiffening with age: implications for pressure regulation and cardiac reserve in the elderly. J Am Coll Cardiol 1998;32:1221–7. [DOI] [PubMed] [Google Scholar]
- 25.Kawaguchi M, Hay I, Fetics B and Kass DA. Combined ventricular systolic and arterial stiffening in patients with heart failure and preserved ejection fraction: implications for systolic and diastolic reserve limitations. Circulation 2003;107:714–20. [DOI] [PubMed] [Google Scholar]
- 26.Chung AK, Das SR, Leonard D, Peshock RM, Kazi F, Abdullah SM, Canham RM, Levine BD and Drazner MH. Women have higher left ventricular ejection fractions than men independent of differences in left ventricular volume: the Dallas Heart Study. Circulation 2006;113:1597–604. [DOI] [PubMed] [Google Scholar]
- 27.Halabi A, Yang H, Wright L, Potter E, Huynh Q, Negishi K and Marwick TH. Evolution of Myocardial Dysfunction in Asymptomatic Patients at Risk of Heart Failure. JACC Cardiovasc Imaging 2021;14:350–361. [DOI] [PubMed] [Google Scholar]
- 28.Koepp KE, Reddy YNV, Obokata M, Sorimachi H, Verbrugge FH, Jain CC, Egbe AC, Redfield MM, Olson TP and Borlaug BA. Identification of Patients with Preclinical Heart Failure with preserved Ejection Fraction Using the H2FPEF Score. Nat Cardiovasc Res 2022;1:59–66. [DOI] [PMC free article] [PubMed] [Google Scholar]
- 29.Maurer MS, King DL, El-Khoury Rumbarger L, Packer M and Burkhoff D. Left heart failure with a normal ejection fraction: identification of different pathophysiologic mechanisms. J Card Fail 2005;11:177–87. [DOI] [PubMed] [Google Scholar]
- 30.Maurer MS, Burkhoff D, Fried LP, Gottdiener J, King DL and Kitzman DW. Ventricular structure and function in hypertensive participants with heart failure and a normal ejection fraction: the Cardiovascular Health Study. J Am Coll Cardiol 2007;49:972–81. [DOI] [PubMed] [Google Scholar]
- 31.Borlaug BA, Melenovsky V, Russell SD, Kessler K, Pacak K, Becker LC and Kass DA. Impaired chronotropic and vasodilator reserves limit exercise capacity in patients with heart failure and a preserved ejection fraction. Circulation 2006;114:2138–47. [DOI] [PubMed] [Google Scholar]
- 32.Zile MR, Baicu CF and Gaasch WH. Diastolic heart failure--abnormalities in active relaxation and passive stiffness of the left ventricle. N Engl J Med 2004;350:1953–9. [DOI] [PubMed] [Google Scholar]
- 33.Burkhoff D, Maurer MS and Packer M. Heart failure with a normal ejection fraction: is it really a disorder of diastolic function? Circulation 2003;107:656–8. [DOI] [PubMed] [Google Scholar]
- 34.Konstam MA, Kramer DG, Patel AR, Maron MS and Udelson JE. Left ventricular remodeling in heart failure: current concepts in clinical significance and assessment. JACC Cardiovasc Imaging 2011;4:98–108. [DOI] [PubMed] [Google Scholar]
- 35.Schwartzenberg S, Redfield MM, From AM, Sorajja P, Nishimura RA and Borlaug BA. Effects of vasodilation in heart failure with preserved or reduced ejection fraction implications of distinct pathophysiologies on response to therapy. J Am Coll Cardiol 2012;59:442–51. [DOI] [PubMed] [Google Scholar]
- 36.Cheng S, Fernandes VR, Bluemke DA, McClelland RL, Kronmal RA and Lima JA. Age-related left ventricular remodeling and associated risk for cardiovascular outcomes: the Multi-Ethnic Study of Atherosclerosis. Circ Cardiovasc Imaging 2009;2:191–8. [DOI] [PMC free article] [PubMed] [Google Scholar]
- 37.Wohlfahrt P, Redfield MM, Melenovsky V, Lopez-Jimenez F, Rodeheffer RJ and Borlaug BA. Impact of chronic changes in arterial compliance and resistance on left ventricular ageing in humans. Eur J Heart Fail 2015;17:27–34. [DOI] [PMC free article] [PubMed] [Google Scholar]
- 38.Reddy YNV, Andersen MJ, Obokata M, Koepp KE, Kane GC, Melenovsky V, Olson TP and Borlaug BA. Arterial Stiffening With Exercise in Patients With Heart Failure and Preserved Ejection Fraction. J Am Coll Cardiol 2017;70:136–148. [DOI] [PMC free article] [PubMed] [Google Scholar]
- 39.Pandey A, LaMonte M, Klein L, Ayers C, Psaty BM, Eaton CB, Allen NB, de Lemos JA, Carnethon M, Greenland P and Berry JD. Relationship Between Physical Activity, Body Mass Index, and Risk of Heart Failure. J Am Coll Cardiol 2017;69:1129–1142. [DOI] [PMC free article] [PubMed] [Google Scholar]
- 40.Howden EJ, Sarma S, Lawley JS, Opondo M, Cornwell W, Stoller D, Urey MA, Adams-Huet B and Levine BD. Reversing the Cardiac Effects of Sedentary Aging in Middle Age-A Randomized Controlled Trial: Implications For Heart Failure Prevention. Circulation 2018;137:1549–1560. [DOI] [PMC free article] [PubMed] [Google Scholar]
- 41.Fujimoto N, Prasad A, Hastings JL, Bhella PS, Shibata S, Palmer D and Levine BD. Cardiovascular effects of 1 year of progressive endurance exercise training in patients with heart failure with preserved ejection fraction. Am Heart J 2012;164:869–77. [DOI] [PMC free article] [PubMed] [Google Scholar]
- 42.Applegate RJ, Johnston WE, Vinten-Johansen J, Klopfenstein HS and Little WC. Restraining effect of intact pericardium during acute volume loading. Am J Physiol 1992;262:H1725–33. [DOI] [PubMed] [Google Scholar]
- 43.Tischler MD, Rowan M and LeWinter MM. Increased left ventricular mass after thoracotomy and pericardiotomy. A role for relief of pericardial constraint? Circulation 1993;87:1921–7. [DOI] [PubMed] [Google Scholar]
- 44.Hammond HK, White FC, Bhargava V and Shabetai R. Heart size and maximal cardiac output are limited by the pericardium. Am J Physiol 1992;263:H1675–81. [DOI] [PubMed] [Google Scholar]
- 45.Borlaug BA, Schaff HV, Pochettino A, Pedrotty DM, Asirvatham SJ, Abel MD, Carter RE and Mauermann WJ. Pericardiotomy Enhances Left Ventricular Diastolic Reserve With Volume Loading in Humans. Circulation 2018;138:2295–2297. [DOI] [PMC free article] [PubMed] [Google Scholar]
- 46.Jain CC, Pedrotty D, Araoz PA, Sugrue A, Vaidya VR, Padmanabhan D, Arunachalam SP, Lerman LO, Asirvatham SJ and Borlaug BA. Sustained Improvement in Diastolic Reserve Following Percutaneous Pericardiotomy in a Porcine Model of Heart Failure With Preserved Ejection Fraction. Circ Heart Fail 2021;14:e007530. [DOI] [PMC free article] [PubMed] [Google Scholar]
- 47.Kitzman DW, Higginbotham MB, Cobb FR, Sheikh KH and Sullivan MJ. Exercise intolerance in patients with heart failure and preserved left ventricular systolic function: failure of the Frank-Starling mechanism. J Am Coll Cardiol 1991;17:1065–72. [DOI] [PubMed] [Google Scholar]
- 48.Borlaug BA, Jaber WA, Ommen SR, Lam CS, Redfield MM and Nishimura RA. Diastolic relaxation and compliance reserve during dynamic exercise in heart failure with preserved ejection fraction. Heart 2011;97:964–9. [DOI] [PMC free article] [PubMed] [Google Scholar]
Associated Data
This section collects any data citations, data availability statements, or supplementary materials included in this article.