

Abstract
Objective:
To examine racial and ethnic differences in occupational physical demands, substantive complexity, time pressure, work hours and establishment size, and assess whether working conditions contribute to racial and ethnic differences in self-rated health.
Methods:
We used 2017 and 2019 Panel Study of Income Dynamics data for 8,439 adults. Using path models, we examined working conditions among Black, Latino and White workers and explored whether those conditions mediated racial and ethnic differences in incident poor self-rated health.
Results:
Some working conditions disproportionately affected Black workers (high physical demands, low substantive complexity), Latino workers (low substantive complexity, small establishments), and White workers (time pressure). Time pressure predicted worse self-rated health; there was no evidence that the working conditions studied mediated racial/ethnic differences.
Conclusions:
Working conditions vary by racial and ethnic group; some predict worse health.
Keywords: Working conditions, Occupational health, Health equity, Health status, Racial groups, Racism, Longitudinal study
Introduction
Racial and ethnic health inequities are a persistent and pressing public health problem.1 Race is a social construct,2 and health inequities by race are, by and large, not due to genetic differences.3 Rather, racial health inequities are due to racism that has been, and continues to be, realized through interwoven structures like public and private policies and interpersonal discrimination.3,4 One example of how racism is embodied as unequal health is that Black and Latino/Hispanic adults describe their health as poor or fair more often than White adults.5,6 This is concerning, as self-rated health predicts physical health7 and mortality over time.8 Understanding the pathways that lead to disparate health outcomes among racial and ethnic groups is necessary in order to reduce those disparities.
There are multiple pathways through which racism leads to racial/ethnic health inequities; occupational exposure is recognized as one pathway, and it is less studied than other pathways such as healthcare system issues.9,10 Racism leads to differential exposure to working conditions through multiple processes. Discrimination and unequal access to educational and training opportunities have meant that Americans of color had less access to safe, well-paying jobs compared to White workers.11–13 Further, even within a specific job, workers of color may disproportionately experience hazardous tasks and/or racist treatment.14–16
Among the three largest racial/ethnic groups in the United States, a variety of working conditions disparities are apparent. For instance, Black and Latino Americans are more likely than White Americans to work in occupations involving more workplace injuries,17,18 and, particularly among Latino workers, lower substantive complexity (that is, fewer opportunities for critical thinking, reasoning).19 White workers are more likely to experience greater substantive complexity19 and fewer hazards at work,17,18 but also longer hours.20 Black workers are the most likely to work for large organizations, which are considered safer, while White workers are somewhat less likely, and Latino workers are the least likely.21
Thus, there is a complicated system of relationships between race/ethnicity and working conditions, with different groups being exposed to distinct risk factors. Prior studies connecting working conditions to racial/ethnic health disparities have often focused on just one or two working conditions,19,22,23 rather than a fuller range including physical, psychosocial and employment/labor conditions. Also, while some studies have included Latino workers,19,22 this group has received less research attention than White and Black workers.23
In addition to considering a wider range of working conditions and racial/ethnic groups, there is also a web of interrelationships and potential confounders requiring consideration. Education, for instance, varies by race/ethnicity,24 predicts self-rated health,25 and is associated with working conditions.20 It likely affects health through multiple pathways,26 including but not limited to the way it shapes employment opportunities and by extension, working conditions. Similarly, in the United States, health insurance access varies by race/ethnicity,27 predicts self-rated health,28 and, correlates with working conditions,29 in part because it is often tied to employment.30 Estimates of how working conditions contribute to health outcomes should account for these interrelationships.
Our study contributes to the scientific literature by examining how occupational physical demands, substantive complexity, time pressure, work hours and establishment size relate to differences in incident poor health among Black, White and Latino workers. We use Panel Study of Income Dynamics (PSID) data and path modeling to examine this set of working conditions, and we include education as a variable that links race and ethnicity with working conditions and also contributes directly to self-rated health. We consider whether these working conditions predict incident poor health at two-year follow-up, and whether they mediate the relationship between race/ethnicity and self-rated health.
Methods
Study design
We examined working conditions across a population of working adults in 2017. We used a longitudinal design to measure the degree to which working conditions in 2017 predicted incident poor self-rated health in 2019.
Data
We used publicly available data from the Panel Study of Income Dynamics (PSID), a longitudinal study of US households conducted using computer-assisted telephone surveys.31 The PSID surveys over 9,500 families every two years on a range of socioeconomic and health-related topics. The sample includes an oversample of low-income families. The overall response rate is 91% and wave-to-wave response rate is 94%. One individual per household responds for all household members. Participants receive incentives.32
In the PSID, 13,332 adults (reference persons and spouses) were included in the 2017 and 2019 waves and had employment status available. Of these, 9,468 reported working in the 2017 wave. We conducted analysis on the complete cases. For all but one study variable, fewer than 2% of respondents had missing information; the highest rate of non-response was for work establishment size, for which 542 respondents (5.7%) did not respond. A total of 8,439 (89.1%) had complete information for all study variables. Of these, we performed multivariate analysis on a sample on n=7,490 that excluded those with poor health in 2017.
Measures
Self-rated health
Self-rated health was assessed in both 2017 and 2019 using an item asking “would you say your health in general is excellent, very good, good, fair or poor.” In line with prior research,33 we binarized the responses (fair or poor=1, referred to as “poor health;” excellent, very good, good=0). Individuals who did not have poor health in 2017 but had poor health in 2019 were determined to have incident poor health.
Race/ethnicity
We consider race a proxy measure for present day racialization processes.34 Race was assessed using an item asking, “are you White, Black, American Indian, Alaska Native, Asian, Native Hawaiian or Pacific Islander?” The PSID allows for multiple race mentions, we utilized the first mention. Ethnicity was assessed using an item that asked, “are you Spanish, Hispanic or Latino? That is, Mexican, Mexican American, Chicano, Puerto Rican, Cuban, or other Spanish?” Individuals who responded affirmatively were categorized as Hispanic/Latino, independent of the race they selected. We organized responses into White, Black, Hispanic/Latino, American Indian/Native American, Asian American and Other races. The multivariate analyses focused on comparisons among the three largest race/ethnic categories in the sample – White (non-Hispanic/Latino), Black (non-Hispanic/Latino) and Latino adults. Models depicted in detail here use White respondents as the reference, in line with prior research;19 a third model comparing Latino respondents with Black respondents as the reference is shown in the supplemental appendix.
Working conditions:
The working conditions items in PSID begin with an instruction that respondents consider “the time [they] spend working in a typical week.” For respondents with multiple jobs, the questions applied to all of those jobs. Items about physical demands, substantive complexity and time pressure began with the phrase, “While you are working…,” and had the following response choices: never, rarely, sometimes, often, or almost always. High physical demands were assessed with an item asking, “how often do you perform physically demanding activities, for example, those that require strength or physical effort for long periods of time?” We categorized responses of often or almost always as high physical demands. Substantive complexity was assessed with an item asking, “how often do you perform mentally demanding activities, for example, analyzing information, learning new material or solving complex problems?” We categorized responses of sometimes, rarely and never as low substantive complexity. Time pressure was assessed with an item asking, “how often do you feel rushed or pressed for time” We categorized responses of often or almost always as often pressed for time.
Hours worked per week was assessed with the item, “on average, how many hours a week did you work on all of your jobs.” Respondents then stated the total number of hours worked per week. We categorized responses into less than 40 hours, 40 hours, 41–50 hours, and over 50 hours per week.
Establishment size was assessed with the item, “how many people are employed by [name of employer] at the location where you work?” Respondents then stated the number of employees. We categorized responses into less than 15, 16 to 50, 51 to 500 and over 500.
Control variables
We controlled for age, sex, educational attainment, and health insurance in our multivariate models.35 Age was assessed in years. Sex was assessed with a question asking if individuals were male or female. Educational attainment was assessed with items asking, “did you graduate from high school, get a GED [test of general education development] or neither?” and follow-up items for additional detail (e.g., if yes to the initial question “did you attend college” and “what is the highest year of college you completed.”) For analyses, we categorized responses into high school graduate or less; some college; bachelor’s degree or above. Health insurance was assessed with items asking, “do you currently have health insurance or health coverage”” and “what kind of health insurance or health coverage do you have?” We categorized these into no insurance; employer-provided insurance; other private insurance; and public insurance. Lastly, all models included a variable to account for whether survey responses were provided by the respondent themselves or by another household member.
Analysis
PSID respondents who reported being employed in the 2017 data wave and had complete data for all variables were included in the analytic sample. We calculated descriptive statistics and polychoric correlations for all ordinal or binary variables. To assess co-occurrence of unhealthy working conditions, we created a count variable for which one point was added for each unhealthy condition reported. The unhealthy conditions were: high physical demands, low substantive complexity, often pressed for time, working over 50 hours per week, and working in an establishment with less than 16 employees; the possible count range was 0 to 5. We used regression (linear for continuous variables, logistic for categorical) to compare descriptive statistics among Black, White and Latino workers. Table 1 shows descriptive statistics for the analytic sample, including for respondents who had poor health in 2017 and were not included in the multivariate models. Descriptive statistics for only the groups included in the multivariate models are shown in a supplemental table (Table S1). A correlation table is shown in Table S2.
Table 1.
Descriptive statistics for analytic sample (n=8,439)
| |
All respondents n=8,439 n (%) |
Black n=2,629 n (%) |
White n=4,640 n (%) |
Latino/Hispanic n=915 n (%) |
|---|---|---|---|---|
| Health characteristics | ||||
| Poor self-rated health, 2017 | 949a (10.70) | 381 (14.13)*W | 386 (8.90)*B, *L | 153 (17.69) *W |
| Poor self-rated health, 2019 | 1,060 (12.75) | 408 (17.39)*W | 460 (10.97)*B, *L | 159 (18.07) *W |
| Sociodemographic characteristics | ||||
| Race/ethnicity | ||||
| White | 4,640 (70.31) | |||
| American Indian/Native American | 45 (0.41) | |||
| Asian American | 143 (4.75) | |||
| Black/African American | 2,629 (9.64) | |||
| Hispanic/Latino | 915 (13.91) | |||
| Other races | 67 (0.99) | |||
| Age | Mean=45.21, SD=12.81 | Mean=43.30,*W,*L SD=12.28 | Mean=46.34,B,*L SD=13.17 * | Mean=41.34,*B,*W SD=11.65 |
| Sex | ||||
| Female | 4,321 (48.31) | 1,511 (55.60) *W,*L | 2,245 (48.13) *B | 435 (53.86) *B |
| Male | 4,118 (51.69) | 1,118 (44.40) *W,*L | 2,395 (51.87) *B | 480 (46.14) *B |
| Educational attainment | ||||
| High school graduate or less | 2,881 (34.40) | 1,050 (43.28) *W,*L | 1,311 (30.91) *B,*L | 472 (54.18) *B,*W |
| Some college | 2,434 (24.84) | 940 (33.01) *W,*L | 1,203 (25.08) *B | 240 (23.70) *B |
| Bachelor's degree or more | 3,124 (40.76) | 639 (23.71) *W | 2,126 (44.01) *B,*L | 203 (22.13) *W |
| Health insurance | ||||
| No insurance | 954 (9.35) | 427 (13.67) *W,*L | 304 (6.23) *B,*L | 210 (24.50) *B,*W |
| Employer-provided | 5,693 (68.52) | 1,609 (63.92) W,*L | 3,449 (72.64) *B,*L | 456 (48.73) *B,*W |
| Other private | 585 (8.10) | 161 (6.47) *L | 331 (7.89) | 74 (9.43) *B |
| Public insurance | 1,207 (14.03) | 432 (15.93) | 556 (13.25) | 175 (17.34) |
| Working conditions | ||||
| High physical demands | 2,897 (31.18) | 1,093 (45.08) *W,*L | 1,397 (29.09) *B,*L | 342 (36.41) *B,*W |
| Low substantive complexity | 2,749 (31.37) | 1,024 (40.39) *W | 1,291 (28.60) *B,*L | 382 (44.56) *W |
| Often pressed for time | 3,738 (45.92) | 986 (39.66) *W, *L | 2,229 (46.90) *B | 412 (46.70) *B |
| Hours worked per week | ||||
| Less than 40 hours | 1,908 (24.60) | 563 (23.66) | 1,101 (25.82) | 192 (21.96) |
| 40 hours | 3,499 (37.84) | 1,291 (44.05) *W | 1,650 (33.96) *B, *L | 442 (47.95) *W |
| 41–50 hours | 1,909 (24.37) | 426 (16.89) *W, *L | 1,264 (27.25) *B | 166 (17.20) *W |
| >50 hours | 1,123 (13.19) | 349 (15.40) | 625 (12.97) | 115 (12.90) |
| Size of establishment | ||||
| Less than 16 employees | 2,832 (36.05) | 761 (27.47) *W, *L | 1,658 (37.07) *B | 328 (38.28) *B |
| 16–50 employees | 1,818 (20.94) | 555 (19.19) | 996 (21.17) | 217 (22.90) |
| 51–500 employees | 2,662 (30.19) | 913 (36.50) *W | 1,384 (29.14) *B | 291 (31.14) |
| Over 500 employees | 1,127 (12.83) | 400 (16.84) *W, *L | 602 (12.62) *B, *L | 79 (7.68) *B,*W |
| Count of unhealthy working conditions | ||||
| 0 conditions | 1,122 (13.67) | 317 (10.12) | 667 (14.32) | 94 (9.45) |
| 1 condition | 3,080 (36.34) | 958 (35.43) | 1,721 (37.41) | 291 (29.48) |
| 2 conditions | 2,735 (32.17) | 884 (34.50) | 1,444 (31.10) | 334 (38.20) |
| 3 conditions | 1,235 (14.47) | 398 (16.56) | 650 (13.76) | 165 (18.92) |
| 4 conditions | 251 (3.16) | 67 (3.07) | 149 (3.27) | 30 (3.5) |
| 5 conditions | 16 (0.20) | 5 (0.32) | 9 (0.12) | 1 (0.44) |
| Average number reported | Mean=1.58, SD=1.00 | Mean=1.60,*W*L SD=0.98 | Mean=1.55,*B SD=1.01 | Mean=1.73,*W SD=0.99 |
This is the subsample excluded from the multivariate models.
Statistically significant (p<0.05) difference compared to Black workers based on weighted regression.
Statistically significant (p<0.05) difference compared to Latino workers based on weighted regression
Statistically significant (p<0.05) difference compared to White workers based on weighted regression
SD=Standard deviation.
Notes: Proportions (%) and means are weighted using Panel Study of Income Dynamics survey weights. Number of proxy respondents and weighted proportion within each group: In overall sample: 2,857, 35.01%. Among Black respondents: 2,034, 22.39%. Among White respondents: overall: 1,818, 39.18%; Hispanic/Latino: 337, 36.49%. Comparison across racial/ethnic categories completed for average count of working conditions, not for each count value.
Working conditions by race/ethnicity and in relation to self-rated health: Path Models
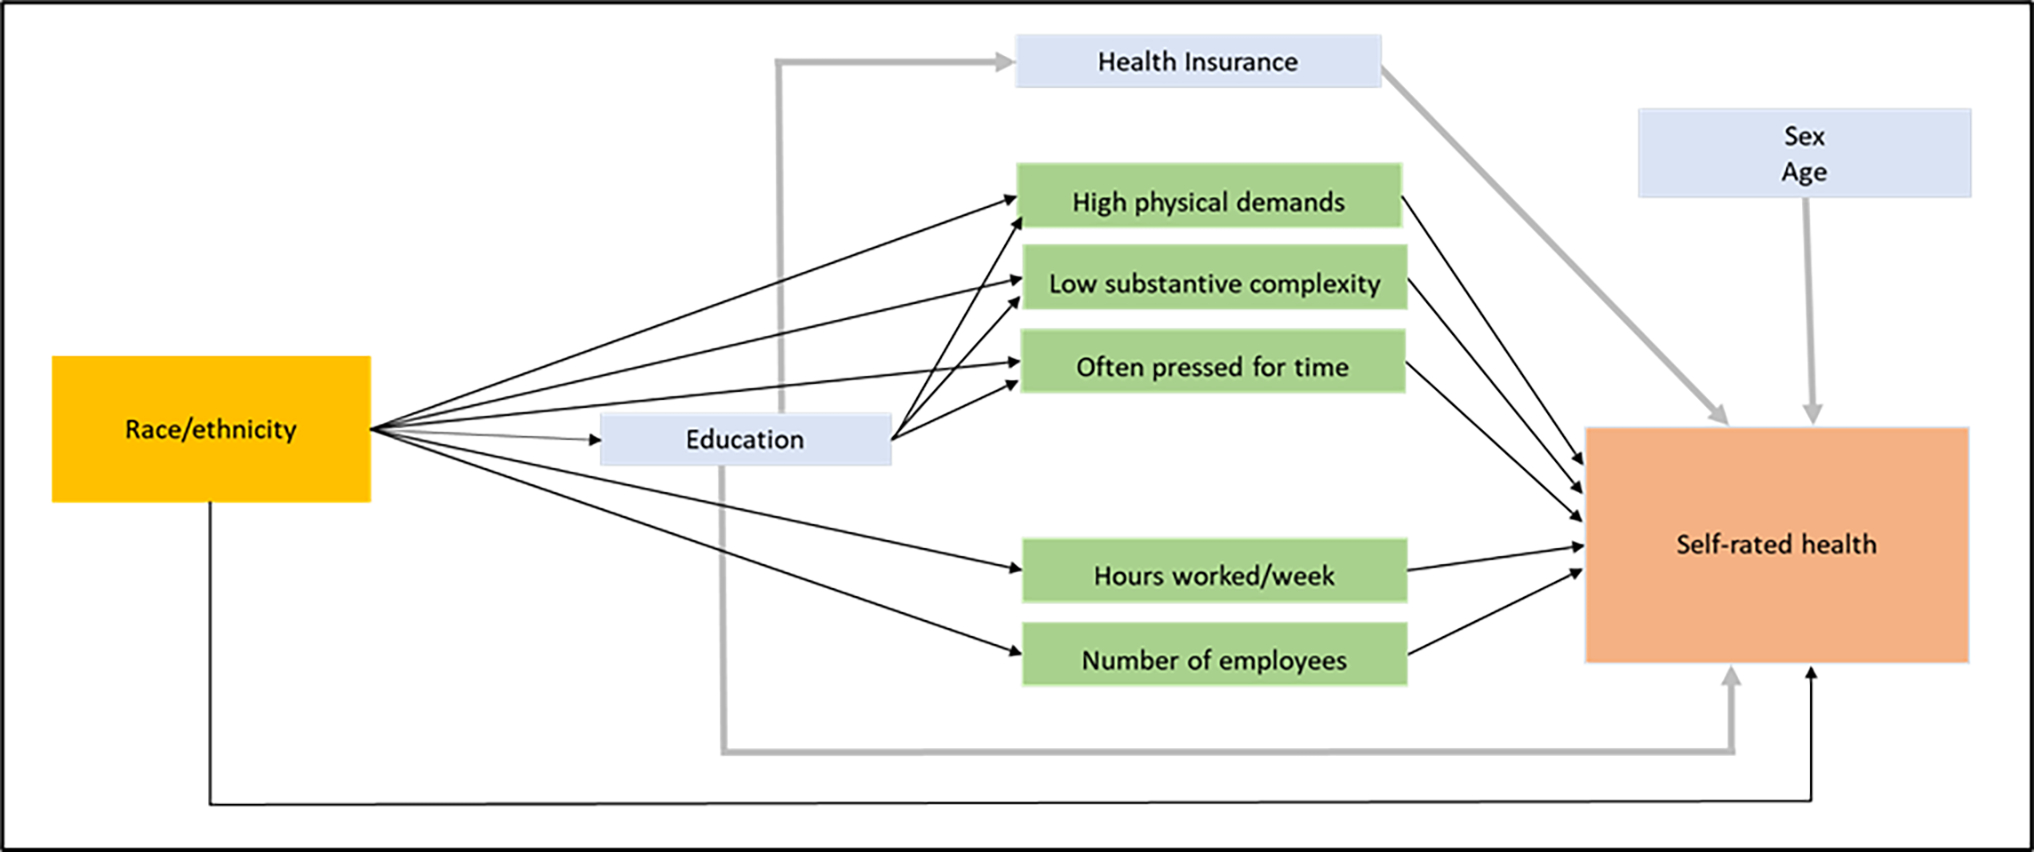
We used path analysis to understand how working conditions vary by race/ethnicity, whether they predict incident poor self-rated health, and whether they mediate racial differences in self-rated health. Path analysis, a type of structural equation modeling, is commonly used to study mediation.36 Our full path models (Figure 1) posit that race leads to differential exposure to the five working conditions – high physical demands, low substantive complexity, often pressed for time, hours worked per week, establishment size – and those in turn influence self-rated health. With respect to the control variables, the models imply that educational attainment partially mediates exposure to certain working conditions, and that educational attainment can be directly related to self-rated health independent of working conditions. Additionally, educational attainment is associated with health insurance, which in turn can also influence self-rated health. Sex and age are additional predictors of self-rated health. We tested for interaction terms among working conditions and sociodemographic variables; we did not include those interactions in the final models because none reached statistical significance.
Figure 1. Path models depicting racial and ethnic differences in working connections and association with self-rated health.
To simplify the comparisons, we created one full model that compares Black and White workers, and a second that compares Latino and White workers. A third full model, shown in the Supplemental Tables, compares Latino and Black workers. To understand the relationships between race/ethnicity, working conditions, and self-rated health, we examined the coefficients for the paths linking race to each working condition and then to incident poor self-rated health. Figure 2 shows the statistically significant (p<0.05) paths pertinent to the research questions, and we describe the significant pathways in the text. All coefficients from the path models are shown in Table S3. Because nearly all variables in the path models were binary, paths were modeled using a logit link function; the coefficients were exponentiated to produce odds ratios (ORs).
Figure 2. Working conditions and racial disparities in incident poor self-rated health: Black and White workers (n=6,502).
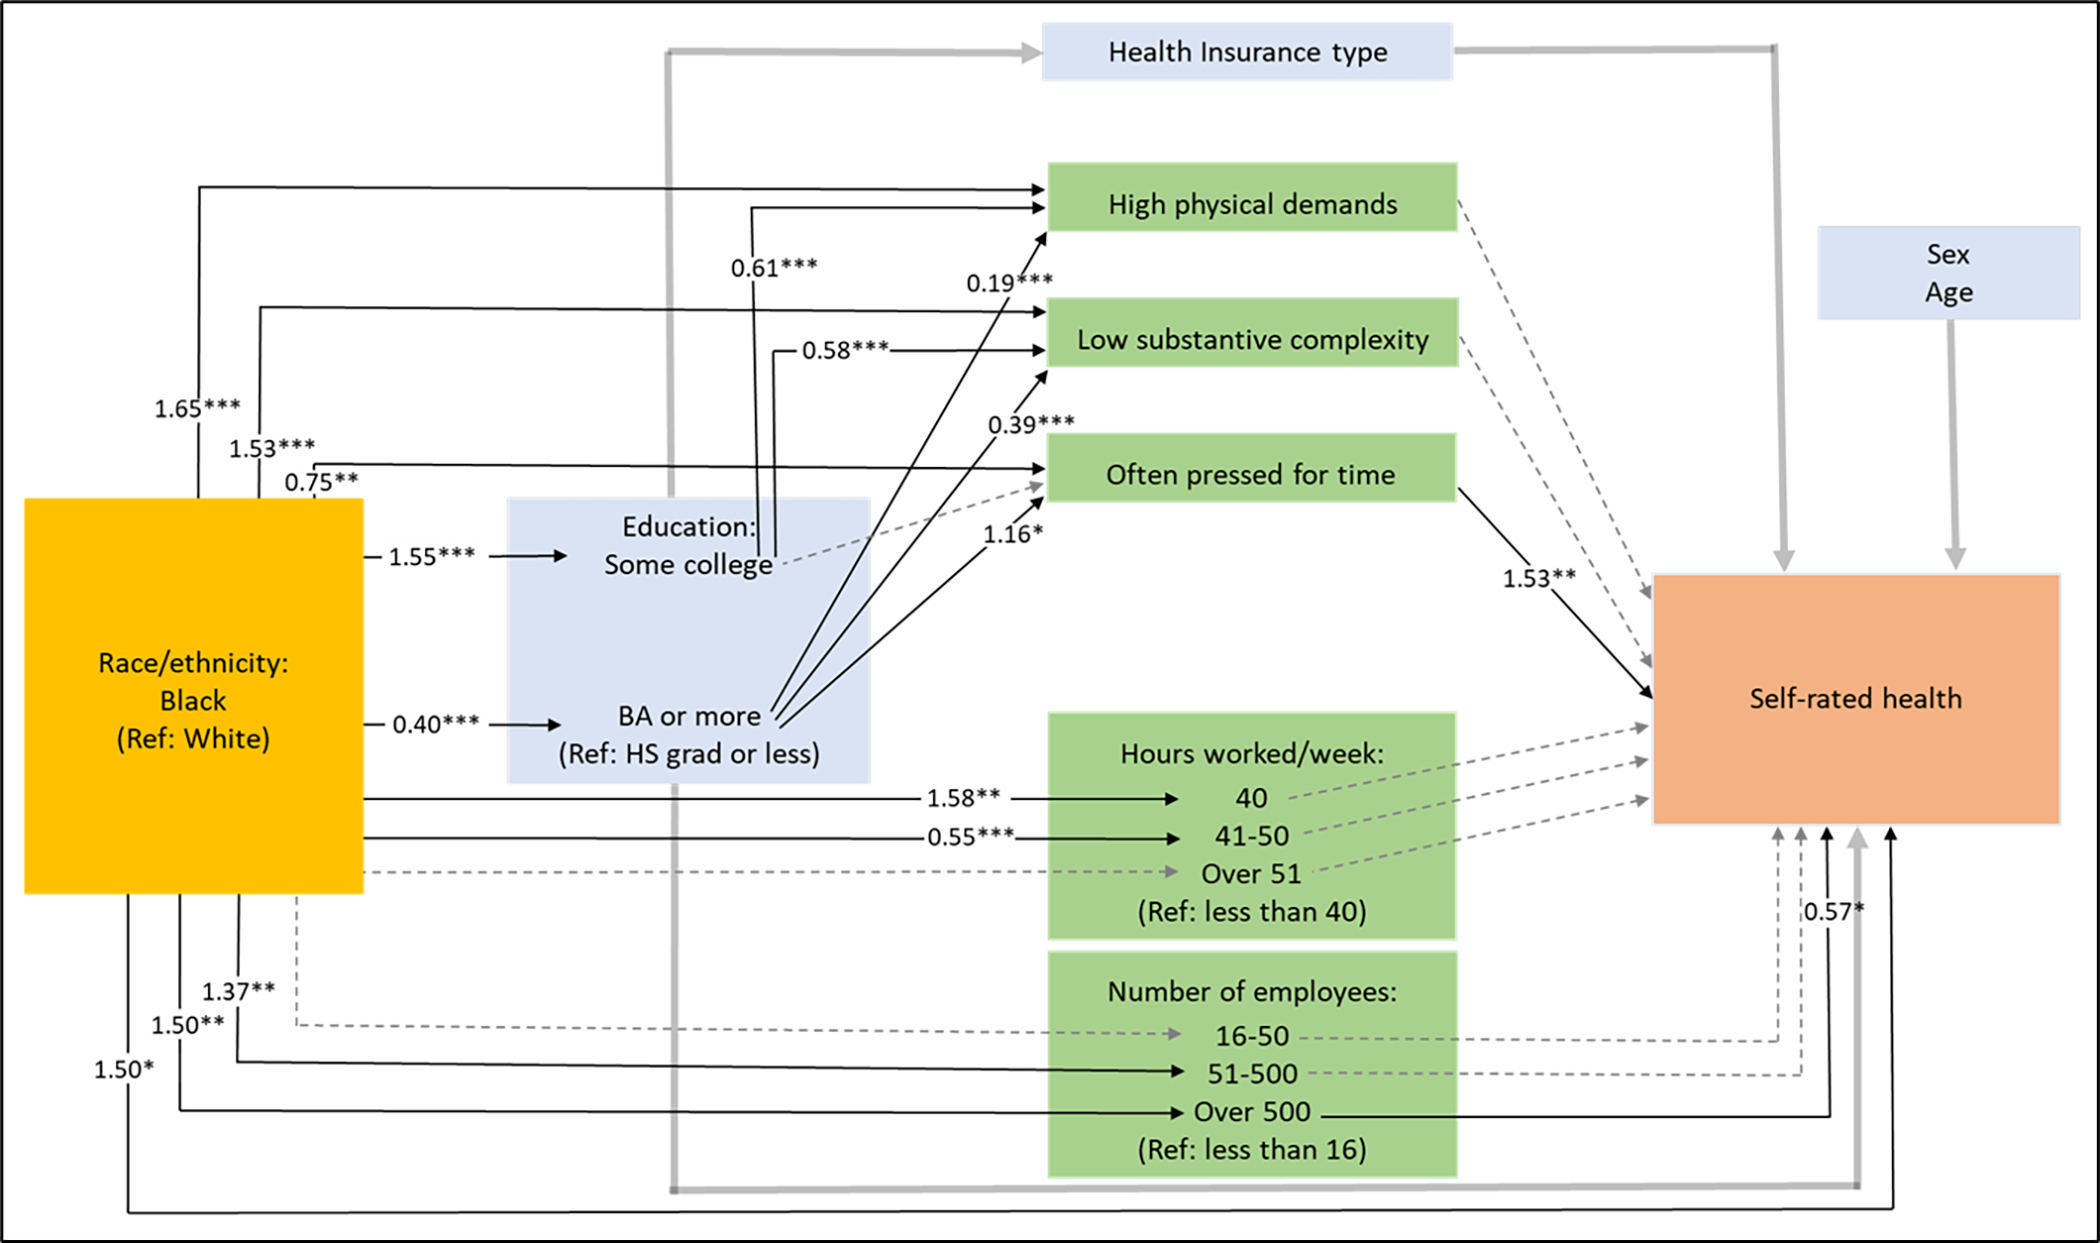
Odds ratios (ORs) from path model. *p<0.05 **p<0.01 ***p<0.001. Only ORs that were statistically significant (p<0.05) and connected to working conditions are shown. Direct path from black compared to white and self-rated health also included.
 Dashed grey line: non-statistically significant paths to/from working conditions.
 Thick grey lines: paths to/from control variables that are not reported in detail.
Working conditions as mediators: Direct and indirect effects
We assessed whether working conditions mediated racial/ethnic differences in self-rated health by calculating direct and indirect effects. This was done using a set of simplified path models including only the working conditions that varied significantly by race/ethnicity in the aforementioned full path models. Direct path estimates came from the path connecting race and self-rated health, independent of the other variables in the model. Indirect path estimates were the product of race to each working condition, then that working condition to self-rated health. Statistically significant indirect paths could indicate significant mediation effects. This is a common approach to calculating direct and indirect effects.19,37
Data analysis was conducted using Stata 17. PSID survey weights were used in all analyses. This study was determined exempt from further review by the University of Michigan Institutional Review Board.
Results
Descriptive statistics
In 2019, 13% of the n=8439 analytic sample had poor self-rated health; this proportion was significantly higher among Black (17%) and Latino respondents (18%) compared to White respondents (11%).
The largest racial/ethnic subgroups in the sample based on weighted proportions were White (70%), followed by Hispanic/Latino (14%), and Black (10%). Average age was 45 years; the sample was 48% female and 52% male. Roughly one third of the workers had a high school diploma or less; this proportion was significantly higher among Black and Latino respondents (43% and 54% respectively) than White respondents (31%). The majority of the sample had health insurance, most commonly employer-provided. There were significant differences in the proportion of uninsured workers: Latino respondents were the most likely to not have health insurance (25%), followed by Black (14%) and then White (6%) respondents.
Regarding working conditions, Black and Latino workers were more likely than White workers to experience high physical demands (45% and 36% compared to 29%, respectively) and low substantive complexity (40% and 45% compared to 29%). White and Latino workers were more likely to be pressed for time (47% in both) than Black workers (40%). Regarding long work hours, Black workers were the most likely of the three groups to work over 50 hours, but the differences did not reach statistical significance. White workers were more likely to work 41–50 hours (27% compared to 17% for Black and for Latino workers). Regarding establishment size, Latino workers were least likely to work in an establishment with over 500 employees (8% compared to 17% for Black workers and 13% for White workers).
The majority of workers reported being exposed to at least one unhealthy working condition. Overall, 36% reported one unhealthy condition, 32% reported 2 conditions, and smaller proportions reported 3, 4 or 5 conditions. Latino workers reported, on average, the most unhealthy working conditions (1.73), followed by Black workers (1.60), then White workers (1.55).
After excluding n=949 individuals (11%) with poor health in 2017, a sample of 7,490 remained to model incident poor health. Descriptive statistics for the n=7,490 sample are shown in Table S1. Compared to the n=8,349 sample (Table 1) that includes those with poor health in 2017, the n=7,490 sample (Table S1) has a similar overall sex and racial/ethnic breakdown, a smaller proportion of respondents with poor health in 2019, is slightly younger, and has at most minor differences (2 percentage points or less) in educational attainment, health insurance type and working conditions.
The polychoric correlation between poor self-rated health in 2017 and in 2019 was 0.74. Aside from that, all polychoric correlations were below |0.45|. The highest correlations were between educational attainment and high physical demands (−0.44), low substantive complexity and often pressed for time (−0.39), and educational attainment and low substantive complexity (−0.32).
Working conditions by race/ethnicity and in relation to self-rated health: Path Models
1). Black and White workers
The first path model, shown in Figure 2, compared the n=6,502 respondents who identified as either Black or White. In this model, there were significant paths leading from Black compared to White race to nearly all of the working conditions. Black workers were more likely to be exposed to high physical demands and low substantive complexity. White workers more likely to be pressed for time. Lastly, Black workers were significantly more likely to work 40 hours per week, and less likely to work 41 to 50 hours, compared to White workers. Black workers were also significantly more likely to work in large establishments compared to White workers.
In addition to paths directly linking race to each working condition, the model included paths linking race to education, then education to working conditions. Black respondents were more likely than White respondents to report having some college (versus high school graduation or less) and less likely than White respondents to have a bachelor’s degree. In turn, workers with some college were less likely than those with only a high school diploma to have high physical demands and low substantive complexity. Workers with a bachelor’s degree had even lower odds of high physical demands and low substantive complexity, but significantly higher odds of time pressure.
Two statistically significant paths emerged that linked working conditions with incident poor self-rated health. Being often pressed for time was associated with 53% higher odds of incident poor health, and working for a very large establishment (over 500 employees) was associated with 43% lower odds of incident poor health. There remained a significant direct relationship between race and self-rated health such that after accounting for the other variables in the model, Black workers still had 50% higher odds of having incident poor self-rated health than White workers. (See the supplemental table for details for health insurance, sex and age).
2). White and Latino workers
A second path model (Figure 3) estimated relationships among working conditions and incident poor self-rated health for a sample of n=5,016 White and Latino working adults. Latino respondents were significantly more likely than White respondents to experience low substantive complexity, to work 40 hours per week (compared to less than 40), and significantly less likely to work for a very large establishment (over 500 employees).
Figure 3. Working conditions and racial disparities in incident poor self-rated health: Latino and White workers (n=5,016).
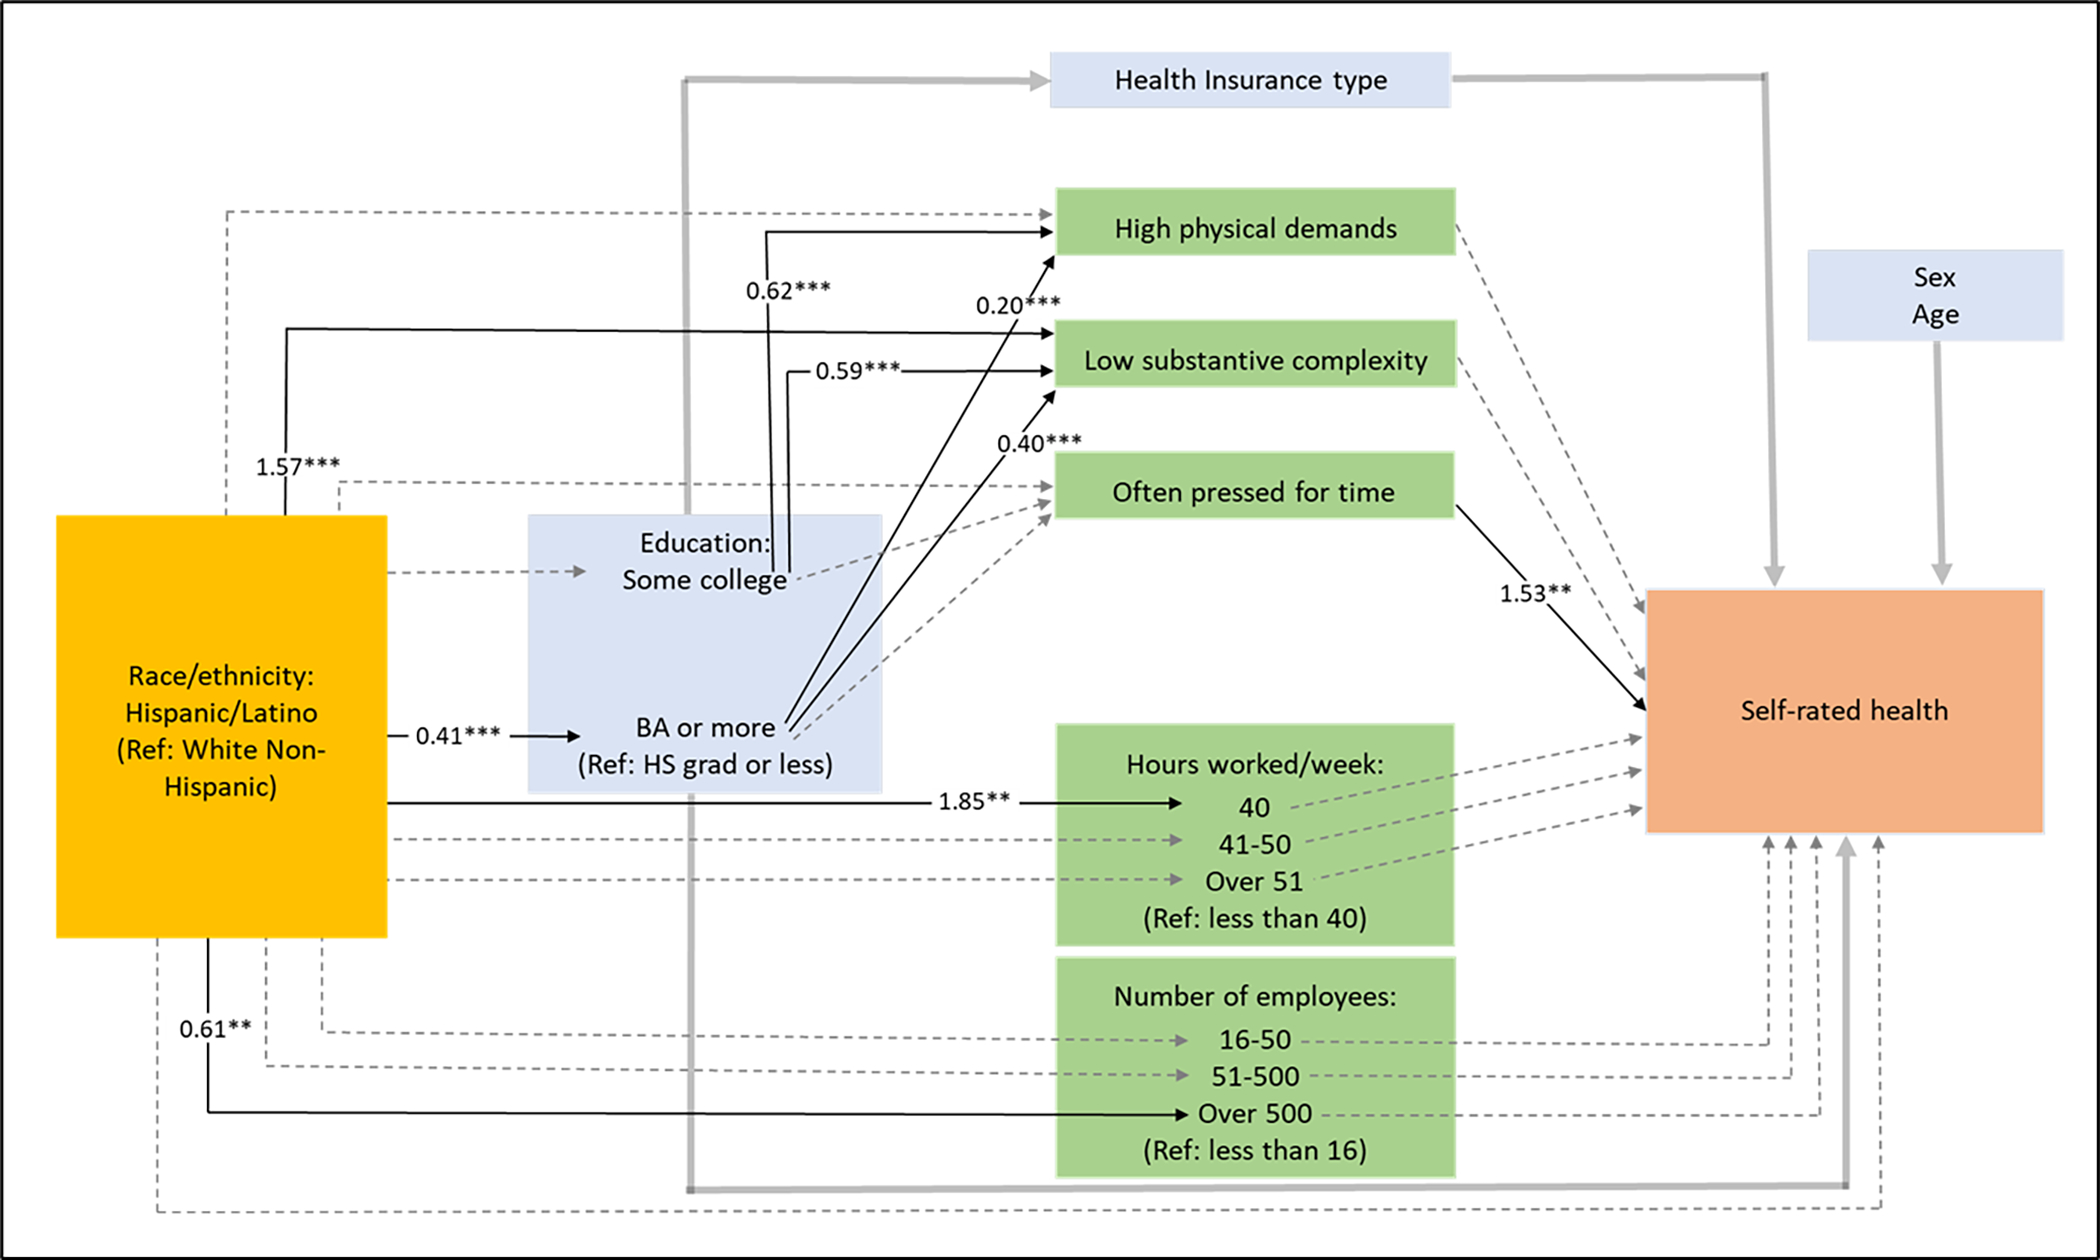
Odds ratios (ORs) from path model. *p<0.05 **p<0.01 ***p<0.001. Only ORs that were statistically significant (p<0.05) and connected to working conditions are shown. Direct path from Hispanic/Latino compared to White and self-rated health also included.
Dashed grey line: non-statistically significant paths to/from working conditions.
Thick grey lines: paths to/from control variables that are not reported in detail
For the paths going through educational attainment, in this model there was no significant difference for Latino compared to White respondents who obtained “some college.” However, Latino respondents were significantly less likely than White respondents to have a bachelor’s degree. Higher educational attainment was associated with less likelihood of high physical demands and low substantive complexity, with higher magnitude ORs observed for those with bachelor’s degree.
In this model, only one path from working conditions to incident poor self-rated health was significant – those who were often pressed for time had 53% higher odds of poor health. There was no significant direct path from White compared to Latino race/ethnicity to self-rated health.
3). Black compared to Latino workers
In the third model we compared 3,010 Black and Latino workers. Black workers were significantly more likely to have high physical demands compared to Latino workers. Black workers had more than twice the odds of Latino workers to work for a very large establishment. Black workers were more likely than Latino workers to have “some college” compared to only high school, but the difference in odds of obtaining a bachelor’s degree was not significant. Like in the models above, the third model showed that higher educational attainment was associated with lower odds of exposure to high physical demands and low substantive complexity, with a higher magnitude relationship (larger ORs) for having a bachelor’s degree. As in the models above, time pressure was associated with higher odds of poor health (OR=1.70). Low substantive complexity was also associated with nearly twice the odds of poor health (Results shown in Table S3).
Working conditions as mediators: Direct and indirect effects
We calculated indirect effects to identify significant pathways connecting race/ethnicity, working conditions and self-rated health; these were calculated specifically for each educational attainment level. None of the indirect effects for the working conditions reached statistical significance.
Discussion
We used path modeling with nationally representative panel survey data to examine how five working conditions – high physical demands, low substantive complexity, time pressure, long working hours and establishment size – differed by race/ethnicity and related to incident poor self-rated health. Black, Latino and White workers were, on average, exposed to distinct sets of adverse and protective working conditions. For instance, even after controlling for educational attainment and other variables, Black workers were more likely than White or Latino workers to experience high physical demands. Both Black and Latino workers were significantly more likely than White workers to be exposed to low substantive complexity. Black workers were more likely to work for large establishments, which is a protective factor, while Latino workers were less likely. Latino workers were exposed to, on average, more unhealthy working conditions compared to Black and White workers. White workers had higher odds of time pressure, but less exposure to low substantive complexity.
Time pressure at work predicted poor incident self-rated health in all three full path models. Low substantive complexity predicted poor health in one model (Black compared to Latino workers), while working for a large establishment was protective in another (Black compared to White workers).
We found no evidence that working conditions mediated the relationship between race/ethnicity and self-rated health. There were no significant indirect effects linking race/ethnicity to poor incident health by way of any of the five working conditions.
Racial disparities in working conditions were intertwined with educational attainment. Higher educational attainment predicted healthier working conditions and better self-rated health, except that those with bachelor’s degrees were more likely to be pressed for time per one model.
Our findings align with research by Fujishiro et al and Meyer et al, who found that Black and Latino workers were exposed to lower substantive complexity at work relative to White workers; like those studies, our study found that low substantive complexity predicted worse health outcomes, although this was only the case in one of our three models.19,22 Unlike the individual-level measures in the present study, the studies by Fujishiro and by Meyer both employed occupation-level estimates of working conditions. Further, in contrast to a finding by Alterman and colleagues that White workers were more likely to work long hours (both 48 and above and 60 hours and above),20 our findings were mixed, with White workers less likely than Black workers to work 41 to 50 hours per week, but no significant differences for likelihood of working beyond 50 hours. Like Earle and colleagues’ study of working parents, we also found Black Americans were more likely to work for large companies, while Latino parents were the least likely.21
McCluney et al found that an adverse psychosocial work environment, measured using a composite indicator covering topics like autonomy and supportive management and asked directly of respondents, was more common among Black than White workers, but did not mediate racial differences in self-rated health.23 This parallels our finding, although we used five working conditions variables rather than a composite measure. McCluney and colleagues point to the importance of distinguishing between perceived, or self-reported, work environment from occupation-level measures of work environment, as they found that occupation-level measures did mediate racial differences in self-rated health.23
Strengths and limitations
We examined working conditions in connection to racial and ethnic differences in self-rated health. Self-rated health is an informative, subjective measure that can encompass physical as well as mental health. Importantly, the measure is less valid for Hispanic/Latino and Black adults than for White adults.35,38,39 The working condition that most consistently predicted self-rated health across our models, time pressure, is one that disproportionately affects White workers. Using self-rated health as an outcome may have meant our analysis was better able to capture work-related health impacts among White workers than Black workers and Latino workers. However, in our longitudinal study, we examine incident poor self-rated health; by focusing on within-person changes in self-rated health over time, rather than cross-sectional differences, we reduce the risk of bias due to differences in measure validity across groups. Also, self-rated health may better capture salutogenic pathways as opposed to pathogenic ones,8 which would be a limitation here given our focus on unhealthy working conditions. Future research should assess whether working conditions mediate racial/ethnic disparities in more objective and specific health measures such as cardiovascular outcomes, physical function or mental health outcomes.
The exposure measures in our study come from single questionnaire items; such measures may be less precise than multi-item scales and may reduce our ability to detect a significant relationship with self-related health. However, an advantage of the measures is that they capture individual reports rather than occupation-level estimates of working conditions. Also, some working conditions variables can relate to health in a non-linear way, and this may have factored into the limited association with self-rated health. For example, high physical demands can be harmful,40,41 but low physical demands may increase obesity risk.42 Also, while we did not find significant interactions, the impact of working conditions on health may also be moderated by other variables, e.g., high physical demands by age and physical ability.43 Our measure of physical demands captured any type of physical effort for extended time, but a measure that emphasizes more specific ergonomic risk factors like kneeling, lifting or climbing44 may have related more strongly to self-rated health.
This study used a longitudinal design to predict incident poor self-rated health. This helped reduce bias from reverse causality – that is, that individuals with worse health may take jobs with worse working conditions. However, like any study that only includes a sample of working people, there is a potential for bias due to the healthy worker effect, or selection into employment. Also, we used data that are recent but pre-date the COVID-19 pandemic, during which working conditions changed dramatically, if temporarily, for many American workers.45
We used path analysis, a type of structural equation modeling. Using path models rather than regression enabled us to include multiple working conditions and account for their interrelationships. Further, our path models included educational attainment as not just a control variable but also a mediator between race/ethnicity and working conditions. Vanderweele notes that using this approach to assess multiple mediators, as in this case, is difficult because of the strong assumptions required for variables in the model. Results are best used for generating new hypotheses.46 In the present study, path analysis allowed for the estimation of paths between race/ethnicity, multiple working conditions, and self-rated health within a single model, as well as calculations of direct and indirect effects (the latter were not statistically significant.) We used survey weights so that these estimates would better approximate the US working population.
This study offers working conditions and health outcomes comparisons for Black, Latino and White workers. Future work should integrate American Indian/Native American workers, Asian American workers and other groups who may have distinct working conditions exposures. Future research should also examine intersections between race/ethnicity, gender and other identities.47 There are numerous other work-related experiences that we could not capture but that merit further study: how working conditions interact with similar exposures, like time pressure, at home,48 perceived job discrimination, which was shown to negatively impact self-rated health among Black workers,49 and the ways that workers buffer themselves against unhealthy working conditions, like through social support50 and other coping strategies.51
The framework described here can be applied to other health outcomes to better understand how the clear inequities in exposure to health-relevant working conditions are shaping health outcomes. Many of the working conditions studied, including unhealthy psychosocial work environment, are amenable to change through different management approaches and/or policies.52,53
Supplementary Material
CME learning objectives.
Explain how working conditions relate to racial and ethnic health inequities
Outline common unhealthy working conditions and how they vary among Black, White and Latino adults in the United States
Funding Sources:
This work was supported in part by an NIA training grant to the Population Studies Center at the University of Michigan, T32 AG000 221.
The authors gratefully acknowledge use of the services and facilities of the Population Studies Center at the University of Michigan, funded by NICHD Center Grant P2CHD041028.
The collection of data used in this study was partly supported by the National Institutes of Health under grant number R01 HD069609 and R01 AG040213, and the National Science Foundation under award numbers SES 1157698 and 1623684.
Footnotes
Conflict of Interest for ALL Authors:
NONE DECLARED.
Ethical Considerations & Disclosure(s)
This study was determined exempt from further review by the University of Michigan’s Institutional Review Board.
References
- 1.Singh GK, Daus GP, Allender M, et al. Social determinants of health in the United States: addressing major health inequality trends for the nation, 1935–2016. Int J MCH AIDS. 2017;6(2):139. [DOI] [PMC free article] [PubMed] [Google Scholar]
- 2.Yudell M, Roberts D, DeSalle R, Tishkoff S. Taking race out of human genetics. Science. 2016;351(6273):564–565. [DOI] [PubMed] [Google Scholar]
- 3.Bailey ZD, Krieger N, Agénor M, Graves J, Linos N, Bassett MT. Structural racism and health inequities in the USA: evidence and interventions. Lancet. 2017;389(10077):1453–1463. [DOI] [PubMed] [Google Scholar]
- 4.Williams DR, Mohammed SA, Leavell J, Collins C. Race, socioeconomic status, and health: complexities, ongoing challenges, and research opportunities. Ann N Y Acad Sci. 2010;1186(1):69–101. [DOI] [PMC free article] [PubMed] [Google Scholar]
- 5.Benjamins MR, Hirschman J, Hirschtick J, Whitman S. Exploring differences in self-rated health among Blacks, Whites, Mexicans, and Puerto Ricans. Ethn Health. 2012;17(5):463–476. [DOI] [PubMed] [Google Scholar]
- 6.Schoenborn C, Heyman K. Health characteristics of adults aged 55 years and over: United States, 2004–2007. In: 16 Nesrn, ed. Hyattsville, MD: National Center for Health Statistics; 2009. [PubMed] [Google Scholar]
- 7.Hays RD, Spritzer KL, Thompson WW, Cella D. U.S. General Population Estimate for “Excellent” to “Poor” Self-Rated Health Item . J Gen Intern Med. 2015;30(10):1511–1516. [DOI] [PMC free article] [PubMed] [Google Scholar]
- 8.Bopp M, Braun J, Gutzwiller F, Faeh D, Group SNCS. Health risk or resource? Gradual and independent association between self-rated health and mortality persists over 30 years. PLoS One. 2012;7(2):e30795. [DOI] [PMC free article] [PubMed] [Google Scholar]
- 9.Krieger N Methods for the scientific study of discrimination and health: an ecosocial approach. Am J Public Health. 2012;102(5):936–944. [DOI] [PMC free article] [PubMed] [Google Scholar]
- 10.Ahonen EQ, Fujishiro K, Cunningham T, Flynn M . Work as an inclusive part of population health inequities research and prevention. Am J Public Health. 2018;108(3):306–311. [DOI] [PMC free article] [PubMed] [Google Scholar]
- 11.Pager D, Shepherd H. The sociology of discrimination: Racial discrimination in employment, housing, credit, and consumer markets. Annu Rev Sociol. 2008;34:181–209. [DOI] [PMC free article] [PubMed] [Google Scholar]
- 12.Tomaskovic-Devey D, Thomas M, Johnson K. Race and the accumulation of human capital across the career: A theoretical model and fixed-effects application. Am J Sociol. 2005;111(1):58–89. [Google Scholar]
- 13.Wrigley-Field E, Seltzer N. Unequally Insecure: Rising Black/White Disparities in Job Displacement, 1981–2017. Washington Center for Equitable Growth Working Paper Series Washington, DC. 2020. [Google Scholar]
- 14.Eisenberg-Guyot J, Prins SJ, Muntaner C. Free agents or cogs in the machine? Classed, gendered, and racialized inequities in hazardous working conditions. Am J Ind Med. 2022;65(2):92–104. [DOI] [PMC free article] [PubMed] [Google Scholar]
- 15.Shannon CA, Rospenda KM, Richman JA, Minich LM. Race, racial discrimination, and the risk of work-related illness, injury, or assault: findings from a national study. J Occup Environ Med. 2009;51(4):441–448. [DOI] [PMC free article] [PubMed] [Google Scholar]
- 16.Herbert R, Landrigan PJ. Work-related death: a continuing epidemic. Am J Public Health. 2000;90(4):541–545. [DOI] [PMC free article] [PubMed] [Google Scholar]
- 17.United States Department of Labor Bureau of Labor Statistics. Labor force characteristics by race and ethnicity, 2020. Washington DC. 2021. [Google Scholar]
- 18.United States Department of Labor Bureau of Labor Statistics. Survey of Occupational Injuries and Illnesses Data. Detailed occupation by selected events or exposures. 2021. [Google Scholar]
- 19.Fujishiro K, Hajat A, Landsbergis PA, Meyer JD, Schreiner PJ, Kaufman JD. Explaining racial/ethnic differences in all-cause mortality in the Multi-Ethnic Study of Atherosclerosis (MESA): Substantive complexity and hazardous working conditions as mediating factors. SSM Popul Health. 2017;3:497–505. [DOI] [PMC free article] [PubMed] [Google Scholar]
- 20.Alterman T, Luckhaupt SE, Dahlhamer JM, Ward BW, Calvert GM . Prevalence rates of work organization characteristics among workers in the U.S.: Data from the 2010 National Health Interview Survey. Am J Ind Med. 2013;56(6):647–659. [DOI] [PMC free article] [PubMed] [Google Scholar]
- 21.Earle A, Joshi P, Geronimo K, Acevedo-Garcia D. Job characteristics among working parents: differences by race, ethnicity, and nativity. Monthly Labor Rev. 2014;137:1. [Google Scholar]
- 22.Meyer JD, Warren N, Reisine S. Racial and ethnic disparities in low birth weight delivery associated with maternal occupational characteristics. Am J Ind Med. 2010;53(2):153–162. [DOI] [PMC free article] [PubMed] [Google Scholar]
- 23.McCluney CL, Schmitz LL, Hicken MT, Sonnega A. Structural racism in the workplace: Does perception matter for health inequalities? Soc Sci Med. 2018;199:106–114. [DOI] [PMC free article] [PubMed] [Google Scholar]
- 24.Kimbro RT, Bzostek S, Goldman N, Rodríguez G. Race, ethnicity, and the education gradient in health. Health Aff. 2008;27(2):361–372. [DOI] [PubMed] [Google Scholar]
- 25.Hill TD, Needham BL. Gender-specific trends in educational attainment and self-rated health, 1972–2002. Am J Public Health. 2006;96(7):1288–1292. [DOI] [PMC free article] [PubMed] [Google Scholar]
- 26.Link BG, Susser ES, Factor-Litvak P, et al. Disparities in self-rated health across generations and through the life course. Soc Sci Med. 2017;174:17–25. [DOI] [PMC free article] [PubMed] [Google Scholar]
- 27.Buchmueller TC, Levinson ZM, Levy HG, Wolfe BL. Effect of the Affordable Care Act on racial and ethnic disparities in health insurance coverage. Am J Public Health. 2016;106(8):1416–1421. [DOI] [PMC free article] [PubMed] [Google Scholar]
- 28.Finkelstein A, Taubman S, Wright B, et al. The Oregon Health Insurance Experiment: Evidence from the first year. Q J Econ. 2012;127(3):1057–1106. [DOI] [PMC free article] [PubMed] [Google Scholar]
- 29.Andrasfay T, Raymo N, Goldman N, Pebley AR. Physical work conditions and disparities in later life functioning: Potential pathways. SSM Popul Health. 2021;16:100990. [DOI] [PMC free article] [PubMed] [Google Scholar]
- 30.Berchick ER, Barnett JC, Upton RD. Current Population Reports, P60–267(RV), Health Insurance Coverage in the United States: 2018. Washington, DC: U.S. Census Bureau;2019. [Google Scholar]
- 31.Panel Study of Income Dynamics, public use dataset. Produced and distributed by the Survey Research Center, Institute for Social Research, University of Michigan, Ann Arbor, MI. Accessed June 15, 2020. [Google Scholar]
- 32.Johnson D, McGonagle K, Freedman V, Sastry N. Fifty Years of the Panel Study of Income Dynamics: Past, Present, and Future. Ann Am Acad Pol Soc Sci. 2018;680(1):9–28. [DOI] [PMC free article] [PubMed] [Google Scholar]
- 33.Peckham T, Fujishiro K, Hajat A, Flaherty B, Seixas N. Evaluating employment quality as a determinant of health in a changing labor market. RSF. 2019;5:258–281. [DOI] [PMC free article] [PubMed] [Google Scholar]
- 34.Ford CL, Airhihenbuwa CO. Critical Race Theory, race equity, and public health: toward antiracism praxis. Am J Public Health. 2010;100 Suppl 1(Suppl 1):S30–S35. [DOI] [PMC free article] [PubMed] [Google Scholar]
- 35.Erving CL, Zajdel R. Assessing the validity of self-rated health across ethnic groups: implications for health disparities research. J Racial Ethn Health Disparities. 2022;9(2):462–477. [DOI] [PubMed] [Google Scholar]
- 36.Preacher KJ, Hayes AF. Asymptotic and resampling strategies for assessing and comparing indirect effects in multiple mediator models. Behav Res Methods. 2008;40(3):879–891. [DOI] [PubMed] [Google Scholar]
- 37.Ro A, Bostean G. Duration of US stay and body mass index among Latino and Asian immigrants: A test of theoretical pathways. Soc Sci Med. 2015;144:39–47. [DOI] [PubMed] [Google Scholar]
- 38.Santos-Lozada AR, Howard JT. Using allostatic load to validate self-rated health for racial/ethnic groups in the United States. Biodemography Soc Biol. 2018;64(1):1–14. [DOI] [PubMed] [Google Scholar]
- 39.Assari S, Lankarani MM, Burgard S. Black–white difference in long-term predictive power of self-rated health on all-cause mortality in United States. Ann Epidemiol. 2016;26(2):106–114. [DOI] [PMC free article] [PubMed] [Google Scholar]
- 40.Widanarko B, Legg S, Stevenson M, et al. Prevalence of musculoskeletal symptoms in relation to gender, age, and occupational/industrial group. Int J Ind Ergon. 2011;41(5):561–572. [Google Scholar]
- 41.Smith PM, Mustard CA. Examining the associations between physical work demands and work injury rates between men and women in Ontario, 1990–2000. Occup Environ Med. 2004;61(9):750–756. [DOI] [PMC free article] [PubMed] [Google Scholar]
- 42.Choi B, Schnall PL, Yang H, et al. Sedentary work, low physical job demand, and obesity in US workers. Am J Ind Med. 2010;53(11):1088–1101. [DOI] [PubMed] [Google Scholar]
- 43.Fraade-Blanar LA, Sears JM, Chan KC, Thompson HJ, Crane PK, Ebel BE . Relating older workers’ injuries to the mismatch between physical ability and job demands. J Occup Environ Med. 2017;59(2):212–221. [DOI] [PMC free article] [PubMed] [Google Scholar]
- 44.Hulshof CTJ, Pega F, Neupane S, et al. The prevalence of occupational exposure to ergonomic risk factors: A systematic review and meta-analysis from the WHO/ILO Joint Estimates of the Work-related Burden of Disease and Injury. Environ Int. 2021;146:106157. [DOI] [PubMed] [Google Scholar]
- 45.International Labour Organization (ILO) Monitor. COVID-19 and the world of work. Third edition. Updated estimates and analysis. 2020; 1–23. [Google Scholar]
- 46.VanderWeele TJ. Mediation analysis: a practitioner’s guide. Annual review of public health. 2016;37:17–32. [DOI] [PubMed] [Google Scholar]
- 47.Crenshaw K Demarginalizing the intersection of race and sex: A black feminist critique of antidiscrimination doctrine, feminist theory and antiracist politics. U Chi Legal F. 1989:139. [Google Scholar]
- 48.Otterbach S, Tavener M, Forder P, Powers J, Loxton D, Byles J. The effect of motherhood and work on women’s time pressure: A cohort analysis using the Australian Longitudinal Study on Women’s Health. Scand J Work Environ Health. 2016:500–509. [DOI] [PubMed] [Google Scholar]
- 49.Meyer JD. Race-based job discrimination, disparities in job control, and their joint effects on health. Am J Ind Med. 2014;57(5):587–595. [DOI] [PubMed] [Google Scholar]
- 50.Karasek RA, Triantis KP, Chaudhry SS. Coworker and supervisor support as moderators of associations between task characteristics and mental strain. J Occup Behav. 1982;3(2):181–200. [Google Scholar]
- 51.Hasbrouck MA, Waddimba AC. The work-related stressors and coping strategies of group-employed rural health care practitioners: A qualitative study. Am J Ind Med. 2017;60(10):867–878. [DOI] [PubMed] [Google Scholar]
- 52.Imamura K, Asai Y, Watanabe K, et al. Effect of the National Stress Check Program on mental health among workers in Japan: A 1-year retrospective cohort study. J Occup Health. 2018;60(4):298–306. [DOI] [PMC free article] [PubMed] [Google Scholar]
- 53.Moen P, Kelly EL, Tranby E, Huang Q. Changing work, changing health: can real work-time flexibility promote health behaviors and well-being? J Health Soc Behav. 2011;52(4):404–429. [DOI] [PMC free article] [PubMed] [Google Scholar]
Associated Data
This section collects any data citations, data availability statements, or supplementary materials included in this article.