

Abstract
Objective:
In Alzheimer’s disease, hyperphosphorylated tau is associated with formation of insoluble paired helical filaments that aggregate as neurofibrillary tau tangles and are associated with neuronal loss and cognitive symptoms. Dual orexin receptor antagonists decrease soluble amyloid-β levels and amyloid plaques in mouse models over-expressing amyloid-β, but have not been reported to affect tau phosphorylation. In this randomized controlled trial, we tested the acute effect of suvorexant, a dual orexin receptor antagonist, on amyloid-β, tau, and phospho-tau.
Methods:
Thirty-eight cognitively unimpaired participants aged 45–65 years were randomized to placebo (N=13), suvorexant 10 mg (N=13), and suvorexant 20 mg (N=12). Six milliliters of cerebrospinal fluid was collected via an indwelling lumbar catheter every 2 hours for 36 hours starting at 20:00. Participants received placebo or suvorexant at 21:00. All samples were processed and measured for multiple forms of amyloid-β, tau, and phospho-tau via immunoprecipitation and liquid chromatography-mass spectrometry.
Results:
The ratio of phosphorylated-tau-threonine-181 to unphosphorylated-tau-threonine-181, a measure of phosphorylation at this tau phosphosite, decreased ~10–15% in participants treated with suvorexant 20 mg compared to placebo. However, phosphorylation at tau-serine-202 and tau-threonine-217 were not decreased by suvorexant. Suvorexant decreased amyloid-β ~10–20% compared to placebo starting 5 hours after drug administration.
Interpretation:
In this study, suvorexant acutely decreased tau phosphorylation and amyloid-β concentrations in the central nervous system. Suvorexant is approved by the Food and Drug Administration to treatment insomnia and may have potential as a repurposed drug for the prevention of Alzheimer’s disease, however future studies with chronic treatment are needed.
INTRODUCTION
Alzheimer’s disease (AD) is a progressive neurodegenerative disease characterized by the deposition of amyloid-β (Aβ) as insoluble extracellular plaque, the intraneuronal accumulation of neurofibrillary tau tangles, neuronal loss, cognitive dysfunction, dementia, and eventually death.1 Tau is a microtubule associated protein and is primarily located intracellularly, and has a key role in neurodegeneration in Alzheimer’s disease. Phosphorylated tau (p-tau) reduces microtubule binding2 and hyperphosphorylated tau is associated with assembly of tau aggregates as neurofibrillary tangles (NFTs), insoluble paired helical filaments associated with neuronal loss and cognitive symptoms.3 Kinases and phosphatases phosphorylate and dephosphorylate tau at multiple sites. For instance, different sites of tau, including threonine-181 (T181), serine-202 (S202), and threonine-217 (T217), are phosphorylated by a variety of kinases, such as cyclin-dependent kinase 5 (CDK5) and glycogen synthase kinase 3β (GSK-3β).4, 5 Further, different p-tau phosphorylation sites indicate different stages of AD, and are associated with different biological processes, such as amyloid plaques, hypometabolism, and atrophy.6 By measuring different p-tau sites (e.g., phosphorylated T181 (pT181)) and then normalizing to the nonphosphorylated form (e.g., T181), the occupancy of that tau phosphosite may be quantified and is independent of global tau concentration.7 This method avoids confounding by p-tau concentration increasing solely due to increasing tau concentration without altering the relative phosphorylation rate.
Orexin is a wake-promoting neuropeptide. Substantial evidence supports a role for the orexin system in the development of AD pathology. Knocking out the orexin gene in amyloid precursor protein (APP) transgenic mice that develop amyloid deposition led to a marked decrease in amyloid pathology in the brain.8 Studies in APP transgenic mice also found that treatment with a dual orexin receptor antagonist (DORA), almorexant, decreased soluble Aβ concentrations while intra-cerebroventricular administration of orexin increased them.9 Further, prolonged treatment with almorexant for 8 weeks decreased amyloid deposition.9 In humans, CSF orexin-A correlates with CSF Aβ, tau, and p-tau concentrations in individuals with AD.10, 11 Patients with narcolepsy (i.e., with orexin deficiency) have reduced CSF Aβ, tau, and p-tau concentrations, and decreased amyloid deposition on amyloid positron emission tomography (PET) compared to age- and sex-matched controls.12, 13
These findings strongly suggest that blocking orexin will modulate soluble Aβ and amyloid pathology in the brain, although the effect on soluble tau and p-tau and tauopathy is unknown. If orexin blockade decreased soluble Aβ, tau, and p-tau, then DORAs may be potential drugs to test in AD prevention trials. In this study, we tested the hypothesis that suvorexant, the first DORA approved by the Food and Drug Administration (FDA) for the treatment of insomnia, will acutely decrease Aβ, tau, and p-tau in human CSF. These studies help develop the foundational knowledge needed to develop and run treatment and prevention trials in AD.14
METHODS
Participants
Thirty-eight participants aged 45 to 65 years were recruited from a research volunteer registry at Washington University (Volunteer for Health) and the community. All participants were cognitively unimpaired defined as a Mini-Mental State Examination score ≥ 27.15 Participants were screened for poor sleep efficiency <85% using actigraphy. Participants were randomized to placebo (N=13), suvorexant 10 mg (N=13), and suvorexant 20 mg (N=12). In each group, participants were majority female (68.4%) and white (78.9%). Participant characteristics are shown in Table 1. The study was conducted at the Washington University School of Medicine in St Louis, Missouri. The study protocol was approved by the Washington University Institutional Review Board. The Clinical Trials number is NCT03077620. All participants completed written informed consent and were compensated for their participation in the study.
Table 1:
Participant Characteristics
| Placebo (N=13) | Suvorexant 10 mg (N=13) |
Suvorexant 20 mg (N=12) |
|
|---|---|---|---|
| Agea (years), mean (SD) | 55.94 (6.10) | 56.95 (4.35) | 54.30 (5.66) |
| Sexb (percent, N) | F: 61.5%, 8 M: 38.5%, 5 |
F: 69.2%, 9 M: 30.8%, 4 |
F: 75%, 9 M: 25%, 3 |
| Racec (percent, N) | AA: 23.1%, 3 W: 76.9%, 10 |
AA: 30.8%, 4 W: 69.2%, 9 |
AA: 8.3%, 1 W: 91.7%, 11 |
| ApoE4+d (percent, N) | 23.1%, 3 | 30.8%, 4 | 50%, 6 |
| BMI,e mean (SD) | 27.75 (4.68) | 26.72 (3.16) | 26.96 (4.69) |
| ISI,f mean (SD) | 4.08 (4.61) | 4.62 (5.42) | 4.5 (3.61) |
| MMSE,g mean (SD) | 29.38 (0.87) | 29.23 (0.73) | 29.67 (0.49) |
| Screening actigraphy sleep efficiency (%),h mean (SD) | 72.96 (9.36) | 74.74 (7.75) | 78.82 (6.29) |
| Screening actigraphy total sleep time (min),i mean (SD) | 361.49 (59.58) | 367.62 (50.86) | 379.36 (38.55) |
SD: standard deviation; mg: milligrams; F: female; M: male; AA: African-American; W: white; ApoE4+: positive for one Apolipoprotein E4 allele; BMI: body mass index; ISI: Insomnia Severity Index; MMSE: Mini-Mental State Examination; min: minutes
No significant group differences in age. One-way ANOVA: F(2,35) 0.761, p=0.48
No significant group differences for sex. Fisher’s exact test: p=0.91
No significant group differences for race. Fisher’s exact test: p=0.48
No significant group differences for ApoE4+ status. Fisher’s exact test: p=0.39
No significant group differences in BMI. One-way ANOVA: F(2,35) 0.214, p=0.81
No significant group differences in ISI. One-way ANOVA: F(2,35) 0.048, p=0.95
No significant group differences in MMSE. One-way ANOVA: F(2,35) 1.175, p=0.32
No significant group differences in screening actigraphic sleep efficiency. One-way ANOVA: F(2,35) 1.775, p=0.18
No significant group differences in screening actigraphic total sleep time. One-way ANOVA: F(2,35) 0.397, p=0.68
All participants were in good general health, had no clinical sleep or neurological disease, and had no contraindication to a lumbar catheter. Participants were admitted to the Clinical Translational Research Unit (CTRU) and an intrathecal lumbar catheter was placed and collection of samples started in all participants at 20:00. Participants and research staff were blinded to treatment status. CSF was collected every 2 hours for 36 hours. After acclimation to the lumbar catheter and collection of the initial samples, participants received their first dose of placebo, suvorexant 10 mg, or suvorexant 20 mg at 21:00 (hour 1). The participants received their second dose of the same intervention from the first night at 21:00 (hour 25) on the second night. The lumbar catheter was removed on day 3 at 08:00 and participants lay flat for ~6 hours before discharge. Participants had meals served at 09:00, 13:00, and 18:00. Polysomnography was performed as previously reported16, 17 throughout each participant’s admission to the CTRU.
Sample Collection and Analysis
Six milliliters of CSF was obtained every 2 hours for 36 hours. All samples were processed and measured for CSF Aβ38, Aβ40, Aβ42, T181, pT181, S202, pS202, T217, and pT217. Investigators performing the CSF analyses were blinded to the treatment status of the participants. CSF Aβ immunoprecipitation was performed as previously described with minor modifications.17, 18 In brief, 0.5 ml of CSF at each time point and media standards were thawed and centrifuged at 10,000 × g for 10 min at room temperature. Master mix containing 0.05% Tween20, 5 mmol/L guanidine, protease inhibitor cocktail and Aβ internal standard (15N labeled synthetic Aβ38, 40, and 42) were mixed with CSF and immunoprecipitated with anti-Aβ mid-domain antibody (HJ5.1, anti-Aβ13-28) conjugated to Sepharose beads. The mixtures were rotated at room temperature for 2 hours. After incubation and washing the beads were digested with 50 μL aliquot of 2.5ng/μL LysN metalloprotease (Pierce # 90300) in 50mM TEABC. Digestion was performed overnight (~16 hours) at 4°C and 1000RPM. Digestion reactions were quenched via the addition of 100μL of 10% ACN in 0.1% formic acid (FA). Quenched digests were loaded onto a C18 TopTip (Glygen #TT2C18.96). After loading, digests were washed twice with 2% Acetonitrile/0.1% FA and eluted with 150μL 60% ACN in 0.1% FA. Solid phase extraction elutes were then dried with speedvac without heat and analyzed by Xevo TQ-S mass spectrometer (Waters Corporation, Milford, MA, USA). CSF tau and p-tau were analyzed as previously described19 except that the immunoprecipitation was performed by using 0.5 ml CSF, rotated 4 hours at room temperature, and analyzed on Orbitrap Eclipse mass spectrometer (Thermo Fisher Scientific, San Jose, CA, USA).
Statistics
All serial CSF Aβ, tau, and p-tau data were analyzed with general linear mixed models to account for the dependencies among the longitudinal measurements. The data was analyzed by fitting a mixed model as implemented in GraphPad Prism 8.0. This mixed model uses a compound symmetry covariance matrix as used in our previous work,17, 19 and is fit using Restricted Maximum Likelihood (REML). Intervention group, time of day, and intervention × time interaction were treated as fixed effects. Random intercepts and slopes were used to accommodate individual variation. Group differences in participant characteristics and sleep parameters were assessed using a one-way ANOVA for continuous variables (age, BMI, ISI, MMSE, sleep parameters) and Fisher’s exact test for categorical variables (sex, race, ApoE4 status). For all statistical analyses, significance was set at p < 0.05 and Dunnett’s test for multiple comparisons was used to compare all time points between the treatment groups (suvorexant 10 mg and 20 mg) and the placebo group.
RESULTS
Eighty-eight participants were screened and thirty-eight cognitively unimpaired participants were randomized to receive placebo (N=13), suvorexant 10 mg (N=13), or suvorexant 20 mg (N=12) (see Fig 1 for Participant flow diagram and study design). On average, the group participants were 68.4% female and 78.9% white. Although actigraphic sleep efficiency was poor (72–78%), participants did not endorse symptomatic insomnia on the Insomnia Severity Index.20 Participant characteristics are shown in Table 1. There were no significant differences between groups for any baseline characteristics. Neither suvorexant 10 mg or 20 mg significantly increased total sleep time, sleep efficiency, time in non-rapid eye movement sleep, or time in rapid eye movement sleep compared to placebo (Table 2, Fig 2).
Figure 1:
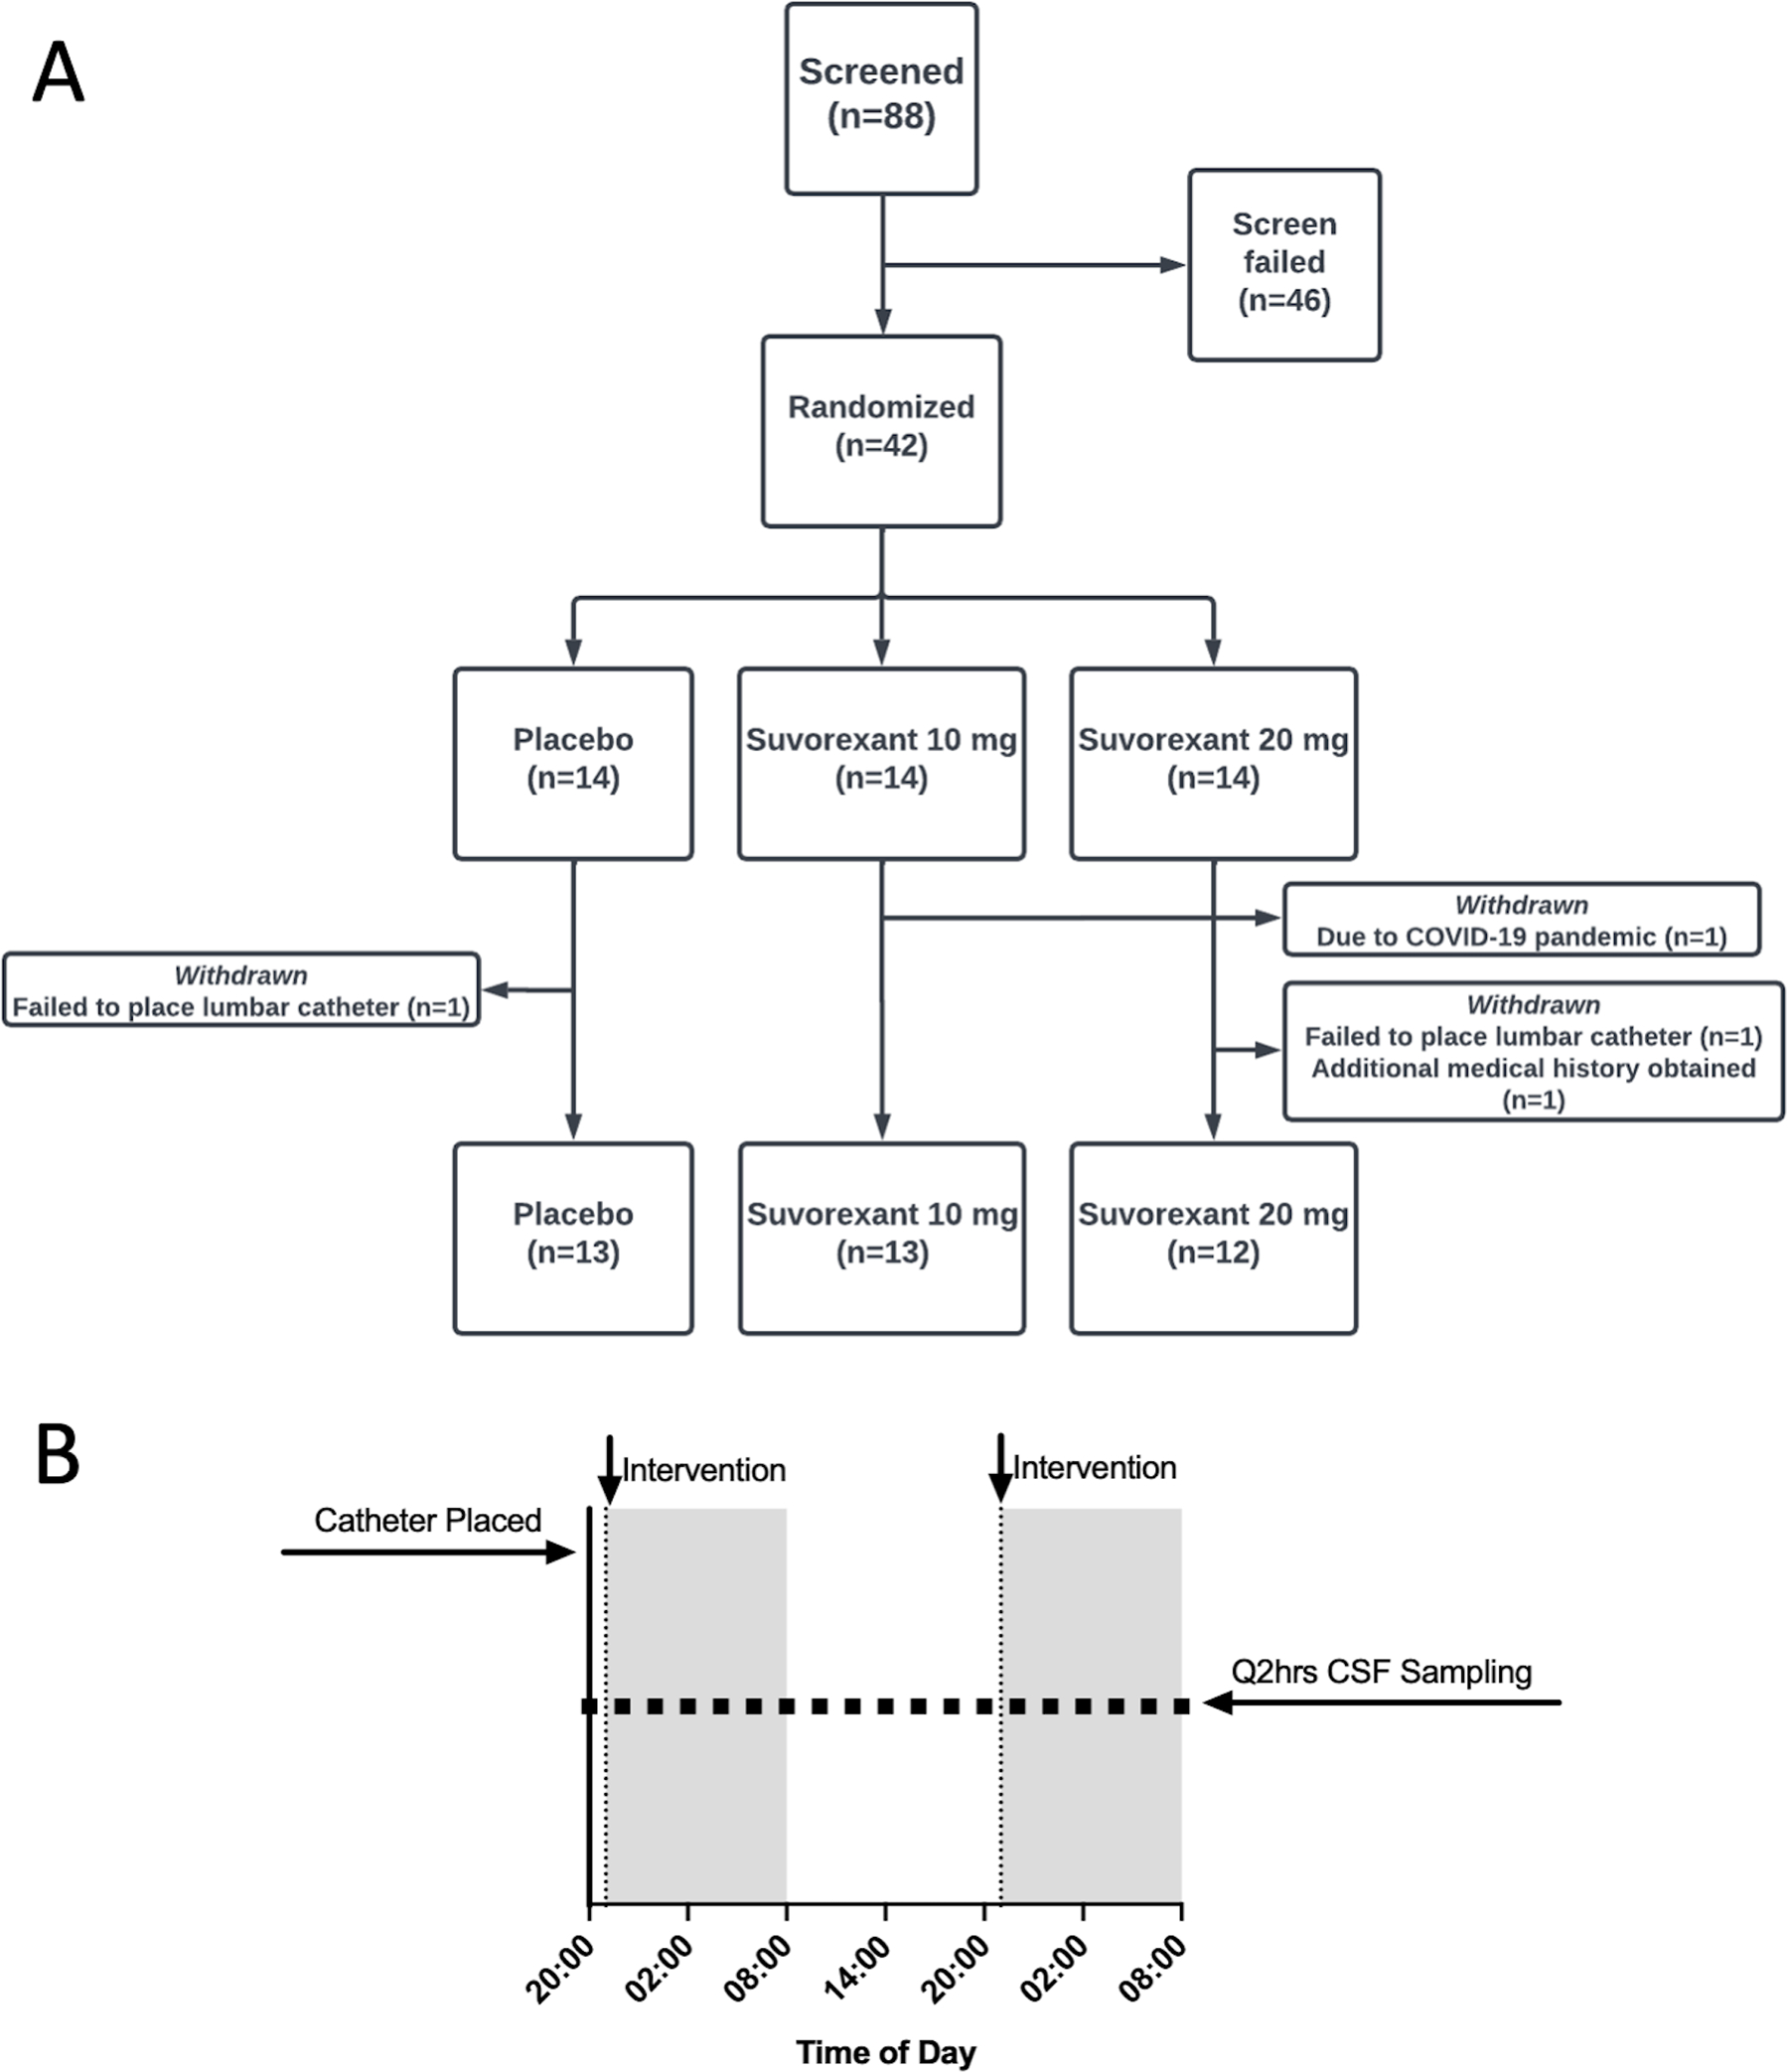
Participant flow diagram and study design. A. Eighty-eight participants were screened for the study and 46 participants screened failed. Forty-two participants were randomized. Four participants were withdrawn from the study after randomization but before CSF was collected or study interventions administered. The lumber catheter could not be placed for two participants. One participant withdrew due to the COVID-19 pandemic and one participant was excluded after an exclusion diagnosis was found after additional medical records were received. Thirty-eight participants completed the study in the placebo (N=13), suvorexant 10 mg (N=13), and suvorexant 20 mg (N=12) groups. B. Study design during admission to the Clinical Translational Research Unit for lumbar catheter placement and CSF sampling.
Table 2:
Sleep Parameters on Intervention Nights
| Placebo vs. Suvorexant 10 mg | Placebo vs. Suvorexant 20 mg | |
|---|---|---|
| NIGHT 1 | ||
| Total Sleep Time (min) | ||
| Mean difference | −34.88 | −50.47 |
| 95% CI | −97.77, 28.00 | −114.6, 13.71 |
| p-value | 0.35 | 0.14 |
| Sleep Efficiency (%) | ||
| Mean difference | −3.94 | −7.65 |
| 95% CI | −11.91, 4.04 | −15.79, 0.49 |
| p-value | 0.43 | 0.07 |
| NREM Stage 2 (min) | ||
| Mean difference | −21.73 | −25.71 |
| 95% CI | −79.59, 36.13 | −84.77, 33.34 |
| p-value | 0.60 | 0.51 |
| NREM Stage 3 (min) | ||
| Mean difference | −17.35 | −11.27 |
| 95% CI | −54.99, 20.30 | −49.69, 27.15 |
| p-value | 0.47 | 0.73 |
| REM (min) | ||
| Mean difference | −5.50 | −20.96 |
| 95% CI | −48.38, 37.38 | −64.73, 22.80 |
| p-value | 0.94 | 0.45 |
| NIGHT 2 | ||
| Total Sleep Time (min) | ||
| Mean difference | −10.54 | −38.71 |
| 95% CI | −88.42, 67.33 | −116.6, 39.17 |
| p-value | 0.93 | 0.42 |
| Sleep Efficiency (%) | ||
| Mean difference | −0.10 | −5.26 |
| 95% CI | −10.39, 10.19 | −15.55, 5.03 |
| p-value | 0.99 | 0.40 |
| NREM Stage 2 (min) | ||
| Mean difference | −0.43 | −9.89 |
| 95% CI | −61.92, 61.07 | −71.38, 51.61 |
| p-value | 0.99 | 0.91 |
| NREM Stage 3 (min) | ||
| Mean difference | −10.90 | −3.49 |
| 95% CI | −52.16, 30.36 | −44.75, 37.77 |
| p-value | 0.77 | 0.97 |
| REM (min) | ||
| Mean difference | −2.30 | −21.46 |
| 95% CI | −36.68, 32.09 | −55.85, 12.93 |
| p-value | 0.98 | 0.27 |
Mg: milligrams; min: minutes; CI: confidence intervals; NREM: non-rapid eye movement; REM: rapid eye movement.
p-values corrected using Dunnett’s multiple comparison’s test
Figure 2:

Sleep parameters for each group on nights 1 and 2 after receiving either placebo, suvorexant 10 mg, or suvorexant 20 mg. On both night 1 and night 2, total sleep time (A, B), sleep efficiency (C, D), time spent in non-rapid eye movement (NREM) stage 2 sleep (E, F), time spent in NREM stage 3 sleep (G, H), and time spent in rapid eye movement sleep (I, J) were not significantly increased between placebo and treatment groups. There was a trend for higher sleep efficiency in suvorexant 20 mg group on night 1 (p=0.07). Red: placebo; Blue: suvorexant 10 mg; Green: suvorexant 20 mg. Mean and standard error bars are shown. P-values corrected using Dunnett’s multiple comparison’s test.
There were few significant differences at individual time points between the different forms of tau or p-tau across the sampling period after normalizing to hour 0 for both ng/ml and percent change over time (Fig 3–4). In addition to normalizing to hour 0, we also normalized to hour 6 to account for the ~5 hour transit time of CSF from the brain to the lumbar catheter after placebo or suvorexant was administered at hour 1.16, 17 Although group differences were suggested in the oscillation of tau and p-tau, these differences were not statistically significant. For example, T181, S202, and T217 were ~10–20% greater in the suvorexant 20 mg group compared to placebo at hours 20 and 22. pT181 and pT217 were ~10–30% lower in the suvorexant 20 mg group than placebo at multiple points such as hours 14–16 and 28–34. However, none of these differences were significant.
Figure 3:
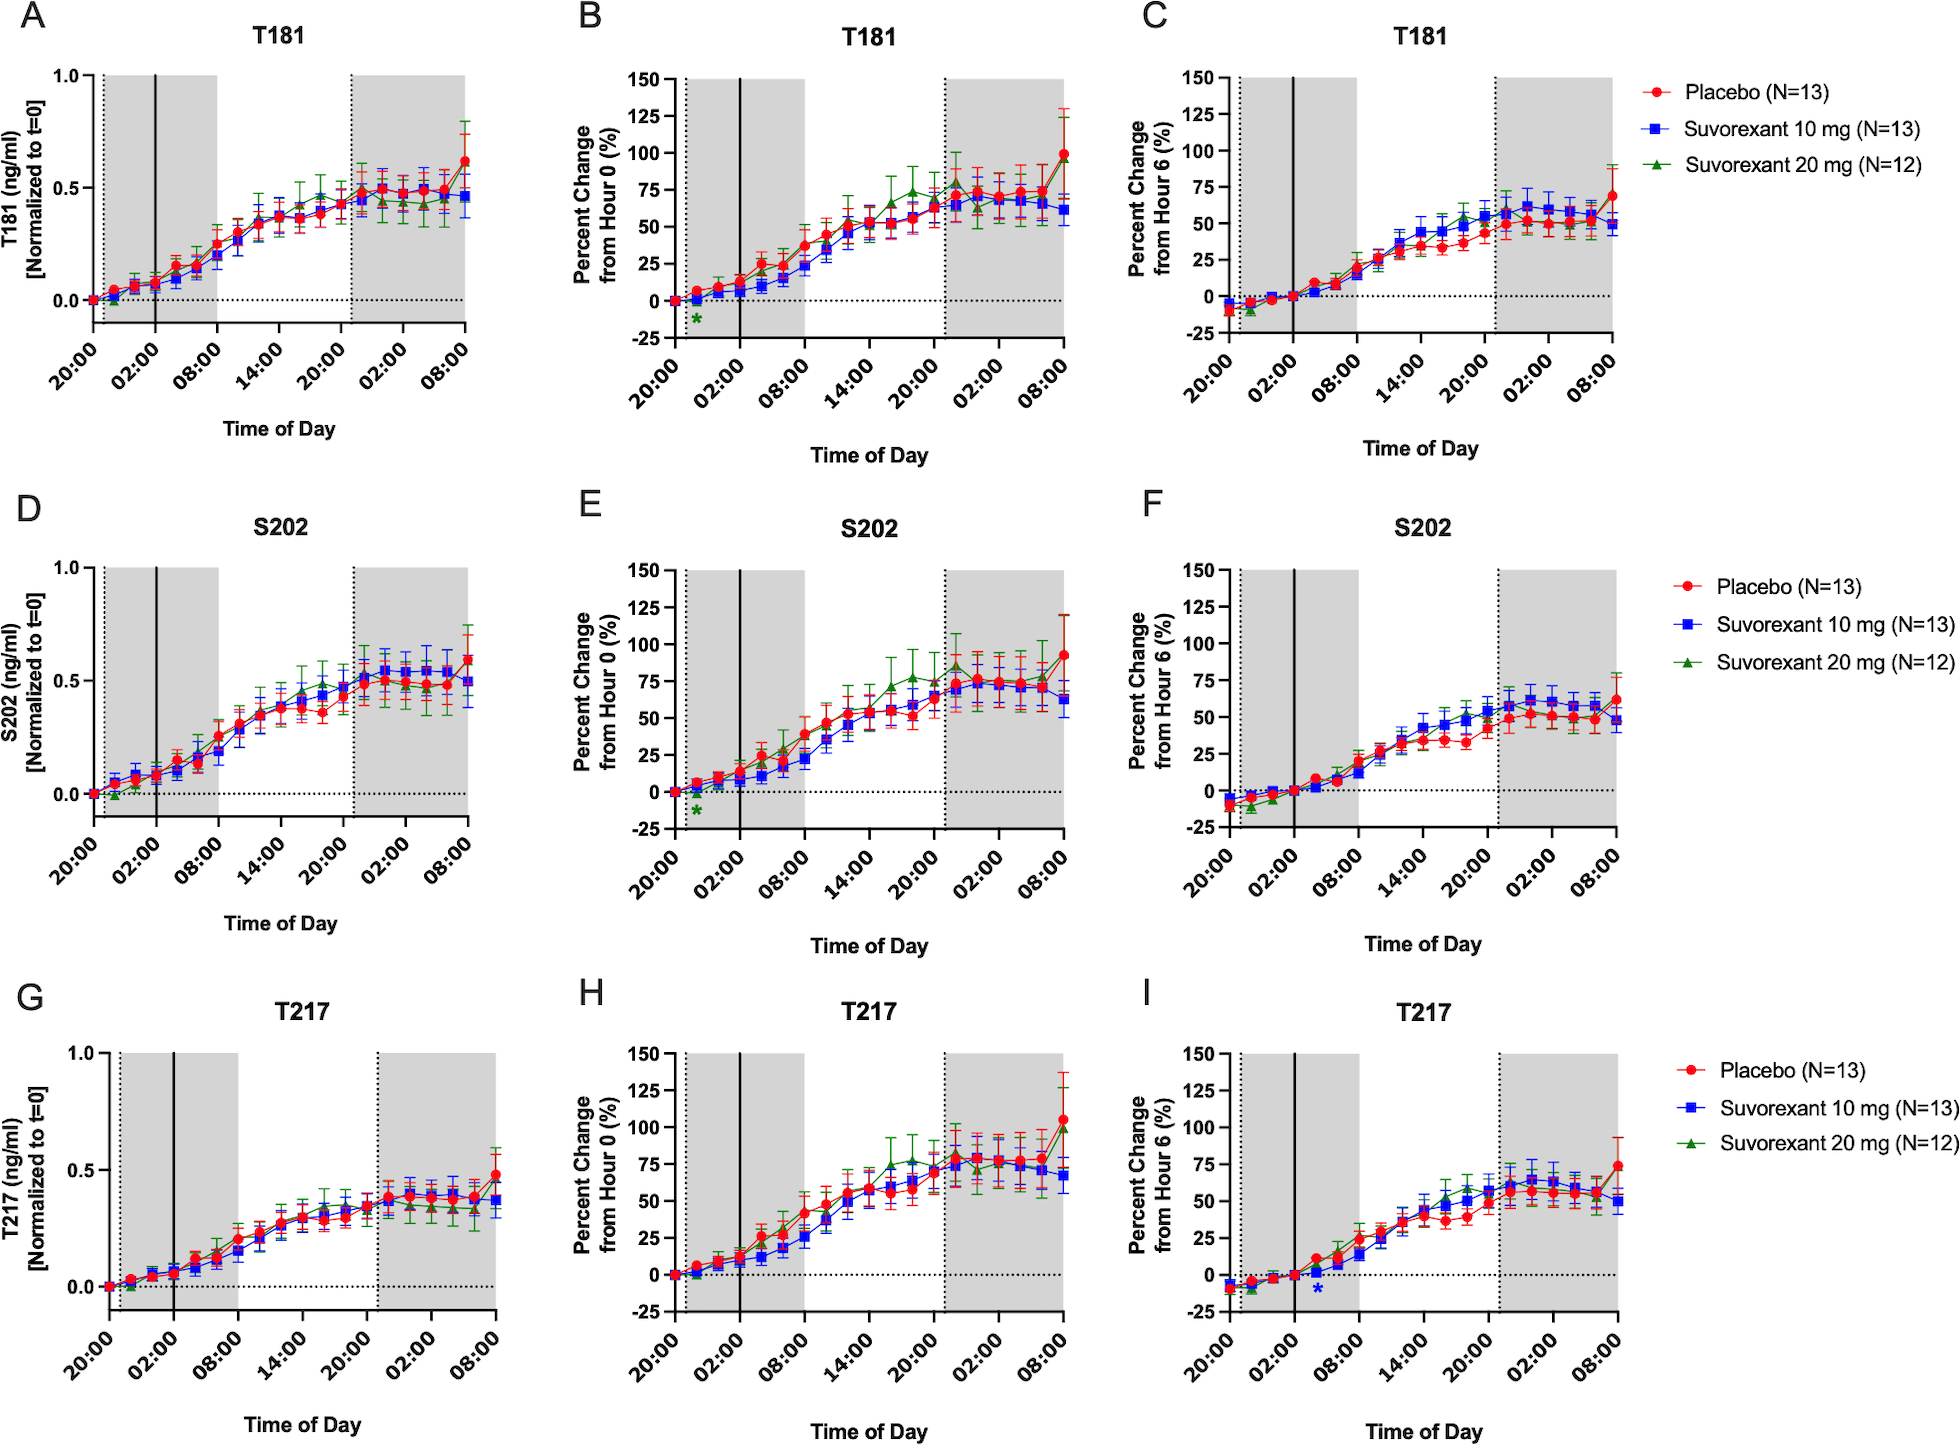
Effect of suvorexant on unphosphorylated tau (i.e., total tau). Tau-threonine-181 (T181) was normalized to change from hour 0 for ng/ml (A), percent change from hour 0 (B), and percent change from hour 6 (C). The percent change from hour 0 was significantly decreased at hour 2 in the suvorexant 20 mg group compared to placebo, but otherwise there were no significant group differences. Tau-serine-202 (S202) was normalized to change from hour 0 for ng/ml (D), percent change from hour 0 (E), and percent change from hour 6 (F). The percent change from hour 0 was significantly decreased at hour 2 in the suvorexant 20 mg group compared to placebo, but otherwise there were no significant group differences. Tau-threonine-217 (T217) was normalized to change from hour 0 for ng/ml (G), percent change from hour 0 (H), and percent change from hour 6 (I). The percent change from hour 6 was significantly decreased at hour 8 in the suvorexant 10 mg group compared to placebo, but otherwise there were no significant group differences. Red: placebo; Blue: suvorexant 10 mg; Green: suvorexant 20 mg. Error bars indicate standard error. The vertical dashed lines are at hours 1 and 25 when placebo or suvorexant was administered. The vertical solid line is at hour 6. The horizontal dashed line is at the normalized baseline. The shaded regions are the overnight periods. *p < 0.05 after correction for multiple comparisons.
Figure 4:

Effect of suvorexant on phosphorylated tau. Phosphorylated-tau-threonine-181 (pT181) was normalized to change from hour 0 for ng/ml (A), percent change from hour 0 (B), and percent change from hour 6 (C). The percent change from hour 0 was significantly decreased at hour 2 in the suvorexant 20 mg group compared to placebo, but otherwise there were no significant group differences. Phosphorylated-tau-serine-202 (pS202) was normalized to change from hour 0 for ng/ml (D), percent change from hour 0 (E), and percent change from hour 6 (F). The percent change from hour 6 was significantly decreased at hours 4 and 18 in the suvorexant 20 mg group compared to placebo, but otherwise there were no significant group differences. Phosphorylated-tau-threonine-217 (pT217) was normalized to change from hour 0 for ng/ml (G), percent change from hour 0 (H), and percent change from hour 6 (I). The percent change from hour 0 was significantly decreased at hour 2 in the suvorexant 20 mg group compared to placebo, but otherwise there were no significant group differences. Red: placebo; Blue: suvorexant 10 mg; Green: suvorexant 20 mg. Error bars indicate standard error. The vertical dashed lines are at hours 1 and 25 when placebo or suvorexant was administered. The vertical solid line is at hour 6. The horizontal dashed line is at the normalized baseline. The shaded regions are the overnight periods. *p < 0.05 after correction for multiple comparisons.
To quantify the effect of suvorexant on tau phosphorylation without the confounding of p-tau concentration changing solely due to increasing or decreasing tau concentration without altering the relative phosphorylation rate, we determined the phosphorylation occupancy of each tau phosphosite (e.g., pT181/T181). We found that the pT181/T181 ratio was significantly decreased at multiple time points in participants treated with suvorexant 20 mg compared to those treated with placebo by ~10–15% (Fig 5A–C). Starting from a baseline of 23–26%, the pT181/T181 ratio decreased 2–4% (a relative reduction of 10–15%) over the first 7 hours after receiving suvorexant 20 mg at 21:00 (hour 1) and remained lower for hours from 10:00–12:00 (hours 14–16). The ratio then increased to approximately the level of the placebo group at hour 24 and then decreased again after participants received the second dose of suvorexant 20 mg from 22:00–08:00 (hours 26–36). The area under the curve (AUC) of percent change from hour 0 for pT181/T181 across hours 0–36 was also significantly reduced in the suvorexant 20 mg group compared to placebo. Although there were no significant group differences for pS202/S202 or pT217/T217 at individual time points or AUC, pS202/S202 trended lower in the suvorexant 20 mg group at hour 36 (Fig 5D–I).
Figure 5:

Effect of suvorexant on phosphorylated tau/unphosphorylated tau ratio. Phosphorylated-tau-threonine-181/unphosphorylated-tau-threonine-181 ratio (pT181/T181) was decreased at multiple time points in both the non-normalized (A) and normalized to change from hour 0 (B). Suvorexant 20 mg decreased pT181/T181 at hours 14, 16, 26–36 compared to placebo. Suvorexant 10 mg decreased pT181 at hour 26 compared to placebo. For the data normalized to percent change from hour 0, the area under the curve (AUC) across the entire sampling period (hours 0–36) for pT181/T181 was significantly reduced in the suvorexant 20 mg group compared to placebo (C). There were no significant group differences for both the phosphorylated-tau-serine-202/unphosphorylated-tau-threonine-202 ratio (pS202/S202) (D-F) or the phosphorylated-tau-threonine-217/unphosphorylated-tau-threonine-217 ratio (pT217/T217) (G-I). pS202/S202 was decreased from placebo but not significantly. Red: placebo; Blue: suvorexant 10 mg; Green: suvorexant 20 mg. Error bars indicate standard error. The vertical dashed lines are at hours 1 and 25 when placebo or suvorexant was administered. The horizontal dashed line is at the normalized baseline. The shaded regions are the overnight periods. *p < 0.05, **p < 0.01, ***p < 0.001 after correction for multiple comparisons.
We also tested the effect of suvorexant on CSF Aβ38, Aβ40, and Aβ42. Aβ38 and Aβ40 were excluded for one participant due to concentrations greater than four standard deviations above the group mean for the respective Aβ isoform; Aβ42 concentrations were less than one standard deviation of the group mean for this participant and were included in the analyses. As with Figures 3 and 4, we normalized Aβ to hour 0 and hour 6 to account for brain-to-lumbar catheter transit time. After an initial increase in CSF Aβ, participants receiving suvorexant 20 mg had a change in trajectory of the longitudinal Aβ measurements compared to placebo (Fig 6). CSF Aβ was ~10–20% lower in the suvorexant 20 mg group compared to placebo between hours 12–18 (08:00–14:00) when normalized to hour 6. After hour 18, CSF Aβ38, Aβ40, and Aβ42 increased until the second dose of suvorexant 20 mg was administered at hour 25. Similar to the first dose at hour 1, CSF Aβ levels decreased and established a new baseline after ~5 hours from hours 30–36. Averaging over the duration of the study, the area under the curve (AUC) for change from hour 0 of Aβ38, Aβ40, and Aβ42 were not significantly different in the suvorexant 10 mg or suvorexant 20 mg group compared to placebo. When normalized to hour 6, however, the suvorexant 20 mg group was 373.9 percent change*time lower than placebo (Fig 7).
Figure 6:

Effect of suvorexant on amyloid-β (Aβ). Aβ38, Aβ40, and Aβ42 were normalized to change from hour 0 for ng/ml (A, D, G), percent change from hour 0 (B, E, H), and percent change from hour 6 (C, F, I). When normalized to hour 0 for ng/ml, Aβ38 at hour 36 was significantly decreased in the suvorexant 20 mg group compared to placebo (A). When normalized to percent change from hour 0, Aβ42 was significantly decreased in the suvorexant 20 mg group compared to placebo (H). The percent change from hour 6, five hours after the intervention was administered, showed that Aβ38, Aβ40, and Aβ42 were significantly decreased at multiple time points. Red: placebo; Blue: suvorexant 10 mg; Green: suvorexant 20 mg. Error bars indicate standard error. The vertical dashed lines are at hours 1 and 25 when placebo or suvorexant was administered. The vertical solid line is at hour 6. The horizontal dashed line is at the normalized baseline. The shaded regions are the overnight periods. *p < 0.05 and **p < 0.01 after correction for multiple comparisons.
Figure 7:

Effect of suvorexant on amyloid-β (Aβ) area under the curve (AUC). The AUC was calculated for Aβ38, Aβ40, and Aβ42 normalized to percent change from hour 0 (A-C). There were no significant differences between placebo and the intervention groups for Aβ38, Aβ40, and Aβ42. The AUC was also calculated for Aβ38, Aβ40, and Aβ42 normalized to percent change from hour 6 or five hours after the intervention was administered (D-F). There were no significant differences between placebo and the intervention groups for Aβ38 and Aβ40. However, the suvorexant 20 mg group was significantly decreased compared to placebo. Red: placebo; Blue: suvorexant 10 mg; Green: suvorexant 20 mg. Error bars indicate standard error. P-values are shown and are corrected for multiple comparisons.
DISCUSSION
Sleep disturbances are hypothesized to increase the risk of AD by increasing the concentrations of Aβ and tau, potentially promoting amyloid plaque formation and the spreading of tau pathology.21 Longitudinal sampling of CSF during sleep deprivation found that soluble concentrations of CSF Aβ38, Aβ40, Aβ42, T181, S202, and T217 increased by ~30–50%.17, 19, 22, 23 However, the effect of sleep loss on tau phosphorylation was site-specific based on the ratio of p-tau to unphosphorylated tau.19 As previously discussed, the ratio of each phosphorylated form of tau to the unphosphorylated form is a measure of the occupancy of phosphorylation at that site. During sleep deprivation, the pT217/T217 ratio increased, the ratio of pS202/S202 decreased, and the ratio of pT181/T181 was unchanged.
In this study of clinically normal participants, suvorexant, a dual orexin receptor antagonist, acutely decreased tau phosphorylation at T181 and Aβ levels in human CSF despite no significant group differences in multiple sleep measures. We previously tested the effect of the sodium salt form of ɣ-hydroxybutyrate (GHB), a GABA-B receptor agonist, on CSF Aβ, tau, and p-tau and found no difference from controls.17, 19 A potential explanation of these findings is that previous studies in a diurnal species of monkeys found that the administration of GHB at night did not change CSF orexin levels24 while sleep deprivation increased CSF orexin levels.24, 25 Alternatively, rapid eye movement (REM) sleep may be an important regulator of Alzheimer pathology and neurodegeneration.26 DORAs increase REM sleep more than other hypnotics,27 although we did not find an increase in REM sleep in the groups treated with suvorexant. Based on these prior results, our findings, and the observation that the effect of suvorexant persisted for >18 hours after drug administration, we hypothesize that suvorexant’s effect on p-tau and Aβ may be due to mechanisms other than sleep involving orexin receptor signaling pathways although further studies are needed.
The orexin system regulates sleep-wake activity, feeding behavior, energy homeostasis, and the reward system.28 Orexins bind to two G protein-coupled receptors, orexin receptor 1 (OXR1) and orexin receptor 2 (OXR2), that trigger multiple downstream pathways including p38 mitogen-activated protein kinase (MAPK) and the extracellular signal regulated kinase (ERK).29, 30 p38 MAPK phosphorylates tau at multiple sites, including at T181, S202, and T217. The different responses to suvorexant observed at each phosphosite may be due to the relative abundance of tau phosphorylation at each site. pT181 is the most phosphorylated tau form (~25% at hour 0) followed by pS202 (~10% at hour 0) and pT217 (<3% at hour 0). Differences in tau phosphorylation occupancy between these sites after treatment with suvorexant may be a function of the relative abundance of each p-tau form. Phosphorylation on each tau site results from the sum of different kinase activity and is modulated by tau conformation as well as phosphorylation status. Suvorexant may affect kinase pathways contributing to a higher proportion of T181 phosphorylation compared to other phosphorylation sites. Longer sampling times may have shown a decrease in the pS202/S202 ratio as the suvorexant 20 mg was increasingly separating from placebo at hour 36. Further, T181 was recently reported as a “master site” for tau phosophorylation.31 However, the fact that only the pT181/T181 ratio was affected by suvorexant, and not pS202/S202 or pT217/T217, adds uncertainty to the results. Additional studies are needed to replicate this result and test if amyloid-positive individuals with hyperphosphorylated tau who are chronically treated with suvorexant have reduced tau phosphorylation at sites other than T181.
Orexin receptors also interact with β-arrestin-2,32, 33 a protein important for regulating signal transduction at G protein-coupled receptors, in an agonist-dependent manner.34 β-arrestin-2 may have an important role mediating the effect of suvorexant on both Aβ and p-tau. After orexin-A and orexin-B occupies both OXR1 and OXR2, there is a dose-dependent interaction between the receptors and β-arrestin-2.34, 35 Disruption of this complex prevents OXR1 from phosphorylating MAPK, ERK1, and ERK2,34 potentially reducing their activity and ability to phosphorylate tau. Further, increased expression of β-arrestin-2 was found to increase Aβ generation and decreased β-arrestin-2 expression decreased Aβ generation through interactions with gamma-secretase that affect is catalytic activity.36 Blocking orexin signaling at OXR1 and OXR2 may decrease Aβ via decreased β-arrestin-2 activation and its downstream effects.
Our findings support that suvorexant 20 mg decreases tau phosphorylation occupancy and Aβ over time and that its action may extend beyond sleep induction at night. The differential response of CSF tau and Aβ to suvorexant without a significant change in sleep suggests that different mechanistic pathways may be involved. Despite its critical role in AD pathogenesis, few trials have targeted tau phosphorylation to prevent or delay AD.37 Suvorexant 20 mg is already approved by the FDA to treat insomnia, including for the treatment of insomnia in patients with mild-to-moderate AD,38 and has a strong track record of patient safety. Suvorexant 10 mg did not show the same effect on Aβ and p-tau as suvorexant 20 mg (Fig 8) and further studies are needed to establish the dose-response effect of higher doses of suvorexant on CSF AD biomarkers. Further, two additional DORAs, lemborexant and daridorexant, recently received FDA-approval for the treatment of insomnia. Future studies are needed to test if lemborexant and/or daridorexant show the same effects and to determine the pharmacokinetics and pharmacodynamics of suvorexant’s effect on p-tau and Aβ before moving toward phase III AD prevention trials. The orexinergic system may also be tested for its effect on CSF AD biomarkers using new drugs such as selective orexin receptor agonists (danavorexton39) and antagonists (seltorexant40). This study informs the short-term dosing effects of suvorexant on CSF Aβ, tau, and p-tau. When long-term dosing effects of these safe, FDA-approved class of drugs are demonstrated, prevention trials may be implemented that can test the hypothesis that lower Aβ and phosphorylated tau could mitigate the progression and onset of AD.
Figure 8:

Dose-Response Curves. After normalization to percent change from hour 0, the group means at each time point were calculated for Aβ38, Aβ40, Aβ42, and pT181/T181. The group differences for Aβ38, Aβ40, Aβ42, and pT181/T181 at each time point were then calculated for suvorexant 10 mg vs. placebo and suvorexant 20 mg vs. placebo (A-D). Suvorexant 20 mg decreased Aβ38, Aβ40, Aβ42, and pT181/T181 across hours 0–36 compared to placebo with Aβ decreasing 20–40% from placebo and pT181/T181 decreasing 5–10% from placebo. Suvorexant 10 mg showed minimal change from placebo. Blue: suvorexant 10 mg minus placebo; Green: suvorexant 20 mg minus placebo. The vertical dashed lines are at hours 1 and 25 when placebo or suvorexant was administered. The vertical solid line is at hour 6. The horizontal dashed line is at the normalized baseline. The shaded regions are the overnight periods.
SUMMARY FOR SOCIAL MEDIA IF PUBLISHED.
Brendan Lucey: @BrendanLucey_MD
Sleep loss increases measures of Alzheimer’s disease (AD) in people and animal models. Increasing sleep with dual orexin receptor antagonists (DORAs) lowers these same AD measures in mouse models, but have not been tested in humans. We tested the effect of a DORA, suvorexant, on Alzheimer’s measures in people without Alzheimer’s disease. We found that suvorexant lowered key measures of Alzheimer’s, including tau phosphorylation and amyloid-beta levels (proteins critical to the development of AD) in human cerebrospinal fluid within hours. Future studies are needed to determine the long-term effect of DORAs like suvorexant on treating and preventing Alzheimer’s pathology and cognitive decline.
ACKNOWLEDGEMENTS
We thank the participants for their time and commitment to the study. This study was funded by the National Institutes of Health (NIH) (K76 AG054863) and the BrightFocus Foundation (A2016180S). The 15N-441 tau internal standard was a generous gift from G. Lippens. Dr N. Kanaan generously provided the Tau1 antibody that is a tau epitope 192–199. HJ8.5 antibody to tau epitope 27–35 was generously given by Dr. David Holtzman. The funding sources had no role in the study design, data collection, management, analysis, interpretation of the data, or manuscript preparation.
Footnotes
POTENTIAL CONFLICTS OF INTEREST
H.L., C.D.T., D.F., T.R., S.L.C., K.G.M., V.O., J.G.B.: No potential conflicts reported relevant to this work.
N.R.B.: N.R.B. may receive income based on technology (methods of diagnosing AD with phosphorylation changes) licensed by Washington University to C2N Diagnostics (method used for measuring tau phosphorylation).
R.J.B.: R.J.B. may receive income based on technology (methods of diagnosing AD with phosphorylation changes) licensed by Washington University to C2N Diagnostics (method used for measuring tau phosphorylation). Washington University and R.J.B. have equity ownership interest in C2N Diagnostics and R.J.B. receives income from C2N Diagnostics for serving on the scientific advisory board.
B.P.L: B.P.L. has consulted for Merck (maker of suvorexant) in the past 3 years. Merck is also providing suvorexant and matched placebo for a clinical trial funded by a private foundation.
REFERENCES
- 1.Bateman RJ, Xiong C, Benzinger TL, et al. Clinical and biomarker changes in dominantly inherited Alzheimer’s disease. N Engl J Med. 2012;367(9):795–804. [DOI] [PMC free article] [PubMed] [Google Scholar]
- 2.Kellogg EH, Hejab NM, Poepsel S, Downing KH, DiMaio F, Nogales E. Near-atomic model of microtubule-tau interactions. Science. 2018;360(6394):1242–6. [DOI] [PMC free article] [PubMed] [Google Scholar]
- 3.Gordon BA, Blazey TM, Christensen J, et al. Tau PET in autosomal dominant Alzheimer’s disease: relationship with cognition, dementia and other biomarkers. Brain. 2019. Apr 1;142(4):1063–76. [DOI] [PMC free article] [PubMed] [Google Scholar]
- 4.Lund ET, McKenna R, Evans DB, Sharma SK, Mathews WR. Characterization of the in vitro phosphorylation of human tau by tau protein kinase II (cdk5/p20) using mass spectrometry. J Neurochem. 2001;76(4):1221–32. [DOI] [PubMed] [Google Scholar]
- 5.Liu F, Iqbal K, Grundke-Iqbal I, Gong C-X. Involvement of aberrant glycosylation in phosphorylation of tau by cdk5 and GSK-3β. FEBS Lett. 2002;530(1–3):209–14. [DOI] [PubMed] [Google Scholar]
- 6.Barthélemy NR, Li Y, Joseph-Mathurin N, et al. A soluble phosphorylated tau signature links tau, amyloid and the evolution of stages of dominantly inherited Alzheimer’s disease. Nat Med. 2020;26(3):398–407. [DOI] [PMC free article] [PubMed] [Google Scholar]
- 7.Barthélemy NR, Mallipeddi N, Moiseyev P, Sato C, Bateman RJ. Tau phosphorylation rates measured by mass spectrometry differ in the intracellular brain vs. extracellular cerebrospinal fluid compartments and are differentially affected by Alzheimer’s disease. Front Aging Neurosci. 2019;11:121. [DOI] [PMC free article] [PubMed] [Google Scholar]
- 8.Roh JH, Finn MB, Stewart FR, et al. Potential role of orexin and sleep modulation in the pathogenesis of Alzheimer’s disease. J Exp Med. 2014;211(13):2487–96. [DOI] [PMC free article] [PubMed] [Google Scholar]
- 9.Kang J-E, Lim MM, Bateman RJ, et al. Amyloid-β dynamics are regulated by orexin and the sleep-wake cycle. Science. 2009;326(5955):1005–7. [DOI] [PMC free article] [PubMed] [Google Scholar]
- 10.Liguori C, Romigi A, Nuccetelli M, et al. Orexinergic system dysregulation, sleep impairment, and cognitive decline in Alzheimer disease. JAMA Neurol. 2014;71(12):1498–505. [DOI] [PubMed] [Google Scholar]
- 11.Osorio RS, Ducca EL, Wohlleber ME, et al. Orexin-A is associated with increases in cerebrospinal fluid phosphorylated-tau in cognitively normal elderly subjects. Sleep. 2016;39(6):1253–60. [DOI] [PMC free article] [PubMed] [Google Scholar]
- 12.Gabelle A, Jaussent I, Bouallègue FB, et al. Reduced brain amyloid burden in elderly patients with narcolepsy type 1. Ann Neurol. 2019;85(1):74–83. [DOI] [PubMed] [Google Scholar]
- 13.Jennum PJ, Østergaard Pedersen L, Czarna Bahl JM, et al. Cerebrospinal Fluid Biomarkers of Neurodegeneration Are Decreased or Normal in Narcolepsy. Sleep. 2017. Jan 1;40(1). [DOI] [PubMed] [Google Scholar]
- 14.McDade E, Llibre-Guerra JJ, Holtzman DM, Morris JC, Bateman RJ. The informed road map to prevention of Alzheimer Disease: A call to arms. Mol Neurodegener. 2021. Jul 21;16(1):49. [DOI] [PMC free article] [PubMed] [Google Scholar]
- 15.Folstein MF, Folstein SE, McHugh PR. Mini-mental state: a practical method for grading the cognitive state of patients for the clinician. J Psychiat Res. 1975;12(3):189–98. [DOI] [PubMed] [Google Scholar]
- 16.Huang Y, Potter R, Sigurdson W, et al. Effects of age and amyloid deposition on Aβ dynamics in the human central nervous system. Arch Neurol. 2012;69(1):51–8. [DOI] [PMC free article] [PubMed] [Google Scholar]
- 17.Lucey BP, Hicks TJ, McLeland JS, et al. Effect of sleep on overnight CSF amyloid-β kinetics. Ann Neurol. 2018;83(1):197–204. [DOI] [PMC free article] [PubMed] [Google Scholar]
- 18.Patterson BW, Elbert DL, Mawuenyega KG, et al. Age and amyloid effects on human CNS amyloid-beta kinetics. Ann Neurol. 2015;78(3):439–53. [DOI] [PMC free article] [PubMed] [Google Scholar]
- 19.Barthélemy NR, Liu H, Lu W, Kotzbauer PT, Bateman RJ, Lucey BP. Sleep deprivation affects tau phosphorylation in human cerebrospinal fluid. Ann Neurol. 2020;87(5):700–9. [DOI] [PMC free article] [PubMed] [Google Scholar]
- 20.Bastien CH, Vallieres A, Morin CM. Validation of the Insomnia Severity Index as an outcome measure for insomnia research. Sleep Med. 2001;2:297–307. [DOI] [PubMed] [Google Scholar]
- 21.Lucey BP. It’s complicated: The relationship between sleep and Alzheimer’s disease in humans. Neurobiol Dis. 2020. Jul 29;144:105031. [DOI] [PMC free article] [PubMed] [Google Scholar]
- 22.Ooms S, Overeem S, Besse K, Rikkert MO, Verbeek M, Claassen JA. Effect of 1 night of total sleep deprivation on cerebrospinal fluid β-amyloid 42 in healthy middle-aged men: a randomized clinical trial. JAMA Neurol. 2014;71(8):971–7. [DOI] [PubMed] [Google Scholar]
- 23.Holth JK, Fritschi SK, Wang C, et al. The sleep-wake cycle regulates extracellular tau in mice and humans. Science. 2019;363(6429):880–4. [DOI] [PMC free article] [PubMed] [Google Scholar]
- 24.Zeitzer JM, Buckmaster CL, Landolt HP, Lyons DM, Mignot E. Modafinil and γ-hydroxybutyrate have sleep state-specific pharmacological actions on hypocretin-1 physiology in a primate model of human sleep. Behav Pharmacol. 2009. Oct;20(7):643–52. [DOI] [PMC free article] [PubMed] [Google Scholar]
- 25.Zeitzer JM, Buckmaster CL, Parker KJ, Hauck CM, Lyons DM, Mignot E. Circadian and homeostatic regulation of hypocretin in a primate model: implications for the consolidation of wakefulness. J Neurosci. 2003;23(8):3555–60. [DOI] [PMC free article] [PubMed] [Google Scholar]
- 26.André C, Champetier P, Rehel S, et al. Rapid-eye-movement sleep, neurodegeneration and amyloid deposition in ageing. Ann Neurol. 2023. Jan 15. [DOI] [PubMed] [Google Scholar]
- 27.Uemura SI, Imanishi A, Terui Y, et al. Residual effects of low dose of suvorexant, zolpidem, and ramelteon in healthy elderly subjects: A randomized double-blind study. Neuropsychopharmacol Rep. 2022. Sep;42(3):288–98. [DOI] [PMC free article] [PubMed] [Google Scholar]
- 28.Tsujino N, Sakurai T. Orexin/Hypocretin: a neuropeptide at the interface of sleep, energy homeostasis, and reward system. Pharmacol Rev. 2009;61(2):162–76. [DOI] [PubMed] [Google Scholar]
- 29.Ammoun S, Johansson L, Ekholm ME, et al. OX1 orexin receptors activate extracellular signal-regulated kinase in Chinese hamster ovary cells via multiple mechanisms: the role of Ca2+ influx in OX1 receptor signaling. Mol Endocrinol. 2006. Jan;20(1):80–99. [DOI] [PubMed] [Google Scholar]
- 30.Guo Y, Feng P. OX2R activation induces PKC-mediated ERK and CREB phosphorylation. Exp Cell Res. 2012. Oct 1;318(16):2004–13. [DOI] [PMC free article] [PubMed] [Google Scholar]
- 31.Stefanoska K, Gajwani M, Tan ARP, et al. Alzheimer’s disease: Ablating single master site abolishes tau hyperphosphorylation. Sci Adv. 2022. Jul 8;8(27):eabl8809. [DOI] [PMC free article] [PubMed] [Google Scholar]
- 32.Leonard CS, Kukkonen JP. Orexin/hypocretin receptor signalling: a functional perspective. Br J Pharmacol. 2014. Jan;171(2):294–313. [DOI] [PMC free article] [PubMed] [Google Scholar]
- 33.Cai X, Wang H, Wang M, et al. A novel phosphorylation site on orexin receptor 1 regulating orexinA-induced GRK2-biased signaling. Cell Signal. 2020. Nov;75:109743. [DOI] [PubMed] [Google Scholar]
- 34.Milasta S, Evans NA, Ormiston L, Wilson S, Lefkowitz RJ, Milligan G. The sustainability of interactions between the orexin-1 receptor and beta-arrestin-2 is defined by a single C-terminal cluster of hydroxy amino acids and modulates the kinetics of ERK MAPK regulation. Biochem J. 2005. May 1;387(Pt 3):573–84. [DOI] [PMC free article] [PubMed] [Google Scholar]
- 35.Dalrymple MB, Jaeger WC, Eidne KA, Pfleger KD. Temporal profiling of orexin receptor-arrestin-ubiquitin complexes reveals differences between receptor subtypes. J Biol Chem. 2011. May 13;286(19):16726–33. [DOI] [PMC free article] [PubMed] [Google Scholar]
- 36.Thathiah A, Horré K, Snellinx A, et al. β-arrestin 2 regulates Aβ generation and γ-secretase activity in Alzheimer’s disease. Nat Med. 2013. Jan;19(1):43–9. [DOI] [PubMed] [Google Scholar]
- 37.Georgievska B, Sandin J, Doherty J, et al. AZD1080, a novel GSK3 inhibitor, rescues synaptic plasticity deficits in rodent brain and exhibits peripheral target engagement in humans. J Neurochem. 2013. May;125(3):446–56. [DOI] [PubMed] [Google Scholar]
- 38.Herring WJ, Ceesay P, Snyder E, et al. Polysomnographic assessment of suvorexant in patients with probable Alzheimer’s disease dementia and insomnia: a randomized trial. Alzheimers Dement. 2020. Jan 15;16(3):541–51. [DOI] [PMC free article] [PubMed] [Google Scholar]
- 39.Evans R, Kimura H, Alexander R, et al. Orexin 2 receptor-selective agonist danavorexton improves narcolepsy phenotype in a mouse model and in human patients. Proc Natl Acad Sci U S A. 2022. Aug 30;119(35):e2207531119. [DOI] [PMC free article] [PubMed] [Google Scholar]
- 40.De Boer P, Drevets WC, Rofael H, et al. A randomized Phase 2 study to evaluate the orexin-2 receptor antagonist seltorexant in individuals with insomnia without psychiatric comorbidity. J Psychopharmacol. 2018. Jun;32(6):668–77. [DOI] [PubMed] [Google Scholar]