

Abstract
During a critical period of postnatal life, monocular deprivation (MD) by eyelid closure reduces the size of neurons in layers of the dorsal lateral geniculate nucleus (dLGN) connected to the deprived eye and shifts cortical ocular dominance in favor of the non-deprived eye. Temporary inactivation of the non-deprived eye can promote superior recovery from the effects of long-term MD compared to conventional occlusion therapy. In the current study, we assessed the modification of neuron size in the dLGN as a means of measuring the impact of a brief period of monocular inactivation (MI) imposed at different postnatal ages. The biggest impact of MI was observed when it occurred at the peak of the critical period. Unlike the effect of MD, structural plasticity following MI was observed in both the binocular and monocular segments of the dLGN. With increasing age, the capacity for inactivation to alter postsynaptic cell size diminished but was still significant beyond the critical period. In comparison to MD, inactivation produced effects that were about double in magnitude, and exhibited efficacy at older ages. Notwithstanding the large neural alterations precipitated by MI, its effects were remediated with a short period of binocular experience, and vision through the previously inactivated eye fully recovered. These results demonstrate that MI is a potent means of modifying the visual pathway and does so at ages when occlusion is ineffective. The efficacy and longevity of inactivation to elicit plasticity highlights its potential to ameliorate disorders of the visual system such as amblyopia.
Keywords: monocular deprivation, monocular inactivation, dorsal lateral geniculate nucleus, visual cortex, tetrodotoxin, neural plasticity, critical period
Graphical Abstract
Monocular inactivation (MI) for 10 days elicits a reduction of neuron size in the binocular and monocular segments of dLGN layers serving the inactivated eye. In comparison to monocular occlusion, MI produced effects that were about double in magnitude and exhibited efficacy at older ages.
Introduction
An important factor in the early postnatal development of visual neural circuits is provision of normal binocular vision. Obstruction of clear and balanced vision during a formative and highly plastic stage of development, called the critical period, can produce a rearrangement of neural connections after which the visual system exhibits abnormal responses to visual stimulation. Following even a brief period of monocular deprivation (MD) by eyelid closure, physiological responses in the visual cortex skew in favor of the non-deprived eye, leaving the deprived eye able to control the activity of few cortical neurons (Wiesel and Hubel, 1963a; Hubel et al., 1977; Mioche and Singer, 1989). In cats and monkeys, the physiological shift in cortical ocular dominance elicited by MD is accompanied by anatomical modifications within binocular primary visual cortex (V1) that include a retraction of deprived-eye geniculostriate axon terminals (Shatz and Stryker, 1978; LeVay et al., 1980; Antonini and Stryker, 1993). This simplification of axons projecting to V1 correlates with a reduction in the volume of their parent somas in the dorsal lateral geniculate nucleus (dLGN) (Wiesel and Hubel, 1963b; Sesma et al., 1984). Because cell body shrinkage is only observed in regions of the dLGN serving the binocular visual field (the “binocular segment” of the nucleus), it is not believed to be a consequence of altered retinal (orthodromic) activity, per se. Rather, reduced soma size after MD is considered to be a retrograde reflection of interactions between converging inputs from the two eyes in binocular visual cortex (Wiesel and Hubel, 1963b; Guillery and Stelzner, 1970; Guillery, 1972; Casagrande et al., 1978). This interpretation is depicted in Figure 1 and is supported by the finding that molecular manipulations local to V1 that interfere with binocular competition and ocular dominance plasticity also prevent the effect of MD on cell size in the dLGN (Bear and Colman, 1990).
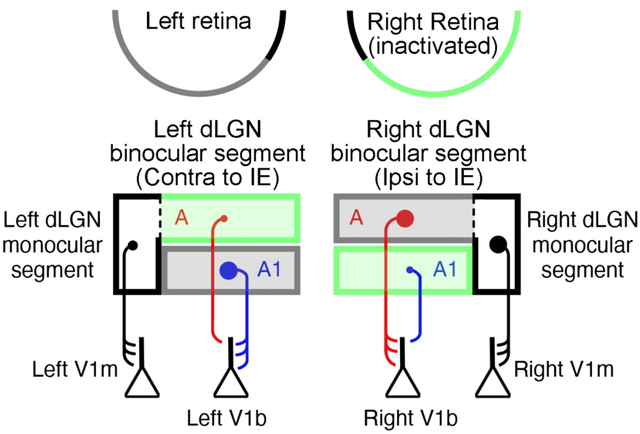
Figure 1.
Illustration of the cat primary visual pathway depicting the effect of MD on neurons in the dLGN and their projections to V1. Like monkeys and humans, layers of the cat dLGN are eye specific, each receiving input from either the left or right eye but not both. The more dorsal A layers of the dLGN receive input from the contralateral eye, while A1 layers receive input from the ipsilateral eye. Early in postnatal development, MD reduces the size of neuron somata within so-called binocular segments of deprived A and A1 layers (grey rectangles) relative to non-deprived counterparts (green rectangles). Axons of non-deprived and deprived dLGN neurons with spatially corresponding visual receptive fields, project to overlapping regions of V1 where they are subjected to binocular competition (V1b). The result of this competition is that deprived axons lose connections, resulting in less complex terminal fields compared to non-deprived counterparts. In contrast, neurons located within the so-called monocular segments of the dLGN (black rectangles), which are positioned on lateral flanks of the A layers (delineated by the dashed lines), are not subjected to binocular competition because they are spatially segregated from fellow-eye inputs in V1 (V1m). Therefore, unlike the binocular segment, deprived neurons within the monocular segment do not exhibit the same relative reduction in soma size. Illustration is based on data from Guillery and Stelzner (1970); Guillery (1972); Casagrande et al. (1978); Antonini and Stryker (1983).
The neural aberrations that arise from MD are thought to represent the core pathology of an accompanying visual impairment —deprivation amblyopia— that is characterized by a pronounced reduction in spatial acuity (Giffin and Mitchell, 1978) as well as loss of binocularity and stereopsis (Timney, 1983; Vorobyov et al., 2007). Reversal of the effects of MD is possible during the highly plastic critical period if the deprived eye is opened and the originally non-deprived eye is closed (Blakemore and Van Sluyters, 1974; Movshon, 1976), a procedure referred to as reverse occlusion that is analogous to human full-time patching for the treatment of amblyopia. As with patching, reverse occlusion applied at ages beyond the critical period when plasticity capacity is low has limited potential to elicit recovery from the structural and functional consequences of a prior MD (Wiesel and Hubel, 1965; Blakemore and Van Sluyters, 1974). This age-related recalcitrance to recovery is also observed in humans and is of particular concern for amblyopia produced by deprivation because of a more restricted window for recovery in comparison to other forms of the disorder (Birch and Stager, 1998; Holmes and Levi, 2018).
Recent mouse and cat studies have demonstrated that post-critical period recovery from MD can occur if the dominant eye’s retina is temporarily inactivated with intravitreal microinjection of tetrodotoxin (TTX), a voltage-gated sodium channel blocker that can reversibly eliminate retinal ganglion cell activity (Duffy et al., 2018; Fong et al., 2021). Following a period of MD, inactivation of the dominant (fellow) eye restores neural responses to the weaker one, and promotes recovery from the MD-induced atrophy of neuron soma size in the dLGN. Importantly, this recovery from the effects of MD occurs at an age when reverse occlusion is incapable of inducing significant recovery from the original deprivation event (Blakemore and Van Sluyters, 1974; Duffy et al., 2018). While the mechanisms that elicit recovery following inactivation remain unknown and are currently being explored, the superior efficacy of inactivation as a recovery strategy relative to occlusion therapy suggests that the two procedures are not equal in their impact on the visual system.
An objective of the current study was to investigate potential differences between these two therapeutic approaches: temporary form deprivation versus retinal inactivation. We chose to measure an anatomical hallmark of visual deprivation as a means of probing the impact of both procedures with an ultimate goal to provide insight into the superior efficacy of inactivation to promote neural recovery. One possibility is that monocular inactivation (MI) produces effects in the visual system that mirror those of MD but are simply greater in magnitude. An alternative possibility is that neural modifications elicited by the two forms of visual deprivation exhibit similarities but are on balance fundamentally different. This latter possibility is consistent with studies demonstrating that brief MD and MI have different impacts on ocular dominance and thalamocortical synaptic transmission and structure in visual cortex (Rittenhouse et al., 1999; Bear and Rittenhouse, 1999).
For over 50 years, measurement of neuron soma size within the cat dLGN has provided a reliable, robust, and sensitive means of assessing the impact of MD on the structure and function of neurons in the primary visual pathway (Wiesel and Hubel, 1963b; Guillery and Stelzner, 1970; Dürsteler et al., 1976; Kutcher and Duffy, 2007). In this study, we compared the effects of MD to those of retinal inactivation by measuring the magnitude and retinotopic location of modifications within the dLGN across different ages in development. The eye-specific lamination and retinotopic organization of the cat dLGN make it ideal for selective quantification of both magnitude and topography of neural changes elicited by the two forms of visual deprivation. Importantly, this experimental design enabled within-animal comparisons between affected and normal-eye layers that can subvert complications arising from issues such as high variability between animals (Guillery, 1973), and is particularly useful in studies using higher mammals where low subject numbers are typical.
Methods
Animals
Anatomical studies were conducted on 15 cats that were all born and raised in a closed breeding colony at Dalhousie University. Rearing and experimental procedures were conducted in accordance with protocols approved by the University Committee on Laboratory Animals at Dalhousie and that conformed to guidelines from the Canadian Council on Animal Care. Tissues from some of the animals in this investigation were collected for previous studies, and samples from these animals were obtained from our cat brain tissue bank. We examined dLGN slices from three groups of animals whose rearing histories are detailed in Table 1. Animals were reared with MD by eyelid closure (n=5; 3 males, 2 females), or with MI (n=8; 4 males, 4 females), or received MI followed by a period of binocular vision (n=2; 1 male, 1 female).
Table 1.
Animal Rearing Conditions
| Rearing Manipulations | ||||
|---|---|---|---|---|
| Normal | MD | Inactivation | BV | |
| MD | ||||
| n=2* | P0 – P30 | P30 – P44 | - | - |
| n=1* | P0 – P42 | P42 – P56 | - | - |
| n=2* | P0 – P70 | P70 – P84 | - | - |
| Inactivation | ||||
| n=3 | P0 – P30 | - | P30 – P40 | - |
| n=1 | P0 – P42 | - | P42 – P52 | - |
| n=2 | P0 – P70 | - | P70 – P80 | - |
| n=2 | P0 – P154 | - | P154 – P164 | - |
| Inactivation + BV | ||||
| n=2 | P0 – P70 | - | P70 – P80 | P80 – P90 |
Represents conditions for which tissue was acquired from our existing brain tissue bank. BV refers to binocular vision.
Tissues from animals in our MD groups were obtained from our brain bank and had the eyelids of one eye closed for 14 days starting either at postnatal day (P) 30, the peak for ocular dominance plasticity, or at later ages (P42 and P70) when the efficacy of MD to shift ocular dominance has diminished (Olson and Freeman, 1980). This 14-day MD duration was selected as it represented the closest available deprivation duration relative to our retinal inactivation group. The comparison group of animals had one eye inactivated for 10 days starting either at P30, P42, P70, or 22 weeks of age.
Monocular Deprivation
Animals were monocularly deprived under general gaseous anesthesia (3–4% isoflurane in oxygen) and the procedure involved closure of the upper and lower palpebral conjunctivae of the left eye with sterile 5–0 vicryl suture, followed by closure of the eyelids with 5–0 silk suture. Upon completion of the procedure, animals were administered Metacam (0.05 mg / kg) for post-procedure analgesia, local anesthesia was produced with application of Alcaine sterile ophthalmic solution (1% proparacaine hydrochloride; CDMV, Canada), and a broad-spectrum topical antibiotic (1% Chloromycetin; CDMV) was administered to mitigate infection after surgery. Quality of the eye closure was monitored daily to ensure the lids were in good health and fully closed.
Retinal Inactivation
Retinal inactivation was performed under general anesthesia with 3–4% isoflurane in oxygen. Consistent with our previous studies, animals had their right eye inactivated with intravitreal microinjection of TTX (ab120055; abcam, USA) that was solubilized in citrate buffer at 3mM. For each animal, dosage was scaled according to eye size (Thorn, 1976). We administered 0.5 μl of TTX per mm of vitreous chamber length. This approximate dosage blocks action potentials of affected cells without obstructing critical cellular functions such as fast axoplasmic transport (Ochs and Hollingsworth, 1971). Intravitreal injections were administered through a puncture made with a 30-gauge disposable sterile needle that produced a small hole in the sclera located at the pars plana. The measured volume of TTX solution was slowly dispensed into the vitreous chamber with a sterilized Hamilton syringe (Hamilton Company, USA) that had a fixed 30-gauge needle (point style 4). The needle was positioned through the original puncture and placed 5–10 mm into the chamber angled away from the lens. The total volume of TTX was dispensed slowly, then the needle was held in place for about a minute before it was retracted. Following intraocular injection, topical antibiotic (T-1%; Aventix, Canada) and anesthetic (Alcaine) were applied to the eye to prevent post-injection complications. Metacam (0.05 mg / kg) was administered for post-procedure analgesia. To achieve 10 days of retinal inactivation, animals received 5 injections, one every 48 hours, and for each injection the original puncture site was used to avoid having to make another hole. During the period of inactivation we confirmed inactivation by noting anisocoria due to pupil dilation in the inactivated eye, absence of a pupillary light reflex, and the lack of visuomotor behaviors such as visual placing, visual startle, and the ability to track a moving laser spot using the inactivated eye. These assessments were made while vision in the non-injected eye was briefly occluded with an opaque contact lens.
Sample Preparation for Histology
In preparation for histology, animals were euthanized with a lethal dose of sodium pentobarbital (Pentobarbital Sodium; 150 mg/kg) and shortly after were exsanguinated by transcardial perfusion with approximately 150 ml of phosphate buffered saline (PBS) followed by an equal volume of PBS containing 4% dissolved paraformaldehyde. Brain tissue was immediately extracted and the thalamus was dissected from the remainder of the brain in order to prepare the dLGN for sectioning and histological processing. Tissue containing the dLGN was cryoprotected, then was cut coronally into 25-μm thick sections using a sliding microtome. Some of the sections obtained from our brain bank were cut at 50 μm. Tissue slices were stored at −20 degrees Celsius within an antigen preservative solution (Burke et al., 2009) until used for the study. Tissues examined in this study were all subjected to the same extraction and preparation procedures, the same storage settings, and sections from all animals were stained following the same protocol.
Nissl Staining
For each animal, 6 sections containing the left and right dLGN were mounted onto glass slides and stained with a 1% Nissl solution (ab246817; Abcam, USA). Stained sections were differentiated in 70% ethanol, then were dehydrated in a graded series of ethanols before clearing with Histo-Clear. Sections were then coverslipped with mounting medium (Permount; Fisher Scientific, Canada) and allowed to dry before microscopic evaluation.
Anatomical Quantification
Measurements in this study were performed blind to each animal’s rearing condition. The cross-sectional area of neuron somata within A and A1 layers of the left and right dLGN was measured from Nissl-stained sections using the nucleator probe available on a computerized stereology system (newCAST; VisioPharm, Denmark). All area measurements were performed using a BX-51 compound microscope with a 60X oil-immersion objective (Olympus; Canada). Neurons were distinguished from glial cells using established selection criteria (Wiesel and Hubel, 1963a; Guillery and Stelzner, 1970) that included measurement of cells with dark cytoplasmic and nucleolar staining, and with light nuclear staining (Duffy et al., 2012). Adherence to these criteria permitted avoidance of cell caps and ensured that measurements were taken from neurons cut through the approximate somal midline. Approximately 500–1000 neurons were measured from each animal. Assessments and measurements of the dLGN were made from sections that spanned coronal plane 6–7 (Sanderson, 1971), which is positioned about midway along the anterior-posterior axis of the nucleus.
The impact of MD and MI was calculated using an ocular dominance index (ODI) that we have used previously (Duffy et al., 2014), and that revealed the percentage difference between eye-specific dLGN layers:
| (1) |
An illustration of the basic anatomy of cat primary visual pathway and its response to MD is shown in Figure 1. Statistical comparisons between eye-specific layers in each condition were made by treating the mean soma size of each layer as a single observation, then employing an unpaired (one-tailed) t-test to determine if affected neurons were smaller in size from those serving the normal eye. An exponential decay curve was used to characterize the effect of MI across age, and a Pearson product-moment correlation coefficient was used to calculate the goodness of fit.
Physiology: Visually-Evoked Potentials (VEPs)
All VEP recordings were conducted on anesthetized animals with full-field visual stimuli presented on an LCD monitor in the binocular visual field at a viewing distance of 70 cm. In preparation for each recording session, animals were anesthetized with 1–1.5% isoflurane, and supplemental sedation was provided with intramuscular acepromazine (0.06–0.1mg/kg). Hair on the head was trimmed and a disposable razor was used to shave parts of the scalp where recording sites were located, two positioned approximately 2–8 mm posterior and 1–4 mm lateral to interaural zero over the presumptive location of the left and right primary visual cortices, and another site over the midline of the frontal lobes that acted as a reference. Electrode sites were abraded with Nuprep EEG skin preparation gel (bio-medical, MI, USA), and were then cleaned with alcohol pads. Reusable 10 mm gold cup Grass electrodes (FS-E5GH-48; bio-medical) were secured to each electrode site using Ten20 EEG conductive paste (bio-medical, USA) that was applied to the scalp. Impedance of the recording electrodes was measured in relation to the reference electrode to ensure values for each were below 5 kΩ. Electrophysiological signals were amplified and digitized with an Intan headstage (RHD2132; 20kHz sampling frequency), then recorded using an Open Ephys acquisition board and GUI software (Open Ephys, USA)(Siegle et al., 2017). Stimuli were generated with custom software developed in Matlab using the Psychophysics Toolbox extension (Brainard, 1997; Pelli, 1997), and consisted of full contrast square wave gratings with a 2 Hz contrast reversal frequency (Bonds, 1984; Norcia et al., 2015; Pang and Bonds, 1991). Blocks of grating stimuli at different spatial frequencies (0.05, 0.1, 0.5, and 1 cycle per degree (cpd)) or a luminance-matched grey screen were presented in pseudo-random order for 20 seconds each, with the grey screen also displayed during a 2 second interstimulus interval. Each block was repeated at least 6 times. Each eye was tested in isolation by placing a black occluder in front of the other eye during recording. Eyes were kept open with small specula, and the eyes were frequently lubricated with hydrating drops. Recording sessions lasted about 1 hour and animal behavior was observed for at least an additional hour post-recording to ensure complete recovery.
Physiological Quantification
The raw electroencephalogram was imported to MATLAB where it was high-pass filtered above 1 Hz, then subjected to Fourier analysis (Bach and Meigen, 1999; Norcia et al., 2015). The magnitude of VEPs was calculated as the sum of power at the stimulus fundamental frequency plus 6 additional harmonics (2–14 Hz; DiCostanzo et al., 2020). Baseline non-visually driven activity was calculated as the sum of power at frequencies 0.2 Hz offset from the visual response (2.2–14.2 Hz). To assess possible differences in VEP power for each eye across experimental conditions, a repeated measures ANOVA was employed using Holm-Sidak’s multiple comparisons test treating measurements from the right and left V1 across 0.05 cpd and 0.1 cpd stimuli as single observations.
Results
We started our investigation by examining the effect of a 14-day MD within the dLGN across different postnatal ages, against which our inactivation conditions were to be compared. This duration of MD was selected as a comparison to the effect of 10 days of MI because among our brain bank samples this period of MD, while slightly longer, was the closest match. Imposition of a 14-day MD starting at the peak of the critical period produced a marked reduction in the size of neurons within deprived layers of the binocular segment of the dLGN (Figure 2a). Deprived neurons appeared obviously smaller than non-deprived counterparts only within the binocular segment (Figure 2b,c), where axons of neurons serving the left and right eye are subjected to competition at the level of V1 (Guillery, 1972). Within the laterally-positioned monocular segment of the A layers, where neurons project to the monocular crescent representation of V1, there was no apparent difference between non-deprived and deprived soma size (Figure 2d,e). Stereological quantification of neuron cross-sectional soma area measured from the binocular segment revealed that deprived neurons (mean = 190μm2; SD = 9μm2) were 25% smaller than non-deprived neurons (mean = 253μm2; SD = 14μm2; Figure 2f), and this difference was significant (t = 7.498, d.f. = 6, p < 0.001). However, within the monocular segment, deprived (mean = 185μm2; SD = 13μm2) and non-deprived (mean = 195μm2; SD = 12μm2) neurons were different by only 5% (Figure 2g) and this was not a statistically significant difference (t = 0.847, d.f. = 2, p > 0.05). These effects of MD are congruent with the results of Guillery and Stelzner (1970), which are summarized in the illustration of the cat primary visual pathway shown in Figure 1.
Figure 2.

The impact of a 14-day MD imposed at or beyond the critical period peak. Low magnification view of the left dLGN stained for Nissl substance from an animal that received 14 days of MD at 4 weeks of age (a) revealed a reduction of neuron soma size within the deprived layer (black arrow) compared to the non-deprived layer (white arrow). At higher magnification the difference between deprived eye (DE) and non-deprived eye (NDE) neuron size was evident in the binocular segment of the dLGN (b,c) but not within the monocular segment (d,e). Quantification of neuron soma area revealed a 25% reduction in the size of deprived neurons within the binocular segment (f), but this effect did not extend into the monocular segment where eye-specific neurons were comparable in size (g). A much smaller effect on dLGN cell size was observed when 14 days of MD was imposed at 10 weeks of age (h), and this was reflected by observation at higher magnification with no obvious alteration in neuron soma size within either the binocular (i,j) or monocular (k,l) segments. These observations were supported with quantification that revealed a diminished impact on neuron size in the binocular segment (m), and no effect in the monocular segment (n) when MD occurred at 10 weeks of age. Scale bars = 1 mm (a, h) and 50 μm (b-e and i-l). Red and blue data points indicate measurements from A and A1 layers, respectively. Asterisks in a and h indicate location of the monocular segment in the A layers. The timing of MD is shown in the lower right of panel a and h. Double asterisks indicate statistical significance below 0.05.
When the same 14-day MD was imposed later in development, at 10 weeks of age, we observed a smaller effect in the dLGN (Figure 2h). At this older age, deprived neurons within the binocular segment were only slightly smaller than non-deprived neurons (Figure 2i,j), and no difference in size was noted for neurons located within the monocular segment (Figure 2k,l). Quantification of neuron soma size reflected our observation that at 10 weeks of age, MD for 14 days had a reduced effect within the binocular segment (deprived: mean = 213μm2, SD = 23μm2; non-deprived: mean = 228μm2; SD = 20μm2; Figure 2m), and no effect within the monocular segment (deprived: mean = 184μm2, SD = 13μm2; non-deprived: mean = 183μm2; SD = 12μm2; Figure 2n). The difference between deprived and non-deprived neuron size within the binocular segment was 7% but not significantly different (t = 1.236, d.f. = 10, p > 0.05), and deprived and non-deprived neurons within the monocular segment were different by only 1% and also was not significantly different (t = 0.096, d.f. = 4, p > 0.05). These results demonstrated that at this older age, MD had a diminished and insignificant impact on the size of dLGN neurons.
The effect of monocular retinal inactivation was quantitatively and qualitatively different than that produced by MD. Retinal inactivation for 10 days that began at the critical period peak produced an obvious alteration within dLGN layers connected to the inactivated eye, and this was clearly visible at low magnification in the two animals we examined (Figure 3a–d). Within the binocular segment (Figure 3e,f), inactivated layers contained Nissl-stained neurons that were 44% smaller (mean = 156μm2, SD = 16μm2) and expressed a pale appearance relative to neurons located within normal-eye layers (mean = 278μm2, SD = 22μm2). In striking contrast to what was observed after MD, neurons within the monocular segment serving the inactivated eye were also noticeably smaller (mean = 184μm2, SD = 24μm2) and more pale in comparison to counterparts from the normal-eye layers (mean = 229μm2, SD = 20μm2; Figure 3g,h). Whereas after MD there was no soma size difference between deprived and non-deprived neurons within the monocular segment, following 10 days of MI we observed that inactivated-eye neurons were distinctly smaller than normal-eye neurons, which was quantified as a 20% difference. The observed reduction of soma size after inactivation was statistically significant for both the binocular (t = 11, d.f. = 10, p < 0.001) and monocular (t = 2.5, d.f. = 4, p < 0.05) segments (Figure 3i,j).
Figure 3.

The effect of 10 days of MI imposed at 4 weeks of age, the peak of the critical period. Microscopic inspection of the left and right dLGN from two animals revealed a substantial loss of Nissl staining within layers serving the inactivated eye (IE; black arrows in a-d) relative to those serving the normal eye (NE; white arrows in a-d), and this effect was accompanied by a sizable reduction of neuron soma area within inactivated-eye layers of both the binocular (e,f) and monocular (g,h) segments. Stereological quantification of neuron soma area confirmed these observations by showing that inactivated-eye neurons were 44% smaller than those serving the normal eye within the binocular segment (i), which was about double the effect size in comparison to MD. Distinct from the effects of MD, MI rendered inactivated-eye neurons 20% smaller within the dLGN’s monocular segment (j). Scale bars = 1 mm (a-d) and 50 μm (e-h). Red and blue data points indicate measurements from A and A1 layers, respectively. Asterisks in a-d indicate location of the monocular segment in the A layers. The postnatal timing of MI is shown in the lower right of panel a and c. Double asterisks indicate statistical significance below 0.05.
As we increased the age at which MI began, its impact on neuron size within the dLGN was reduced. Although ten days of inactivation started at 10 weeks of age had a noticeable effect on soma size in the two animals we examined (Figure 4a–d), the effect was diminished in comparison to what was observed when the same period of inactivation occurred at 4 weeks of age. At 10 weeks of age, neurons within the binocular segment connected to the inactivated eye were clearly smaller but did not exhibit the obvious staining pallor that was observed after inactivation at the critical period peak (Figure 4e,f). Within the monocular segment, a reduction of soma size was likewise evident within inactivated-eye layers; however, the effect magnitude did not appear to be as reduced by age (Figure 4g,h). In other words, unlike the binocular segment, inactivated-eye neurons within the monocular segment showed only a slight reduction in effect magnitude in comparison to that measured following inactivation at the critical period peak. Quantification of soma area supported these observations by showing that inactivated-eye neurons in the binocular segment were rendered 23% smaller (inactivated: mean = 207μm2, SD = 3μm2; normal: mean = 272μm2; SD = 18μm2; Figure 4i), which was about matched in magnitude by the monocular segment that showed an 18% difference in soma size (inactivated: mean = 202μm2, SD = 5μm2; normal: mean = 249μm2; Figure 4j). The measured reduction of neuron soma size was statistically significant for both the binocular (t = 7.242, d.f. = 10, p < 0.001) and monocular (t = 6.453, d.f. = 2, p < 0.05) segments. These results indicated that with increasing age the effect of MI was reduced in magnitude, but the effect was still considerably larger than that elicited by a similar period of MD imposed at the same age. That the impact of inactivation was similar between the binocular and monocular segments suggests that the effect at this age was not driven by competition between geniculocortical afferents serving the two eyes.
Figure 4.

The impact of 10 days of MI started at 10 weeks of age when MD has a negligible effect on dLGN cell size. Examples of Nissl staining in the right and left dLGN from two animals (a-d) revealed a noticeable difference in layers serving the inactivated eye (black arrows in a-d) relative to those of the normal eye (white arrows in a-d). This was better appreciated at higher magnification, which showed that neurons were smaller within inactivated-eye (IE) layers compared to those of the normal eye (NE). This difference in neuron size was apparent in both the binocular (e,f) and monocular (g,h) segments. Quantification of neuron soma area supported these observations by showing that inactivated-eye neurons within the binocular segment were 23% smaller than those serving the normal eye (i), and 18% smaller within the monocular segment (j). Scale bars = 1 mm (a-d) and 50 μm (e-h). Red and blue data points indicate measurements from A and A1 layers, respectively. Asterisks in a-d indicate location of the monocular segment in the A layers. The postnatal timing of MI is shown in the lower left of panel a and c. Double asterisks indicate statistical significance below 0.05.
The oldest animals in this study had one eye inactivated for 10 days starting at 22 weeks of age (Figure 5). In the two animals examined, ten days of MI at this age produced an effect on soma size that was not easily appreciated at low magnification (Figure 5a–d). Even at high magnification, the effect of MI was not as obvious as it was at the younger ages we examined, and this was true for both the binocular (Figures 5e,f) and monocular (Figures 5g,h) segments that were not appreciably different. Stereological quantification of soma size matched our qualitative observations by showing a small difference between eye-specific neurons within the binocular (Figure 5i) and monocular (Figure 5j) segments. Neurons within inactivated-eye layers of the binocular segment (mean = 241μm2, SD = 13μm2) were 10% smaller than neurons in normal-eye layers (mean = 269μm2, SD = 17μm2), and this was a statistically significant difference (t = 2.59, d.f. = 6, p < 0.05). A similar result was obtained from the monocular segment where neurons were different by 8% (inactivated: mean = 229μm2, SD = 10μm2; normal: mean = 250μm2, SD = 9 μm2); however, this did not achieve statistical significance (t = 2.237, d.f. = 2, p > 0.05).
Figure 5.

The consequence of 10 days of MI started at 22 weeks of age when the classical critical period has passed. Low magnification examples of Nissl staining within the right and left dLGN from two animals (a-d) revealed a minor change within the layers serving the inactivated eye (black arrows in a-d) compared to layers serving the normal eye (white arrows in a-d). At higher magnification it was obvious that neurons were only slightly smaller within inactivated-eye (IE) layers compared to those serving the normal eye (NE), which was evident within both the binocular (e,f) and monocular (g,h) segments. Quantification of neuron soma area mirrored these observations by showing that inactivated-eye neurons in the binocular segment were only 10% smaller than those serving the normal eye (i), and within the monocular segment the difference was similar at 8% (j). Scale bars = 1 mm (a-d) and 50 μm (e-h). Red and blue data points indicate measurements from A and A1 layers, respectively. Asterisks in a-d indicate location of the monocular segment in the A layers. The postnatal timing of MI is shown in the lower right of panel a and c. Double asterisks indicate statistical significance below 0.05.
To illustrate the impact of imposing 10 days of MI at different postnatal ages, we plotted the percentage difference in soma size between inactivated and normal-eye dLGN layers for the binocular and monocular segments across the ages examined (Figure 6). Within the binocular segment, there was a progressive decline in the effect of retinal inactivation with increasing age (Figure 6a). From the peak of the critical period to 22 weeks of age, the effect of inactivation was reduced by about 75%, from an average effect size of 44% down to 10%. Notably, even at 22 weeks of age, the oldest age we examined, a small residual effect of inactivation was observed. The decline in susceptibility to MI with age was well characterized by an exponential decay curve (R2 = 0.97). The effect of MI was consistently about double the magnitude of that produced by MD within the binocular segment. The effect of inactivation within the monocular segment was also reduced with age (Figure 6b), and the data were also fit with an exponential decay curve (R2 = 0.72). Diminution of the effect of MI with increasing age was less in the monocular segment compared to the binocular segment, which was based on the observation that effect magnitude in the monocular segment at 4 and 10 weeks of age was similar. Animals subjected to MD showed a negligible or no effect of MD in the monocular segment across the ages examined. In aggregate, results from our MI groups highlight distinct differences from MD that include an abiding efficacy to elicit cell size changes at older ages, as well as an ability to produce alterations within the monocular segment of the dLGN.
Figure 6.

The effect of a fixed duration of MI imposed at different ages across postnatal development. Within the binocular segment, the effect of 10 days of MI (filled circles) was clearly reduced with age (a). Between 4 and 22 weeks of age, there was a 75% reduction in the efficacy of inactivation, though, importantly, a small effect still remained even at the oldest age examined. In comparison to MD (open circles), MI elicited greater change within the dLGN, yielding effects that were about double in magnitude. Within the monocular segment (b), the impact of MI was likewise reduced with age but less so in comparison to the binocular segment. A clear distinction between the effect of MD and MI was also observed within the monocular segment: whereas the size of neurons in the monocular segment exhibit little change with MD, MI had an effect on neuron size even at the oldest age examined. Subtraction of the differences in ODI within the monocular segment from the differences in the binocular segment revealed that the developmental profiles for MD and MI groups were similar (c), suggesting the effect of MD and MI mediated by binocular competition is comparable.
Whereas MD applied at 10 weeks of age produced only a small change in the dLGN, MI applied at this age reduced soma size significantly, and by an amount that was comparable across the binocular and monocular segments. Uniformity of the response across segments raises the possibility that the effect of MI at this age is driven by something other than binocular competition. Indeed, when we subtracted the observed differences in ODI within the monocular segment (possibly related to diminished trophic support from the retinogeniculate afferents) from the differences in the binocular segment (that include the additive retrograde effect of binocular competition in visual cortex), the developmental profiles for MD and MI groups were similar (Figure 6c). This comparison is thought to isolate the effect of binocular competition (Sherman and Spear, 1982), and therefore showed that MI and MD are comparable in this regard, despite substantial differences in the level of retinal ganglion cell activity. On the other hand, the interruption of supposed retinogeniculate trophic influence is clearly different between MD and MI, as evidenced by the significant effect observed in the monocular segment with MI.
Just as an inactive muscle fiber rapidly recovers size when the temporarily silenced motoneuron activity is restored, we next sought to understand if dLGN cell size changes ascribed to reduced retinal activity is similarly transient and reversible. In previous studies, we demonstrated that fellow-eye retinal inactivation applied at 10 weeks of age can promote recovery from the effects of a prior long-term MD, and critically the inactivation produced no lasting detriment to the inactivated eye or to the dLGN layers connected to it (Duffy et al., 2018; Fong et al., 2021; DiCostanzo et al., 2020). We therefore examined reversibility of retinal inactivation on dLGN cell size changes by providing a subset of animals with binocular vision (10 days) after they received 10 days of retinal inactivation applied at 10 weeks of age. After allowing the period of inactivation to wear off, layers of the dLGN connected to the previously inactivated eye had a normal appearance with no evidence of neuron atrophy within inactivated-eye layers (Figure 7a–d). These observations were confirmed with high magnification images that showed comparable staining characteristics between eye-specific layers within the binocular (Figure 7e,f) and monocular (Figure 7g,h) segments of the dLGN. Quantification of soma size indicated that the change in neuron size elicited by MI at 10 weeks of age (shown in Figure 4) was erased with provision of 10 days of binocular vision. Within the binocular segment, there was only a 5% difference in the size of neurons (inactivated: mean = 247μm2, SD = 24μm2; normal: mean = 260μm2, SD = 29; Figure 7i), and this was not a statistically significant difference (t = 0.674, d.f. = 6, p > 0.05). Similarly, only a 4% difference in neuron soma size was observed within the monocular segment, which also was not significantly different (inactivated: mean = 227μm2, SD = 10μm2; normal: mean = 236μm2, SD = 9; t = 0.068, d.f. = 2, p > 0.05; Figure 7j). These results indicate that the effect of MI on dLGN soma size is ephemeral, at least when it is administered at an age beyond the critical period peak.
Figure 7.

Recovery from the effects of 10 days of MI applied at 10 weeks of age. Examples of Nissl staining in the right and left dLGN from two animals (a-d) that received MI followed by 10 days of binocular vision (BV) revealed no obvious difference in layers serving the previously inactivated eye (black arrows in a-d) relative to those of the normal eye (white arrows in a-d). Previously inactivated layers (IE) contained neurons that were comparable in size to those within layers serving the normal eye (NE), which was evident at high magnification for both the binocular (e,f) and monocular (g,h) segments. Quantification of neuron soma area revealed balance between the eye-specific layers that was comparable to normal (Fong et al., 2016), and this was true for measurements from the binocular (i) and monocular (j) segments. This indicates that the modification provoked by MI at 10 weeks of age is temporary, and resolves with a short period of binocular vision. Scale bars = 1 mm (a-d) and 50 μm (e-h). Red and blue data points indicate measurements from A and A1 layers, respectively. The postnatal timing of MI is shown in the lower right of panel of a and c.
From the same group of animals that received binocular vision following MI, we measured VEPs from V1 in response to grating stimuli over a range of spatial frequencies. Consistent with our anatomical results, there was a complete recovery of visual responses after the period of inactivation wore off and animals were provided binocular vision. Graphs at the top of Figure 8 display data from the left hemisphere of an example animal in which balanced visual responses were measured between the eyes before the right eye was inactivated for 10 days (Figure 8a,b). On the tenth day of right eye inactivation (c-d), measurements revealed that VEP power (trace with black circles) was obliterated only through the inactivated eye (Figure 8c,d), and responses from this eye were reduced to baseline levels (trace with open circles). VEPs elicited through the formerly inactivated eye were restored to normal when 10 days of binocular vison was provided after the period of inactivation (Figure 8e), and these responses were in balance with VEPs elicited from the other eye (Figure 8f).
Figure 8.

Measurement of VEPs elicited by separate stimulation of the left and right eye before, during, and after 10 days of right eye inactivation. For each graph in a-f, spatial frequency is plotted on the abscissa, and the summed power from the Fourier analysis is plotted on the ordinate. The trace containing solid black circles represents the sum of visually-evoked power, while the trace with open circles shows the non-visual baseline power. Visually-evoked power elicited by a grey screen served as a control, and should be about equal for the two traces. Data are shown for an example animal in which VEP power from the left and right eye are balanced (traces with black circles) prior to any visual manipulation (a,b). VEPs power measured during right-eye inactivation was reduced to baseline levels for that eye, while responses elicited from the left eye remained high (c,d). VEP power from the same animal is shown after it was provided 10 days of binocular vision following the period of MI (e,f). Restoration of normal-appearing VEPs were measured for the previously inactivated eye after the period of binocular vision, and this was in balance with VEP power measured from the left eye. The balance of VEPs measured between the eyes was calculated using an ocular dominance index (ODI), which indicates the percentage difference between eyes and is displayed in the upper right corner of the right eye graph (b,d,f). VEP power measurements were plotted for the left (g) and right (h) eye before (Pre-TTX), during (TTX), and after (Post-TTX) right eye inactivation for 10 days. While left eye VEP power remained unchanged across conditions, VEP power for the right eye was significantly reduced during the period of inactivation but recovered to normal levels with provision of binocular vision. Squares and circles represent data from separate animals; green and magenta represent left and right visual cortex, respectively; solid and half symbols represent data from 0.05 cpd and 0.1 cpd grating stimuli, respectively.
We next plotted VEP power measurements separately for the left (Figure 8g) and right (Figure 8h) eye for both animals before, during, and after inactivation of the right eye. VEP power that was measured from the normal left eye before inactivation was unchanged during or after the period of inactivation ((F(3,8) = [0.805], p = 0.418); Figure 8g). Inactivation of the right eye significantly reduced VEP power relative to pre-inactivation levels ((F(3,8) = [42.22], p < 0.001; multiple comparison post-hoc test: p < 0.001; Figure 8h). The reduction of VEP power elicited through the inactivated eye recovered following 10 days of binocular vision and was not different from VEP power measured before inactivation was imposed (multiple comparisons post-hoc test: p = 0.639). It is worth pointing out that the restoration of normal dLGN soma size and the recovery of VEPs after inactivation occurred at an age (i.e., 10 weeks old) when inactivation of the fellow eye can promote full recovery from the anatomical and physiological effects of long-term MD (Duffy et al., 2018; Fong et al., 2021). The current findings indicate that the modifications elicited by inactivation do not to have a lasting negative impact on the structure or function of the visual system, and instead appear to elicit a constellation of modifications that avail an opportunity for recovery from the neural modifications produced by amblyogenic rearing.
Discussion
In the first part of this study, we compared the effect of monocular lid closure to monocular retinal inactivation as a means of assessing their respective capacities to elicit a change in soma size within the dLGN across development. Retinal inactivation for 10 days consistently produced a larger effect compared to lid closure, and this was observed at all the ages we examined. Even at ages beyond the critical period peak when MD produces little or no effect in the dLGN, MI modified soma size postsynaptic to silenced retinal ganglion cells. In addition, at all ages examined, inactivation led to cell shrinkage within both the binocular and monocular segments. This observation agrees with findings from Kuppermann and Kasamatsu (1983) who obtained similar results in cats after 1 week of inactivation imposed at 7 weeks of age. Thus, inactivation is qualitatively different from MD because the latter has a negligible effect on the size of neurons within the monocular segment (Guillery and Stelzner, 1970; Hickey et al., 1977). This is noteworthy because it indicates that the mechanisms inducing a change in soma size between these two forms of deprivation are not identical. Moreover, despite the magnitude and breadth of the acute effects of MI, we found that the impact of inactivation can be temporary. This was determined after examining 10-week-old animals that were provided a period of binocular vision after 10 days of inactivation. At this age, the effects of retinal inactivation in the dLGN and V1 were erased a short time after the influence of TTX wore off.
Monocular retinal inactivation with TTX is known to produce a variety of neuroanatomical changes within the primary visual pathway of adult cats and monkeys. In monkey V1, loss of microtubule-associated protein occurs within ocular dominance columns that associate with the inactivated eye (Hendry and Bhandari, 1992). Loss of gamma ammino-butyric acid (GABA) and its synthesizing enzyme, glutamic acid decarboxylase (GAD), is evident within inactivated-eye ocular dominance columns of monkey V1 (Hendry and Jones, 1988), as well as within layers of the dLGN that serve the inactivated eye (Hendry and Miller, 1996). In both cats and monkeys, oxidative metabolism revealed by cytochrome oxidase staining is reduced within inactivated-eye layers of the dLGN and V1 ocular dominance columns that serve the inactivated eye (Wong-Riley and Riley, 1983; Wong-Riley and Carroll, 1984). In tree shews and macaques, MI reduces expression of the immediate early gene c-fos within LGN layers serving the inactivated eye, and also within V1 contralateral to the inactivated eye (Takahata and Kaas, 2017; Takahata et al., 2008). The loss of cytochrome oxidase staining and c-fos expression can occur quickly, being evident even within 24 hours after MI onset (Wong-Riley and Carroll, 1984; Takahata and Kaas, 2017), and for cytochrome oxidase becomes more pronounced as the period of inactivation is extended. Findings from the current study, in agreement with those from Kuppermann and Kasamatsu (1983), demonstrate that MI significantly reduces dLGN cell size within layers connected to the affected eye. The effect of MI is evident within both the binocular and monocular segments, which distinguishes it from MD because the latter produces alterations only within the binocular segment. Therefore, the effect of MI is unlikely to be explained by a competitive imbalance between the eyes because it is observed within the monocular segment where geniculostriate axons serving the inactivated eye are not subjected to competition with those from the fellow eye. This raises the possibility that the effects of MI on the dLGN are catalyzed directly by an antecedent loss of tonic retinal ganglion cell activity.
A distinction between MI and MD is also evident in their respective capacities to evoke expression of immediate early genes in V1 of monkeys. Within several hours of MI, zif268 and c-fos expression are upregulated in ‘border stripes’ that adhere to the edges of non-inactivated ocular dominance columns of layer 4C, and this pattern is not observed after an equivalent duration of MD (Takahata et al., 2009). MI also significantly reduces expression of zif268 and c-fos within layer 4C ocular dominance columns serving the inactivated eye, which is not observed in MD monkeys that exhibit persistent expression of these immediate early genes across columns in layer 4C (Horton and Hocking, 1998; Takahata et al., 2009). The uniform expression across ocular dominance columns after MD likely reflects the residual spontaneous activity of retinal ganglion cells during MD that is lost during MI, therefore resulting in reduced expression in regions of layer 4C serving the inactivated eye.
A possible contributor to the postsynaptic somatic changes induced by inactivation may be modification of trophic support provided by the retina. Trophic support of dLGN neurons is contributed by selective anterograde transport of neurotrophins from the retina in an activity-dependent manner (Caleo et al., 2000). The anterograde transport and release of brain-derived neurotrophic factor (BDNF) from retinal ganglion cells can elicit expression of immediate early genes (c-fos and zif268) within target neurons of the dLGN (Caleo et al., 2000). In cats, MI for 2 days with intravitreal microinjection of TTX significantly lowers BDNF levels within layers of dLGN, as well as in V1 ocular dominance columns serving the inactivated eye (Lein and Shatz, 2000). Although it is widely thought that deprivation-induced ocular dominance plasticity is cortically mediated, augmenting levels of retinal BDNF depleted by visual deprivation can mitigate the typical cortical effects of MD (Mandolesi et al., 2003), indicating a possible role for the retina to influence neural plasticity throughout the primary visual pathway. It therefore seems possible that the shrinkage of cells in the dLGN following MI may involve a reduction of trophic support from the retina, which would presumably affect the binocular and monocular segments equally. The effect of inactivation observed in the current study was clearly reduced with age, which implies that the dependence of dLGN neurons on activity-dependent trophic support is likewise regulated by age. Irrespective of the exact mechanisms involved, that MI retained potency to evoke a change in cell size at older ages than is possible with MD suggests that it adheres to a longer-lasting critical period.
By comparing the effects in the monocular and binocular segments of the nucleus we were able to parse the effect of binocular competition from activity-dependent trophic support of dLGN neurons (Figure 6c). Despite the dramatic imbalance in activity between the two eyes caused by 10 days of MI, it failed to produce a greater competitive effect on cell size in the binocular segment than a comparable period of MD. It is of interest to compare this finding with previous studies in three species (cat, mouse, rat), using four different measures of plasticity (single units, VEPs, intracellular recordings, and synaptic ultrastructure), that concluded that the impact of brief MI is actually less severe than a comparable period of MD by lid closure (Rittenhouse et al., 1999; Frenkel and Bear, 2004, Coleman et al., 2010; Iurilli et al., 2012). We think the likely explanation relates to differences in the duration of inactivation; that is, we are observing an asymptotic effect of 10 days of MI in the current study that had not yet been achieved in the earlier work. Taken together, the available data suggest that residual noise in the retina deprived of form vision during MD accelerates the loss of visual responsiveness in the cortex, but is not obligatory for it. It will be of interest in future studies to compare the effects of different durations of MD and MI on dLGN activity and cell size.
In further consideration of the effects produced by MD and MI, it is worth noting that the procedures deprive different visual characteristics that may contribute to their respective capacities to elicit neural modifications. For instance, whereas MD by lid closure deprives fine detail patterned vision, MI deprives all visual output from the silenced eye, which in addition to patterned vision would affect detection of visual motion. Such a distinction may contribute to the larger impact of MI, and may also relate to its effects occurring within the binocular and monocular segments of the dLGN. The later-occurring effects of MI may in part derive from deprivation of such visual characteristics. For instance, contrast-defined motion processing maintains a sensitivity to visual deprivation later than that of ocular dominance (Zapasnik and Burnat, 2013).
Monocular retinal inactivation in the youngest animals we examined produced an effect in the dLGN binocular segment that was about double the magnitude of what was measured in the monocular segment (Figure 6). However, at older ages the size of the inactivation effect in the binocular segment was about the same as that measured in the monocular segment. In accordance with Sherman and Spear (1982), a combination of binocular competition and noncompetitive mechanisms is proposed when neural abnormalities occur within both dLGN segments but are more severe in the binocular segment. When abnormalities are equally severe in both segments, a noncompetitive mechanism is suggested. Therefore, the larger inactivation effect we observed in the dLGN binocular segment at younger ages near the critical period peak may originate from a combined influence of cortically-mediated binocular competition between eye inputs, in conjunction with noncompetitive mechanisms that may include a modification of trophic influence from the retina. The comparable effect magnitude that was measured between the binocular and monocular segments when inactivation occurred at older ages suggests that the effect of inactivation later in development derives from noncompetitive mechanisms that might reasonably be attributed to loss of tonic retinal activity.
When MI occurred at 10 weeks of age, its impact on dLGN cell size was significant and comparable to that elicited by an equal duration of MD imposed at the peak of the critical period (Kutcher and Duffy, 2007). Notwithstanding this large effect, subsequent provision of a short duration of binocular vision was sufficient to reverse the atrophy of cells. Likewise, inactivated-eye VEPS that were reduced to baseline during the period of inactivation, returned to normal a short duration after the final TTX injection. Even when MI occurs at 7 weeks of age, a time when plasticity capacity is quite high, the effect of MI on dLGN soma size recovers with subsequent binocular vision (Kuppermann and Kasamatsu, 1983). Within the primary visual pathway of cats and monkeys subjected to MI, the significant reductions of cytochrome oxidase staining (Wong-Riley and Riley, 1983; Hendry and Miller, 1996) as well as GAD and GABA immunolabeling (Hendry and Jones, 1988) all recover and are indistinguishable from normal when inactivation is followed by a period of binocular vision. This indicates that inactivation does not set into motion an irreversible degenerative process that would cause permanent alteration, which distinguishes it from monocular enucleation that does elicit degeneration and loss of neurons in the dLGN (Kalil, 1980). Although we did not directly examine whether the spontaneous recovery measured after MI also occurs after an equal period of MD that is relieved at the same age, a prior study from our group provides some insight. We previously documented incomplete dLGN recovery when 10 days of binocular vision followed 6 weeks of MD started at 4 weeks of age (Duffy et al., 2018). In other words, while the effect of MD did not resolve when binocular vision was provided at 10 weeks of age, results from the current study show that the effect of MI does. Although in this comparison the timing of MD was different than that of MI, it raises the possibility of an additional distinction between MI and MD, namely, that the effects of MI are temporary and can resolve spontaneously with the restoration of binocular vision. It is important to point out that although the transient effects of inactivation on characteristics of neurons within dLGN and V1 have been documented in cats as young as 7 weeks old, the reversible nature of these alterations may not be observed when applied at much younger ages. Indeed, abnormal receptive field properties of kitten dLGN neurons has been documented following 5–8 weeks of inactivation when started neonatally (Archer et al., 1982), suggesting that abolition of retinal output can promote development of abnormal retino-geniculate connections when it occurs near the time of birth.
Following a long-term MD in which ocular dominance is shifted strongly in favor of the non-deprived eye, inactivation of the stronger eye in both mice and cats can promote recovery of visually-driven cortical responses elicited by the weaker eye (Fong et al., 2021). Similar recovery occurs in the cat dLGN, where deprived neurons rendered smaller by MD recover to their normal size when the non-deprived eye is inactivated for 10 days (Duffy et al., 2018). This recovery occurs without any detectable systemic toxicity, and several studies that have administered intravitreal TTX in cats and monkeys have reported no evidence of ocular histopathology or disruption to the eye’s normal function once the period of inactivation has passed (Wong-Riley and Riley, 1983; Wong-Riley and Carroll, 1984; Foeller and Tychsen, 2019; Dicostanzo et al., 2020). Consistent with results from the current study showing that MI can elicit a significant modification of cell size at older ages than is possible with MD, recovery from the effects of a long-term MD using fellow-eye inactivation can occur at an age when the same duration of reverse occlusion fails to produce significant recovery (Duffy et al., 2018). Given our current findings that indicate the effect of MI at 10 weeks of age appears to originate from noncompetitive mechanisms, it is possible that the inactivation-induced recovery from long-term MD is also due to noncompetitive mechanisms, rather than by creating a competitive imbalance between the eyes that occurs with occlusion therapy. It remains to be determined if the morphological effects of MI are obligatory for the functional recovery from MD. Nevertheless, the results from the current study have delineated potentially important characteristics of inactivation that may contribute to its unique potency to promote neural plasticity. It will be important to investigate the capacity for inactivation to promote recovery from MD at even older ages than have been examined to date, and to identify the molecular mechanisms that underlie this plasticity.
Acknowledgements
This work was supported by grants from the Natural Sciences and Engineering Research Council of Canada (#RGPIN-2021-02798) and the Canadian Institutes of Health Research (#468904) to KRD; from the Natural Sciences and Engineering Research Council of Canada (#RGPIN-2015-06761) to NAC; and from the National Eye Institute (R01-EY029245) to MFB.
Abbreviations
- BV
binocular vision
- dLGN
dorsal lateral geniculate nucleus
- MD
monocular deprivation
- MI
monocular inactivation
- ODI
ocular dominance index
- P
postnatal da
- PBS
phosphate buffered saline
- TTX
tetrodotoxin
- VEPs
visually-evoked potentials
Footnotes
Conflict of Interest
The authors declare no conflict of interest.
Data Availability Statement
All data presented in this manuscript are available in Excel format upon request to KRD.
References
- Antonini A, Stryker MP (1993). Rapid remodeling of axonal arbors in the visual cortex. Science, 260, 1819–1821. [DOI] [PubMed] [Google Scholar]
- Bach M, Meign T (1999) Do’s and don’ts in Fourier analysis of steady-state potentials. Documenta Ophthalmologica. Advances in Ophthalmology, 99, 69–82. [DOI] [PubMed] [Google Scholar]
- Bickford ME, Guido W, Godwim DW (1998). Neurofilament proteins in Y-cells of the cat lateral geniculate nucleus: normal expression and alteration with visual deprivation. Journal of Neuroscience, 18, 6549–6557. [DOI] [PMC free article] [PubMed] [Google Scholar]
- Blakemore C, & Van Sluyters RC (1974). Reversal of the physiological effects of monocular deprivation in kittens: further evidence for a sensitive period. The Journal of Physiology, 237, 195–216. [DOI] [PMC free article] [PubMed] [Google Scholar]
- Birch EE, & Stager DR (1988). Prevalence of good visual actuity following surgery for congenital unilateral cataract. Archives of Ophthalmology, 106, 40–43. [DOI] [PubMed] [Google Scholar]
- Bonds AB (1984) Spatial adaptation of the cortical visual evoked potential of the cat. Investigative Ophthalmology & Visual Sciences, 25, 640–646. [PubMed] [Google Scholar]
- Brainard DH (1997) The Psychophysics Toolbox. Spatial Vision. 10, 433–436. [PubMed] [Google Scholar]
- Burke MW, Zangenehpour S, & Ptito M (2009) Brain banking: making the most of your research specimens. Journal of Visualized Experiments, 29, 1260. 10.3791/1260 [DOI] [PMC free article] [PubMed] [Google Scholar]
- Caleo M, Menna E, Chierzi S, Cenni MC, Maffei L (2000) Brain-derived neurotrophic factor is an anterograde survival factor in the rat visual system. Current Biology, 10, 1155–1161. [DOI] [PubMed] [Google Scholar]
- Casagrande VA, Guillery RW, Hartling JK (1978). Differential effects of monocular deprivation seen in different layers of the lateral geniculate nucleus. Journal of Comparative Neurology, 179, 469–486. [DOI] [PubMed] [Google Scholar]
- Coleman JE, Nahmani M, Gavornik J, Haslinger R, Heynen AJ, Erisir A, Bear MF (2010). Rapid structural remodeling of thalamocortical synapses parallels experience-dependent functional plasticity in mouse primary visual cortex. Journal of Neuroscience, 30, 9670–9682. [DOI] [PMC free article] [PubMed] [Google Scholar]
- Bear MF, Colman H (1990) Binocular competition in the control of geniculate cell size depends upon cortical N-methyl-D-aspartate receptor activation. Proceedings of the National Academy of Sciences of the United States of America, 87, 9246–9249. [DOI] [PMC free article] [PubMed] [Google Scholar]
- Bear MF, Rittenhouse CD (1999). Molecular basis for induction of ocular dominance plasticity. Journal of Neurobiology, 41, 83–91. [DOI] [PubMed] [Google Scholar]
- DiCostanzo NR, Crowder NA, Kamermans BA, Duffy KR (2020) Retinal and optic nerve integrity following monocular inactivation for the treatment of amblyopia. Frontiers in Systems Neuroscience 14:32. [DOI] [PMC free article] [PubMed] [Google Scholar]
- Duffy KR, Crowder NA, LeDue EE (2012). Investigation of cytoskeleton proteins in neurons of the cat lateral geniculate nucleus. The Journal of Comparative Neurology, 520, 186–199. [DOI] [PubMed] [Google Scholar]
- Duffy KR, Fong MF, Mitchell DE, Bear MF (2018). Recovery from the anatomical effects of long-term monocular deprivation in cat lateral geniculate nucleus. Journal of Comparative Neurology, 526, 310–323. [DOI] [PubMed] [Google Scholar]
- Dürsteler MR, Garey LJ, Movshon JA (1976). Reversal of the morphological effects of monocular deprivation in the kitten’s lateral geniculate nucleus. Journal of Physiology, 261, 189–210. [DOI] [PMC free article] [PubMed] [Google Scholar]
- Foeller PE, Tychsen L (2019) Monocular retinal blockade (pharmacological occlusion therapy) in macaque monkey: spatial-sweep visually-evoked potential visual acuity, relative afferent pupillary defect, and optokinetic tracking. Investigative Ophthalmology & Visual Science, 60, 225. [Google Scholar]
- Fong MF, Mitchell DE, Duffy KR, Bear MF (2016) Rapid recovery from the effects of early monocular deprivation is enabled by temporary inactivation of the retinas. Proceedings of the National Academy of Sciences of the United States of America, 113, 14139–14144. [DOI] [PMC free article] [PubMed] [Google Scholar]
- Fong MF, Duffy KR, Leet MP, Candler CT, Bear MF (2021). Correction of amblyopia in cats and mice after the critical period. Elife, 10:e70023. [DOI] [PMC free article] [PubMed] [Google Scholar]
- Frenkel MY, Bear MF (2004). How monocular deprivation shifts ocular dominance in visual cortex of young mice. Neuron, 44, 917–923. [DOI] [PubMed] [Google Scholar]
- Giffin F, Mitchell DE (1978). The rate of recovery of vision after early monocular deprivation in kittens. The Journal of Physiology, 274, 511–537. [DOI] [PMC free article] [PubMed] [Google Scholar]
- Guillery RW, Stelzner DJ (1970). The differential effects of unilateral lid closure upon the monocular and binocular segments of the dorsal lateral geniculate nucleus in the cat. The Journal of Comparative Neurology, 139, 413–421. [DOI] [PubMed] [Google Scholar]
- Guillery RW (1972) Binocular competition in the control of geniculate cell growth. Journal of Comparative Neurology, 144, 117–130. [DOI] [PubMed] [Google Scholar]
- Guillery RW (1973) The effect of lid suture upon the growth of cells in the dorsal lateral geniculate nucleus of kittens. Journal of Comparative Neurology, 148, 417–422. [DOI] [PubMed] [Google Scholar]
- Goldstein ME, Seternberger NH, & Sternbereger LA (1987) Phosphorylation protects neurofilament against proteolysis. The Journal of Neuroimmunology, 14, 149–160. 10.1016/0165-5728(87)90049-X [DOI] [PubMed] [Google Scholar]
- Hendry SHC, Jones EG (1988) Activity-dependent regulation of GABA expression in the visual cortex of adult monkeys. Neuron, 1, 701–712. [DOI] [PubMed] [Google Scholar]
- Hendry SHC, Bhandari MA (1992) Neuronal organization and plasticity in adult monkey visual cortex: immunoreactivity for microtubule-associated protein 2. Visual Neuroscience, 9, 445–459. [DOI] [PubMed] [Google Scholar]
- Hendry SHC, Miller K (1996) Selective expression and rapid regulation of GABAA receptor subunits in geniculocortical neurons of macaque dorsal lateral geniculate nucleus. Visual Neuroscience, 13, 223–235. [DOI] [PubMed] [Google Scholar]
- Hickey TL, Spear PD, Kratz KE (1977). Quantitative studies of cell size in the cat’s dorsal lateral geniculate nucleus following visual deprivation. Journal of Comparative Neurology, 172, 265–282. [DOI] [PubMed] [Google Scholar]
- Holmes JM, & Levi DM (2018) Treatment for amblyopia as a function of age. Visual Neuroscience, 35, e015. [DOI] [PubMed] [Google Scholar]
- Horton JC, Hocking DR (1998) Monocular core zones and binocular border strips in primate striate cortex revealed by the contrasting effects of enucleation, eyelid suture, and retinal laser lesions on cytochrome oxidase activity. Journal of Neuroscience, 18, 5433–5455. [DOI] [PMC free article] [PubMed] [Google Scholar]
- Hubel DH, Wiesel TN & LeVay S (1977) Plasticity of ocular dominance columns in monkey striate cortex. Philosophical Transactions of the Royal Society B, 278, 377–409. [DOI] [PubMed] [Google Scholar]
- Iurilli G, Benfenati F, Medini P (2012) Loss of visually driven synaptic responses in layer 4 regular-spiking neurons of rat visual cortex in absence of competing inputs. Cerebral Cortex, 22, 2171–2181. [DOI] [PubMed] [Google Scholar]
- Kalil R (1980) A quantitative study of the effects of monocular enucleation and deprivation on cell growth in the dorsal lateral geniculate nucleus. Journal of Comparative Neurology, 189, 483–524. [DOI] [PubMed] [Google Scholar]
- Kupperman BD, Kasamatsu T (1983) Changes in geniculate cell size following brief monocular blockade of retinal activity in kittens. Nature, 306, 465–468. [DOI] [PubMed] [Google Scholar]
- Kutcher MR, Duffy KR (2007). Cytoskeleton alteration correlations with gross structural plasticity in the cat lateral geniculate nucleus. Visual Neuroscience, 24, 775–785. [DOI] [PubMed] [Google Scholar]
- Lein ES, Shatz CJ (2000) Rapid regulation of brain-derived neurotrophic factor mRNA within eye-specific circuits during ocular dominance column formation. Journal of Neuroscience, 20, 1470–1483. [DOI] [PMC free article] [PubMed] [Google Scholar]
- Mandolesi G, Menna E, Harauzov A, von Bartheld CS, Caleo M, Maffei L (2005) A role for retinal brain-derived neurotrophic factor in ocular dominance plasticity. Current Biology, 15, 2119–2124. [DOI] [PubMed] [Google Scholar]
- Mioche L, Singer W (1989). Chronic recordings from single sites of kitten striate cortex during experience-dependent modifications of receptive-field properties. Journal of Neurophysiology, 62, 185–197. [DOI] [PubMed] [Google Scholar]
- Movshon JA (1976) Reversal of the behavioural effects of monocular deprivation in the kitten. The Journal of Physiology, 261, 175–187. [DOI] [PMC free article] [PubMed] [Google Scholar]
- Norcia AM, Appelbaum LG, Alex JM, Cottereau BR, Rossion B (2015) The steady-state visual evoked potential in vision research: A review. Journal of Vision, 15, 4. [DOI] [PMC free article] [PubMed] [Google Scholar]
- Ochs S, and Hollingsworth D (1971). Dependence of fast axoplasmic transport in nerve on oxidative metabolism. Journal of Neurochemistry 18, 107–114. [DOI] [PubMed] [Google Scholar]
- Olson CR, & Freeman RD (1980). Profile of the sensitive period for monocular deprivation in kittens. Experimental Brain Research, 39(1), 17–21. 10.1007/BF00237065 [DOI] [PubMed] [Google Scholar]
- Pang XD, Bonds AB (1991) Visual evoked potential responses of the anesthetized cat to contrast modulation of grating patterns. Vision Research, 31, 1509–1516. [DOI] [PubMed] [Google Scholar]
- Pelli DG (1997) The Videotoolbox software for visual psychophysics: Transforming numbers into movies. Spatial Vision, 10, 437–442. [PubMed] [Google Scholar]
- Rittenhouse CD, Shouval HZ, Paradiso MA, & Bear MF (1999). Monocular deprivation induces homosynaptic long-term depression in visual cortex. Nature, 397, 347–350. [DOI] [PubMed] [Google Scholar]
- Sanderson KJ (1971). The projection of the visual field to the lateral geniculate and medial interlaminar nuclei in the cat. Journal of Comparative Neurology, 143, 101–118. [DOI] [PubMed] [Google Scholar]
- Sesma MA, Irvin GE, Kuyk TK, Norton TT, Casagrande VA (1984). Effects of monocular deprivation on the lateral geniculate nucleus in primate. Proceedings of the National Academy of Sciences of the United States of America, 81, 2255–2259. [DOI] [PMC free article] [PubMed] [Google Scholar]
- Siegle JN, Lopez AC, Patel YA, Abramov K, Ohayon S, Voigts J (2017). Open Ephys: an open-source, plugin-based platform for multichannel electrophysiology. Journal of Neural Engineering, 14, 045003. [DOI] [PubMed] [Google Scholar]
- Takahata T, Hashikawa T, Higo N, Tochitani S, Yamomori T (2008). Difference in sensory dependence of occ1/Follistatin-related protein expression between macaques and mice. Journal of Chemical Neuroanatomy, 35, 146–157. [DOI] [PubMed] [Google Scholar]
- Takahata T, Higo N, Kaas JH, Yamamori T (2009). Expression of immediate-early genes reveals functional compartments within ocular dominance columns after brief monocular inactivation. Proceedings of the National Academy of Sciences of the United States of America, 106, 12150–12155. [DOI] [PMC free article] [PubMed] [Google Scholar]
- Takahata T, Kaas JH (2017). C-FOS expression in the visual system of tree shrews after monocular inactivation. Journal of Comparative Neurology, 525, 151–165. [DOI] [PMC free article] [PubMed] [Google Scholar]
- Timney B (1983). The effects of early and late monocular deprivation on binocular depth perception in cats. Brain Research, 283, 235–243. [DOI] [PubMed] [Google Scholar]
- Thorn F, Gollender M, Erickson P (1976). The development of the kittens visual optics. Vision Research, 16, 1145–1149. [DOI] [PubMed] [Google Scholar]
- Vorobyov V, Schwarzkopf DS, Mitchell DE, Sengpiel F (2007). Monocular deprivation reduces reliability of visual cortical responses to binocular disparity stimuli. European Journal of Neuroscience, 26, 3553–3563. [DOI] [PubMed] [Google Scholar]
- Watakabe A, Komatsu Y, Sadakane O, Shimegi S, Takahata T, Higo, Noriyuki H, Tochitani S, Hashikawa T, Naito T, Osaki H, Sakamoto H, Ishikawa A, Hara S, Akasaki T, Sato H, Yamamori T (2009). Enriched expression of serotonin 1B and 2A receptor genes in macaque visual cortex and their bidirectional modulatory effects on neuronal responses. Cerebral Cortex, 19, 1915–1928. [DOI] [PMC free article] [PubMed] [Google Scholar]
- Wiesel TN, Hubel DH (1965). Extent of recovery from the effects of visual deprivation in kittens. Journal of Neurophysiology, 28, 1060–1072. [DOI] [PubMed] [Google Scholar]
- Wiesel TN, Hubel DH (1963a). Single-cell responses in striate cortex of kittens deprived of vision in one eye. Journal of Neurophysiology, 26, 1003–1017. [DOI] [PubMed] [Google Scholar]
- Wiesel TN, & Hubel DH (1963b). Effects of visual deprivation on morphology and physiology of cells in the cat’s lateral geniculate body. Journal of Neurophysiology, 26, 978–993. [DOI] [PubMed] [Google Scholar]
- Wong-Riley M, Carroll EW (1984) Effect of impulse blockade on cytochrome oxidase activity in monkey visual system. Nature, 307, 262–264. [DOI] [PubMed] [Google Scholar]
- Wong-Riley M, Riley DA (1983) The effect of impulse blockade on cytochrome oxidase activity in the cat visual system. Brain Research, 261, 185–193. [DOI] [PubMed] [Google Scholar]
- Zapasnik M, Burnat K (2013). Binocular pattern deprivation with delayed onset has impact on motion perception in adulthood. Neuroscience, 255, 99–109. [DOI] [PubMed] [Google Scholar]
Associated Data
This section collects any data citations, data availability statements, or supplementary materials included in this article.
Data Availability Statement
All data presented in this manuscript are available in Excel format upon request to KRD.